Paper Menu >>
Journal Menu >>
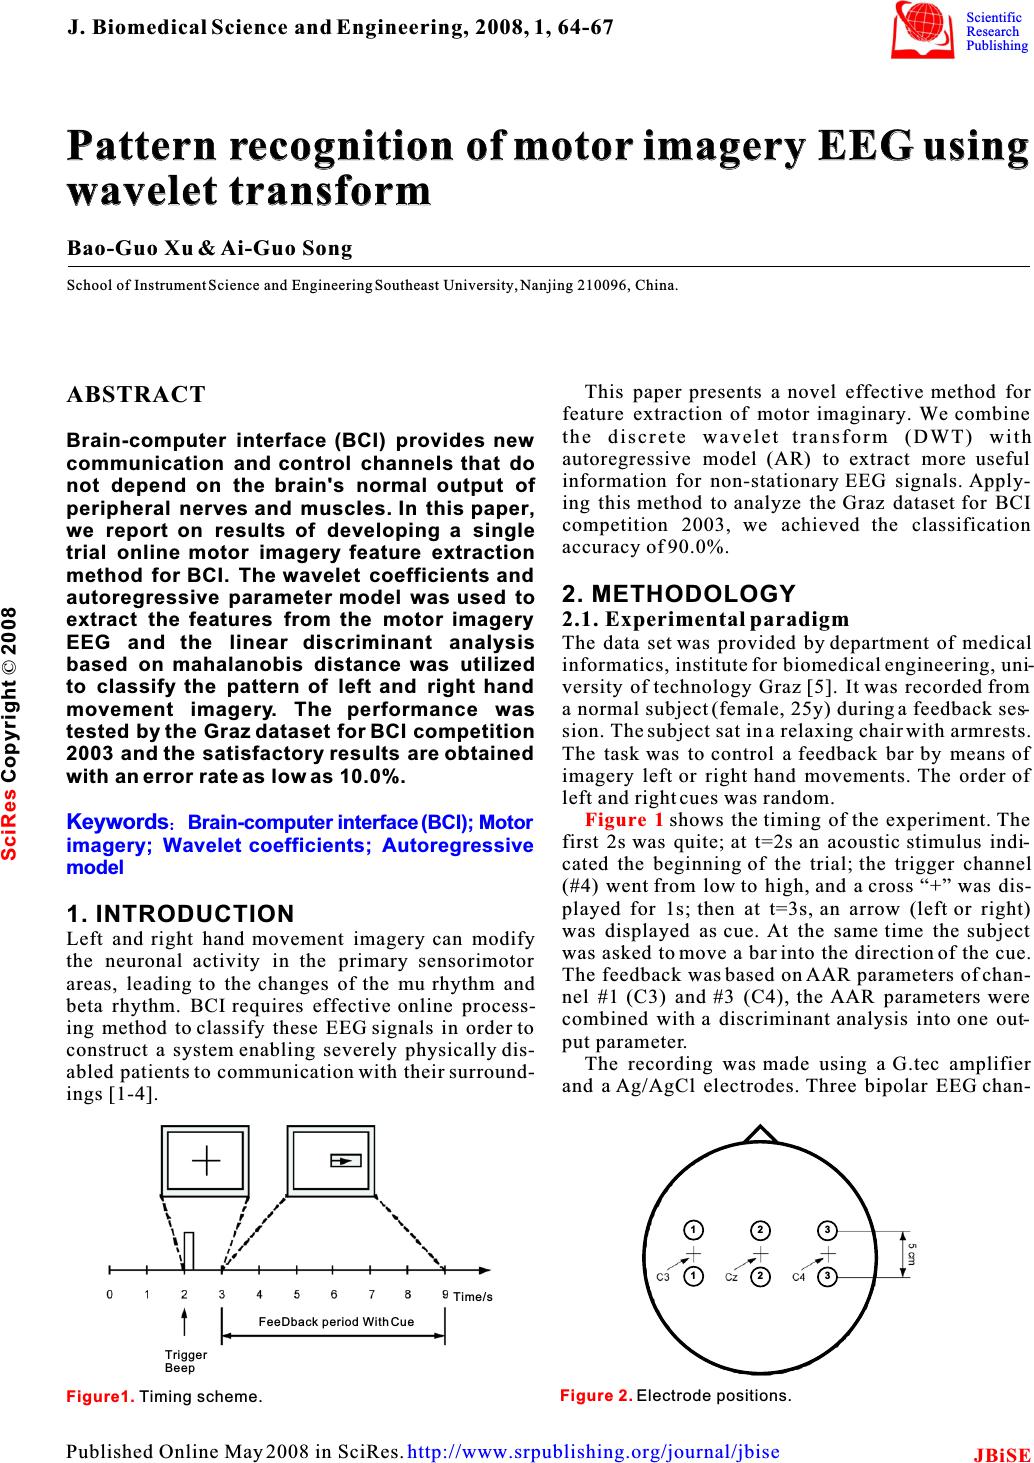 Pattern recognition of motor imagery EEG using wavelet transform Pattern recognition of motor imagery EEG using wavelet transform Bao-Guo Xu & Ai-Guo Song School of Instrument Science and Engineering Southeast University, Nanjing 210096, China. This paper presents a novel effective method for ABSTRACT feature extraction of motor imaginary. We combine the discrete wavelet transform (DWT) with Brain-computer interface (BCI) provides new autoregressive model (AR) to extract more useful communication and control channels that doinformation for non-stationary EEG signals. Apply- not depend on the brain's normal output ofing this method to analyze the Graz dataset for BCI peripheral nerves and muscles. In this paper,competition 2003, we achieved the classification we report on results of developing a singleaccuracy of 90.0%. trial online motor imagery feature extraction method for BCI. The wavelet coefficients and 2. METHODOLOGY autoregressive parameter model was used to extract the features from the motor imagery 2.1. Experimental paradigm EEG and the linear discriminant analysisThe data set was provided by department of medical based on mahalanobis distance was utilizedinformatics, institute for biomedical engineering, uni- to classify the pattern of left and right hand versity of technology Graz [5]. It was recorded from movement imagery. The performance wasa normal subject (female, 25y) during a feedback ses- tested by the Graz dataset for BCI competitionsion. The subject sat in a relaxing chair with armrests. The task was to control a feedback bar by means of 2003 and the satisfactory results are obtained imagery left or right hand movements. The order of with an error rate as low as 10.0%. left and right cues was random. shows the timing of the experiment. The first 2s was quite; at t=2s an acoustic stimulus indi- cated the beginning of the trial; the trigger channel (#4) went from low to high, and a cross “+” was dis- played for 1s; then at t=3s, an arrow (left or right) 1. INTRODUCTIONwas displayed as cue. At the same time the subject Left and right hand movement imagery can modifywas asked to move a bar into the direction of the cue. the neuronal activity in the primary sensorimotor The feedback was based on AAR parameters of chan- areas, leading to the changes of the mu rhythm andnel #1 (C3) and #3 (C4), the AAR parameters were beta rhythm. BCI requires effective online process-combined with a discriminant analysis into one out- ing method to classify these EEG signals in order to put parameter. construct a system enabling severely physically dis-The recording was made using a G.tec amplifier abled patients to communication with their surround-and a Ag/AgCl electrodes. Three bipolar EEG chan- ings [1-4]. Keywords Brain-computer interface (BCI); Motor imagery; Wavelet coefficients; Autoregressive model Figure 1 Figure1. Timing scheme.Figure 2.Electrode positions. J. Biomedical Science and Engineering, 2008, 1, 64-67Scientific Research Publishing JBiSE Published Online May 2008 in SciRes.http://www.srpublishing.org/journal/jbise FeeDback period With Cue Trigger Beep Time/s 1 23 1 23 SciRes Copyright ©2008 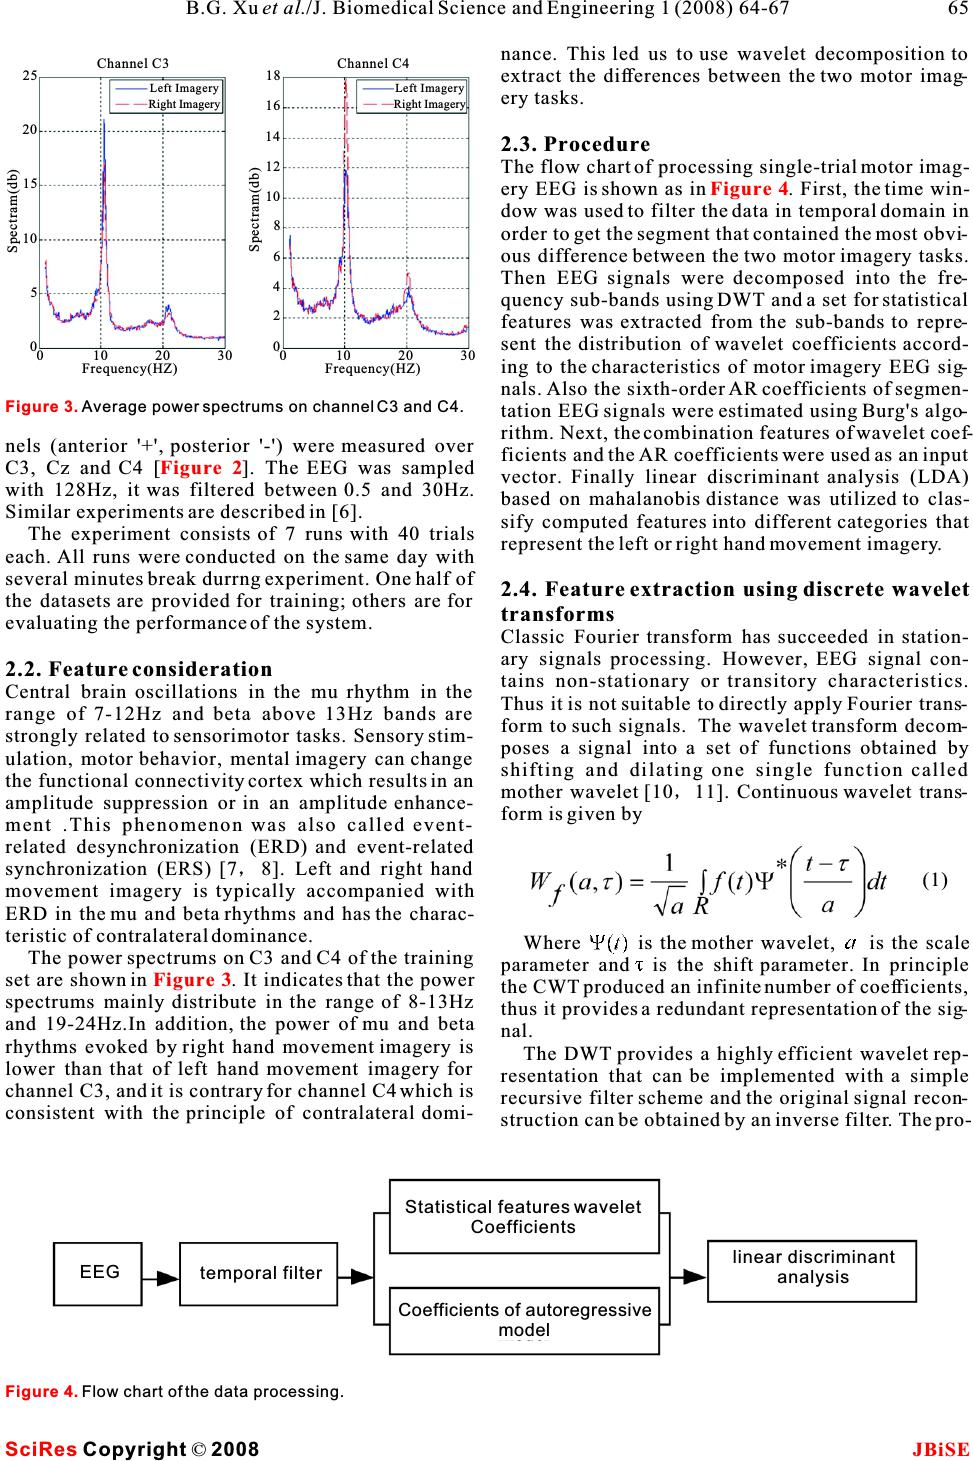 nance. This led us to use wavelet decomposition to extract the differences between the two motor imag- ery tasks. 2.3. Procedure The flow chart of processing single-trial motor imag- ery EEG is shown as in. First, the time win- dow was used to filter the data in temporal domain in order to get the segment that contained the most obvi- ous difference between the two motor imagery tasks. Then EEG signals were decomposed into the fre- quency sub-bands using DWT and a set for statistical features was extracted from the sub-bands to repre- sent the distribution of wavelet coefficients accord- ing to the characteristics of motor imagery EEG sig- nals.Also the sixth-order AR coefficients of segmen- tation EEG signals were estimated using Burg's algo- rithm. Next, the combination features of wavelet coef- nels (anterior '+', posterior '-') were measured over ficients and the AR coefficients were used as an input C3, Cz and C4 []. The EEG was sampledvector. Finally linear discriminant analysis (LDA) with 128Hz, it was filtered between 0.5 and 30Hz.based on mahalanobis distance was utilized to clas- Similar experiments are described in [6].sify computed features into different categories that The experiment consists of 7 runs with 40 trialsrepresent the left or right hand movement imagery. each.All runs were conducted on the same day with several minutes break durrng experiment. One half of2.4. Feature extraction using discrete wavelet the datasets are provided for training; others are for transforms evaluating the performance of the system.Classic Fourier transform has succeeded in station- ary signals processing. However, EEG signal con- 2.2. Feature considerationtains non-stationary or transitory characteristics. Central brain oscillations in the mu rhythm in the Thus it is not suitable to directly apply Fourier trans- range of 7-12Hz and beta above 13Hz bands are form to such signals. The wavelet transform decom- strongly related to sensorimotor tasks. Sensory stim-poses a signal into a set of functions obtained by ulation, motor behavior, mental imagery can change shifting and dilating one single function called the functional connectivity cortex which results in an mother wavelet [1011]. Continuous wavelet trans- amplitude suppression or in an amplitude enhance-form is given by ment .This phenomenon was also called event- related desynchronization (ERD) and event-related synchronization (ERS) [78]. Left and right hand movement imagery is typically accompanied with ERD in the mu and beta rhythms and has the charac- teristic of contralateral dominance.Where (t) is the mother wavelet, is the scale The power spectrums on C3 and C4 of the trainingparameter andis the shift parameter. In principle set are shown in . It indicates that the powerthe CWT produced an infinite number of coefficients, spectrums mainly distribute in the range of 8-13Hzthus it provides a redundant representation of the sig- and 19-24Hz.In addition, the power of mu and betanal. rhythms evoked by right hand movement imagery is The DWT provides a highly efficient wavelet rep- lower than that of left hand movement imagery for resentation that can be implemented with a simple channel C3, and it is contrary for channel C4 which is recursive filter scheme and the original signal recon- consistent with the principle of contralateral domi-struction can be obtained by an inverse filter. The pro- Figure 4 Figure 2 Figure 3 Figure 4.Flow chart of the data processing. (1) SciRes JBiSE Copyright © 2008 B.G. Xuet al./J. Biomedical Science and Engineering 1 (2008) 64-67 65 Figure 3.Average power spectrums on channel C3 and C4. Frequency(HZ) Spectram(db) 0 10 20 30010 5 15 25 20 Frequency(HZ) 20 30010 0 10 Channel C3Channel C4 18 16 14 12 8 6 4 2 Spectram(db) Left Imagery Right Imagery Left Imagery Right Imagery Statistical features wavelet Coefficients Coefficients of autoregressive model EEG temporal filterlinear discriminant analysis 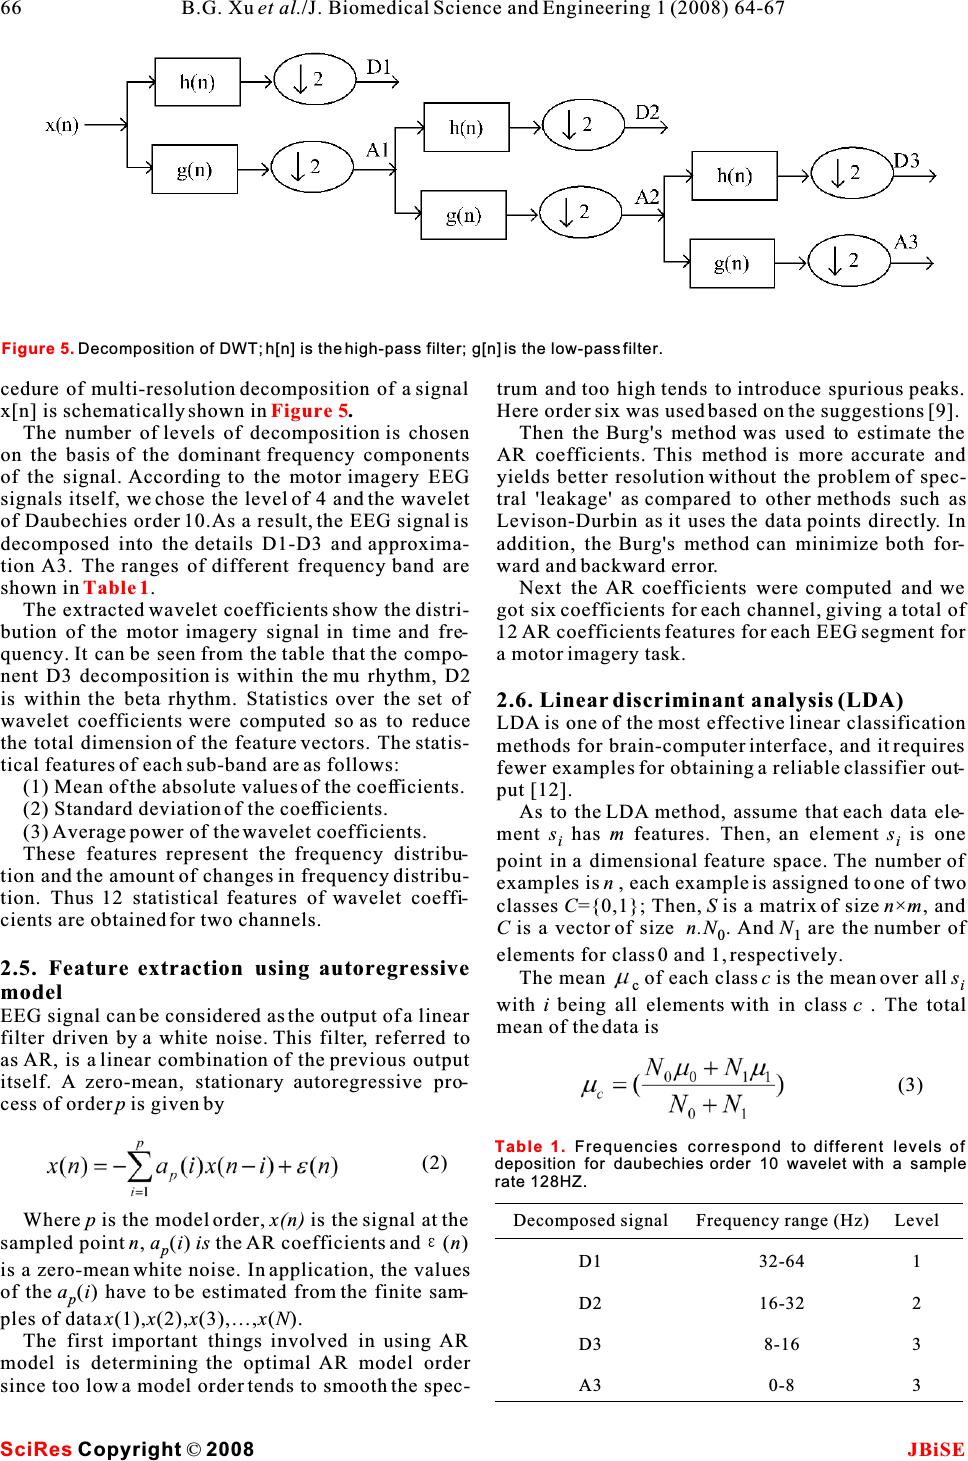 cedure of multi-resolution decomposition of a signal trum and too high tends to introduce spurious peaks. x[n] is schematically shown in .Here order six was used based on the suggestions [9]. The number of levels of decomposition is chosen Then the Burg's method was used to estimate the on the basis of the dominant frequency components AR coefficients. This method is more accurate and of the signal. According to the motor imagery EEG yields better resolution without the problem of spec- signals itself, we chose the level of 4 and the wavelet tral 'leakage' as compared to other methods such as of Daubechies order 10.As a result, the EEG signal is Levison-Durbin as it uses the data points directly. In decomposed into the details D1-D3 and approxima-addition, the Burg's method can minimize both for- tionA3. The ranges of different frequency band areward and backward error. shown in .Next the AR coefficients were computed and we The extracted wavelet coefficients show the distri-got six coefficients for each channel, giving a total of bution of the motor imagery signal in time and fre-12AR coefficients features for each EEG segment for quency. It can be seen from the table that the compo-a motor imagery task. nent D3 decomposition is within the mu rhythm, D2 is within the beta rhythm. Statistics over the set of2.6. Linear discriminant analysis (LDA) wavelet coefficients were computed so as to reduceLDA is one of the most effective linear classification the total dimension of the feature vectors. The statis-methods for brain-computer interface, and it requires tical features of each sub-band are as follows:fewer examples for obtaining a reliable classifier out- (1) Mean of the absolute values of the coefficients.put [12]. (2) Standard deviation of the coefficients.As to the LDA method, assume that each data ele- (3)Average power of the wavelet coefficients.ment shas m features. Then, an elements is one ii These features represent the frequency distribu-point in a dimensional feature space. The number of tion and the amount of changes in frequency distribu-examples is n, each example is assigned to one of two tion. Thus 12 statistical features of wavelet coeffi-classes C={0,1}; Then,Sis a matrix of size n×m, and cients are obtained for two channels.Cis a vector of sizen.N. And N are the number of 01 elements for class 0 and 1, respectively. 2.5. Feature extraction using autoregressive The mean of each classc is the mean over all s ci model with i being all elements with in classc. The total EEG signal can be considered as the output of a linear mean of the data is filter driven by a white noise. This filter, referred to asAR, is a linear combination of the previous output itself.A zero-mean, stationary autoregressive pro- cess of orderp is given by Wherep is the model order, x(n) is the signal at the sampled pointn,a(i)is the AR coefficients and(n) p is a zero-mean white noise. In application, the values of thea(i) have to be estimated from the finite sam- p ples of datax(1),x(2),x(3),…,x(N). The first important things involved in using AR model is determining the optimal AR model order since too low a model order tends to smooth the spec- Figure 5 Table 1 Figure 5.Decomposition of DWT; h[n] is the high-pass filter; g[n] is the low-pass filter. Decomposed signal D1 D2 D3 A3 Frequency range (Hz) 32-64 16-32 8-16 0-8 Level 1 2 3 3 Table 1.Frequencies correspond to different levels of deposition for daubechies order 10 wavelet with a sample rate 128HZ. SciRes JBiSE Copyright © 2008 66B.G. Xuet al./J. Biomedical Science and Engineering 1 (2008) 64-67 (2) (3) 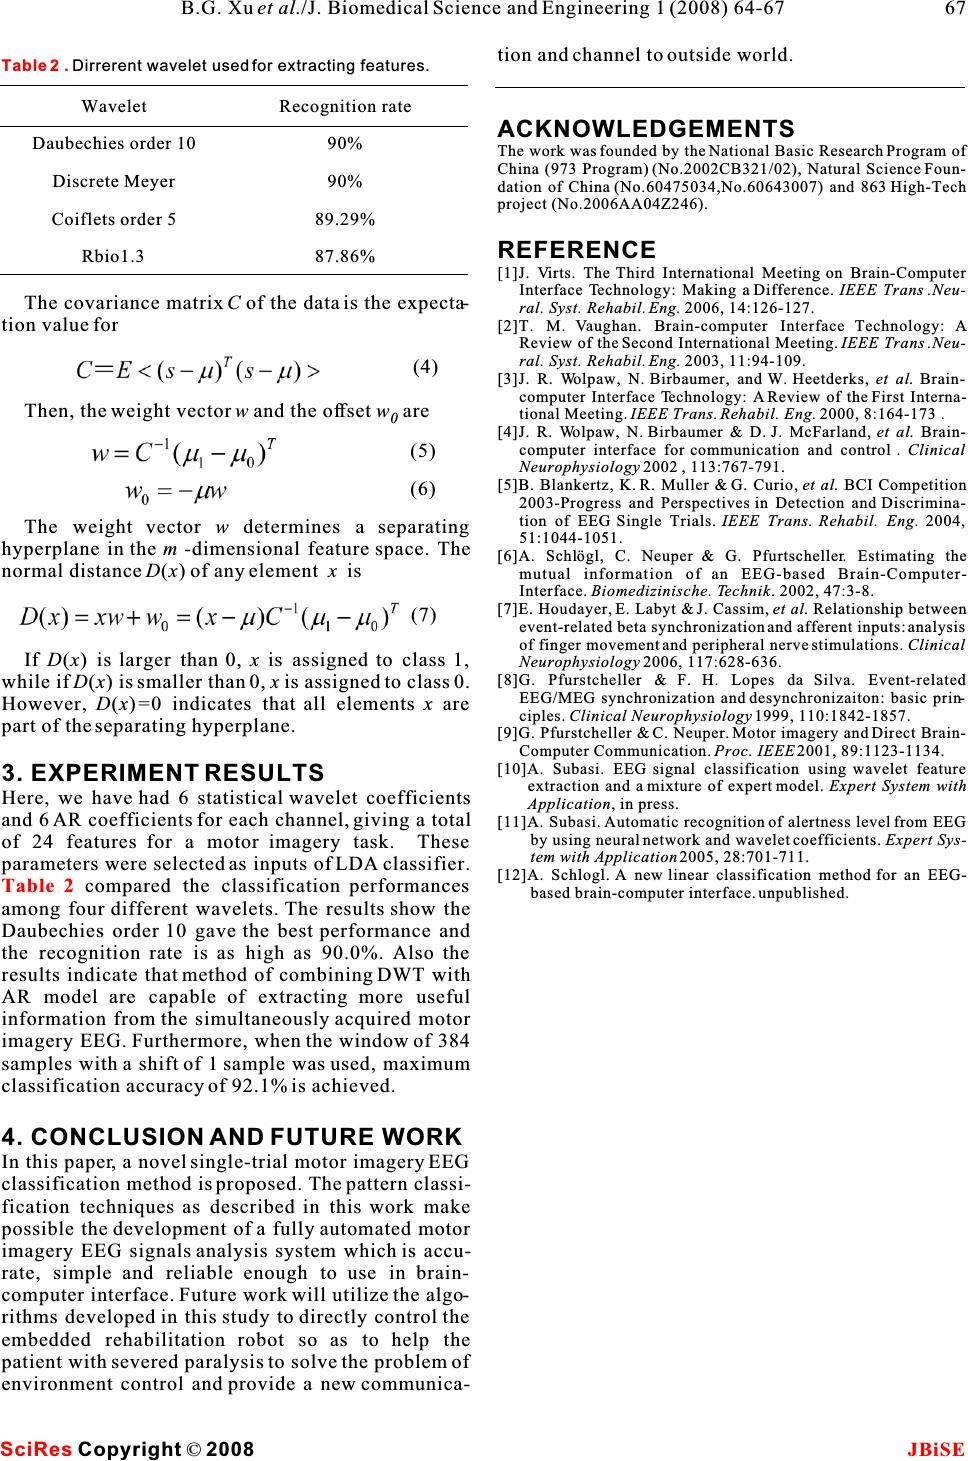 tion and channel to outside world. ACKNOWLEDGEMENTS The work was founded by the National Basic Research Program of China (973 Program) (No.2002CB321/02), Natural Science Foun- dation of China (No.60475034,No.60643007) and 863 High-Tech project (No.2006AA04Z246). REFERENCE [1]J. Virts. The Third International Meeting on Brain-Computer Interface Technology: Making a Difference. IEEE Trans .Neu- The covariance matrixC of the data is the expecta-ral. Syst. Rehabil. Eng. 2006, 14:126-127. tion value for[2]T. M. Vaughan. Brain-computer Interface Technology: A Review of the Second International Meeting.IEEE Trans .Neu- ral. Syst. Rehabil. Eng. 2003, 11:94-109. [3]J. R. Wolpaw, N. Birbaumer, and W. Heetderks, et al.Brain- computer Interface Technology: A Review of the First Interna- Then, the weight vectorwand the offsetw aretional Meeting. IEEE Trans. Rehabil. Eng. 2000, 8:164-173 . 0[4]J. R. Wolpaw, N. Birbaumer & D. J. McFarland, et al. Brain- computer interface for communication and control . Clinical Neurophysiology 2002, 113:767-791. [5]B. Blankertz, K. R. Muller & G. Curio, et al. BCI Competition 2003-Progress and Perspectives in Detection and Discrimina- tion of EEG Single Trials.IEEE Trans. Rehabil. Eng. 2004, The weight vector w determines a separating 51:1044-1051. hyperplane in the m -dimensional feature space. The[6]A. Schlögl, C. Neuper & G. Pfurtscheller. Estimating the normal distance D(x)of any elementx ismutual information of an EEG-based Brain-Computer- Interface. Biomedizinische. Technik. 2002, 47:3-8. [7]E. Houdayer, E. Labyt & J. Cassim, et al. Relationship between event-related beta synchronization and afferent inputs: analysis of finger movement and peripheral nerve stimulations. Clinical If D(x) is larger than 0, x is assigned to class 1, Neurophysiology 2006, 117:628-636. [8]G. Pfurstcheller & F. H. Lopes da Silva. Event-related while if D(x) is smaller than 0, x is assigned to class 0. EEG/MEG synchronization and desynchronizaiton: basic prin- However,D(x)=0 indicates that all elements x are ciples. Clinical Neurophysiology1999, 110:1842-1857. part of the separating hyperplane.[9]G. Pfurstcheller & C. Neuper. Motor imagery and Direct Brain- Computer Communication. Proc. IEEE2001, 89:1123-1134. [10]A. Subasi. EEG signal classification using wavelet feature 3. EXPERIMENT RESULTSextraction and a mixture of expert model. Expert System with Here, we have had 6 statistical wavelet coefficientsApplication, in press. and 6 AR coefficients for each channel, giving a total[11]A. Subasi. Automatic recognition of alertness level from EEG by using neural network and wavelet coefficients. Expert Sys- of 24 features for a motor imagery task.Thesetem with Application2005, 28:701-711. parameters were selected as inputs of LDA classifier.[12]A. Schlogl. A new linear classification method for an EEG- compared the classification performances based brain-computer interface. unpublished. among four different wavelets. The results show the Daubechies order 10 gave the best performance and the recognition rate is as high as 90.0%. Also the results indicate that method of combining DWT with AR model are capable of extracting more useful information from the simultaneously acquired motor imagery EEG. Furthermore, when the window of 384 samples with a shift of 1 sample was used, maximum classification accuracy of 92.1% is achieved. 4. CONCLUSION AND FUTURE WORK In this paper, a novel single-trial motor imagery EEG classification method is proposed. The pattern classi- fication techniques as described in this work make possible the development of a fully automated motor imagery EEG signals analysis system which is accu- rate, simple and reliable enough to use in brain- computer interface. Future work will utilize the algo- rithms developed in this study to directly control the embedded rehabilitation robot so as to help the patient with severed paralysis to solve the problem of environment control and provide a new communica- Table 2 Wavelet Daubechies order 10 Discrete Meyer Coiflets order 5 Rbio1.3 Recognition rate 90% 90% 89.29% 87.86% Table 2 . Dirrerent wavelet used for extracting features. (5) (6) SciRes JBiSE Copyright © 2008 67 B.G. Xuet al./J. Biomedical Science and Engineering 1 (2008) 64-67 (4) (7) |