International Journal of Geosciences
Vol.4 No.10(2013), Article ID:41572,8 pages DOI:10.4236/ijg.2013.410145
Hydrological Study of Watersheds Arid and Semi-Arid South-Eastern Algeria (Chott Melghir, Chott El Hodna and Highlands Constantine)
1Magister in Hydraulic Sciences, University of Ouargla, Ouargla, Algeria
2Laboratoire d’Exploitation et de Valorisation des Ressources Naturelles en Zones Arides Université d’Ouargla, Ouargla, Algeria
Email: *faresbelagoune@yahoo.fr
Copyright © 2013 Fares Belagoune, Djamel Boutoutaou. This is an open access article distributed under the Creative Commons Attribution License, which permits unrestricted use, distribution, and reproduction in any medium, provided the original work is properly cited. In accordance of the Creative Commons Attribution License all Copyrights © 2013 are reserved for SCIRP and the owner of the intellectual property Fares Belagoune, Djamel Boutoutaou. All Copyright © 2013 are guarded by law and by SCIRP as a guardian.
Received September 4, 2013; revised October 1, 2013; accepted November 1, 2013
Keywords: Flood; Watershed; Specific Flow; Coefficient of Variation; Arid
ABSTRACT
The objective of the study is to establish the hydrological characteristics, the hydrological behavior of river basins in arid and semi-arid south-eastern Algeria (establish of methodologies and necessary working tools for planning the development and management of water resources). The study on floods in Algeria is established by the National Agency of Water Resources (ANRH shows that the country is confronted with the phenomenon of very destructive floods and floods especially in arid and semi-arid regions). Flooding of rivers in these areas is less known. They are characterized by their sudden duration (rain showers, thunderstorm). The duration of the flood is in the order of minutes to hours. The human and material damages caused by these floods are still high. The study area encompasses three watersheds in semi-arid, arid south and Algeria. There are pools of Chott-Melghir (68,751 km2), highland Constantine-07 (9578 km2) and El Hodna-05 basin (25,843 km2). The total area of this zone is about 104,500km2. Studies of protection against floods and design studies of hydraulic structures (spillway, storm basin, etc.) require the raw data which are often unknown in several places particularly at ungauged wadis of these areas.
1. Introduction
Flooding is a submersion (fast or slow) which may affect large natural and urban areas; it corresponds to the overflow of water during a flood. By definition, a flood is a rapid and temporary flow of a river. It is described by three parameters: height, speed and velocity.
The floods happen when soil and vegetation cannot absorb any water runoff and cause elevation of the bed of the river. Most often, it does not overflow, but the water runs sometimes in quantities which cannot be transported in the beds of rivers to the basins or retained in natural or artificial. The river overflows and then produces a flood.
Flash floods, which can occur in autumn in the Mediterranean region, are generally due to intense precipitation over a relatively confined area, intensive agricultural practices diminish.
The man has aggravated flooding in degrading the natural environment around some rivers (waterproofing watershed).
It is well known that soil sealing by buildings and infrastructures has the effect of increasing runoff coefficients and thus accelerating the flow of water and aggravating downstream flows received. For these conditions, failure of sewerage is considered one of the causes of this phenomenon.
The impact of these floods is relatively local, and the number of victims is generally limited, but very variable due to the density of housing, location and type of construction adopted.
Recurring event anywhere in the world, this phenomenon has affected most of the countries. These countries have climatic conditions, geological risk as well as poor infrastructure in terms of protection of man and the environment. For example, Indian Ocean to Bangladesh, sometimes as in 1970, this phenomenon leads the death of several people.
Correct dimensioning of spillways (spillway channels, pipes ditches, etc.), is based on good values assessment of flood flows necessary for the determination of structures template. It is therefore to study the link flood streams for the design of spillways. The objective of the study is to propose a methodology for these areas of flood calculation for ungauged rivers.
The great watershed Chott Melghir about a surface area of 68.751 km2, including thirty (30) sub-watersheds, located in arid steppic, is representative of the Mediterranean region, particularly because of the diversity of habitats it contains: chott and sebkha. We meet halipedes, ever green around the Chott steppe zones and in the center, saturated salt sebkhas completely devoid of vegetation. The vegetation formations of wetlands are added to these which meet a lake and paludicole purely aquatic vegetation.
Geographic Coordinates: Longitude: 34˚00'00'' and 34˚30'01'' North Latitude: 6˚07'30'' and 6˚30'02''East [1].
Chott El Hodna is a representative type of humid zone in the Mediterranean by the extent of its size and its watershed (Figure 1). Its location in the arid zone is another advantage to justify the degree of rarity of natural environments in one piece with little or no significant changes by human.
Finally, Chott is a model representative of the presence

Figure 1. Station location study.
of many types of soil, bioclimatic and organic varieties.
Chott El Hodna covers two wilaya M’Sila of 1000 km2, and Batna 100 km2, located south-east of Algeria and isolated from the Mediterranean Sea by 100 to 150 km mountain ranges. This ecosystem that occupies the center of the basin of Hodna is located 40 km from the City of M’sila, 20 km south-west of the city of Boussaâda and 80 km south-east of the city of Biskra.
Geographic Coordinates: Latitude: 35˚18'/35˚32' Longitude: 4˚15'/5˚06' [2].
Highland Constantine is located in the bioclimatic semiarid to arid (200 to 400 mm/yr precipitation) and contains large inland salt depressions called saline lakes and sebkhas.
Geographic Coordinates: Latitude: 35˚44 '69''North Longitude: 06˚47'43''East [3].
This area contains the main sources of surface water and hydraulic infrastructure.
For small watersheds in western Switzerland, Niggli proposed a method of calculating flood frequency adapted to the following rational method:
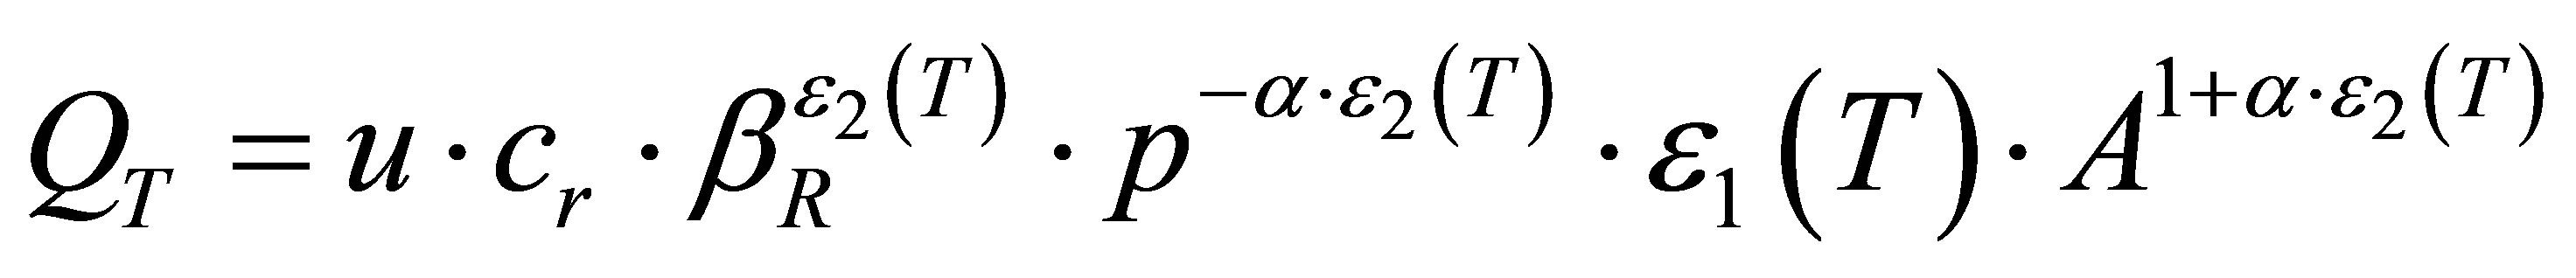 (1)
(1)
Where:
 and
and : parameters intensity-duration-frequency curves Montana law.
 : Flow max frequency return period T (m3/s).
 : Constant change of units.
A and p: respectively the surface and the slope of the watershed.
 : runoff coefficient of the watershed.
 : Watershed dependent parameter. [4]
2. Materials and Methods
Data flow rates maximum instantaneous floods from the files of the National Water Resources Agency (ANRH).
These flows rates are recorded at 15 hydrometrics stations distributed uniformly over the entire surface of the three watersheds. The observation period ranged from 15 to 39 years (Table 1) [5].
A file was created identifying all flows max (date of the flood and its value in m3/s). After forming rows max flow statistics instantaneous adjustment to theoretical laws was conducted to determine the quantile of these flows.
The best adjustment is given by the lognormal law [6]. For illustration we present in Figure 2 is an example of the law of adjustment lognormal flow rates max wadi K’Sob Station Madjez.
Table 2 shows the values of flow rates max adjustment, the statistical parameters adjustment namely the flow rates max average annual snapshot ( ) and the coefficient of variation (CV).
2.1. Introduction a Model to Estimate Flood
2.1.1. Example of Multivariate Analysis Frequency
The objective of this Model is to provide a trivariate flood frequency analysis (Tip, volume and duration) using a copula (meta-elleptique). So a class of so-called metaelliptical copula was used to perform a trivariate modeling Tip, volume and duration of flooding. A suitability test type Cramer-von Mises recently developed by Genest et al. (2006) has also been implemented in order to find the best fit. This methodology has been applied on three watersheds in semi-arid areas in Algeria.
A copula is a multivariate uniform distribution. This is a relatively old statistical tool introduced by Sklar (1959) revived today by Genest and Mackay (1986). “Copulas are functions that join or couple multivariate functions to their one dimensional margins” [7].
“Copulas are distribution functions whose one dimensional margins are uniform” [7].
But the last two sentences are not an appropriate defi-

Table 1. Hydrometric stations and observation period.
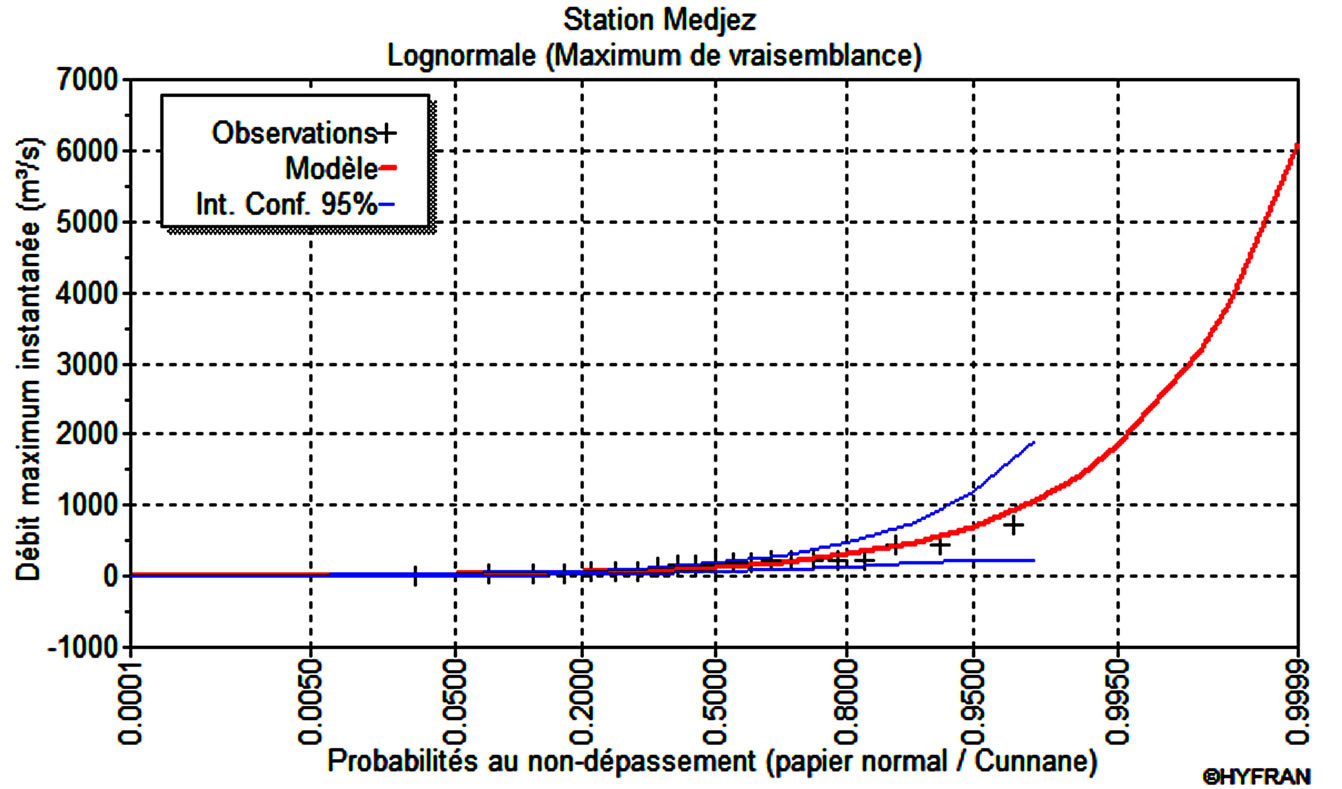
Figure 2. Adjustment of flow rates max of wadi K’Sob station Medjez.
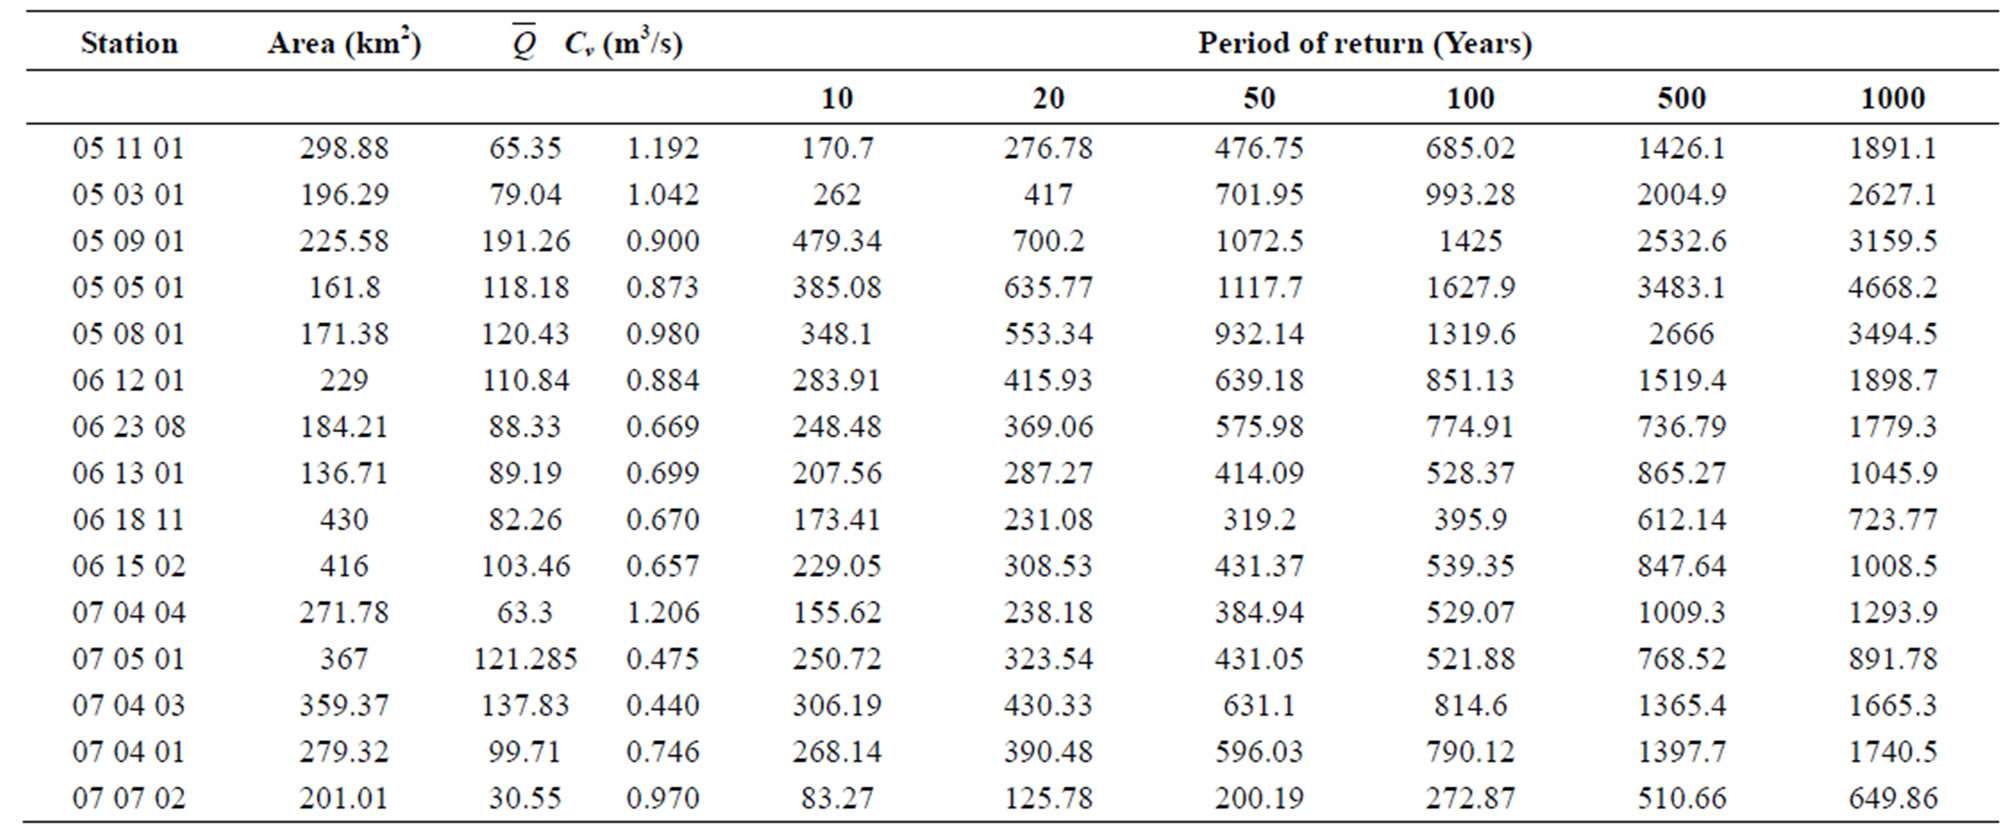
Table 2. Result of adjusting flow rates max frequency (m3/s)
nition In the following text, with reference to the work of Nelsen (1998), Genest & MacKay (1986), Denuit & Charpentier (2004), we will try to give a precise definition of the copula, as well as some basic methods for parameter estimation of copula properties will be reviewed and fit testing to select the copula we describe each of the margins which is uniform on the interval (0,1). Given such a copula, we can easily construct a multivariate law of margins F1,∙∙∙, Fp arbitrary asking [8].
 . (2)
. (2)
If for example x1, x 2, x 3 represent the Tip, volume and duration of a flood, it is possible, using this approach to construct a law having margins [9].
2.1.2. The Multivariate Statistical Analysis
The correlation between the Tip, volume and duration, it is clear that an analysis of each of these variables taken separately is inadequate. A natural way to overcome this problem is to use multidimensional laws, such as the normal distribution or gamma Multivariate. However, conventional three-dimensional laws impose virtually all use of marginal distributions of the same type for the three variables. However, this requirement is unrealistic in our case, since the laws of the univariate Tip, volume and duration of the flood of the same watershed are very different. The copula approach, which has gained much popularity in recent years, offers a promising approach that we have chosen to explore.
2.1.3. Dependency Analysis
The dependency analysis can start two different ways, either by examining statistical properties or by graphics. Statistically, three classical measurements were used, namely the Pearson correlation coefficient, the Spearman’s rho and Kendall’s tau. Their definitions recalled below are from Capéraà and Van Cutsem [9] (e.g. wadi case Soubella) (Table 3).
2.2. Simulation Algorithm of Meta-Elliptical Copula
Applications using the copula are more and more common in different areas of scientific literature. The Archimedean copula are used, but we also see more and more articles using the meta-elliptical copulas [8]. In our case, the parameter m (degree of freedom) of the function g laws Student and Pearson Type II Multivariate been selected using a graphical tool (Programm R). To do this, we have been using bivariate scatter diagrams representing a simulation size of 10,000 family law chosen with the parameter “g” given function, juxtaposed with the values observed for this particular case. For example, consider the case of Soubella for the Student trivariate. As a result for example, the results show that flooding for m = 2, Will not exceed 900 (m3/s) for T = 100 years, as we will see and verify in our model
2.3. Modeling of Flood Flow Frequency
The model for calculating flow rates max for the proposed frequency streams of the study area is based on the following proposals:
1) The good adequacy empirical data (observational data) to the law of distribution (lognormal) for all samples (15 samples) max flow to suppose that this law is valid at all points of the of watersheds area of the study area.
2) According to Dubreuil [10], the best adjustment is given by the log normal law recommended dissymmetry Diet desert and sub-desert The density of the Galton law is presented as follows:

So the Log normal distribution law (Galton) max flow and return period T is chosen as a model and is presented by the following formula:

Table 3. Measures the dependence between the Tip, the volume and duration of Wadi Soubella.
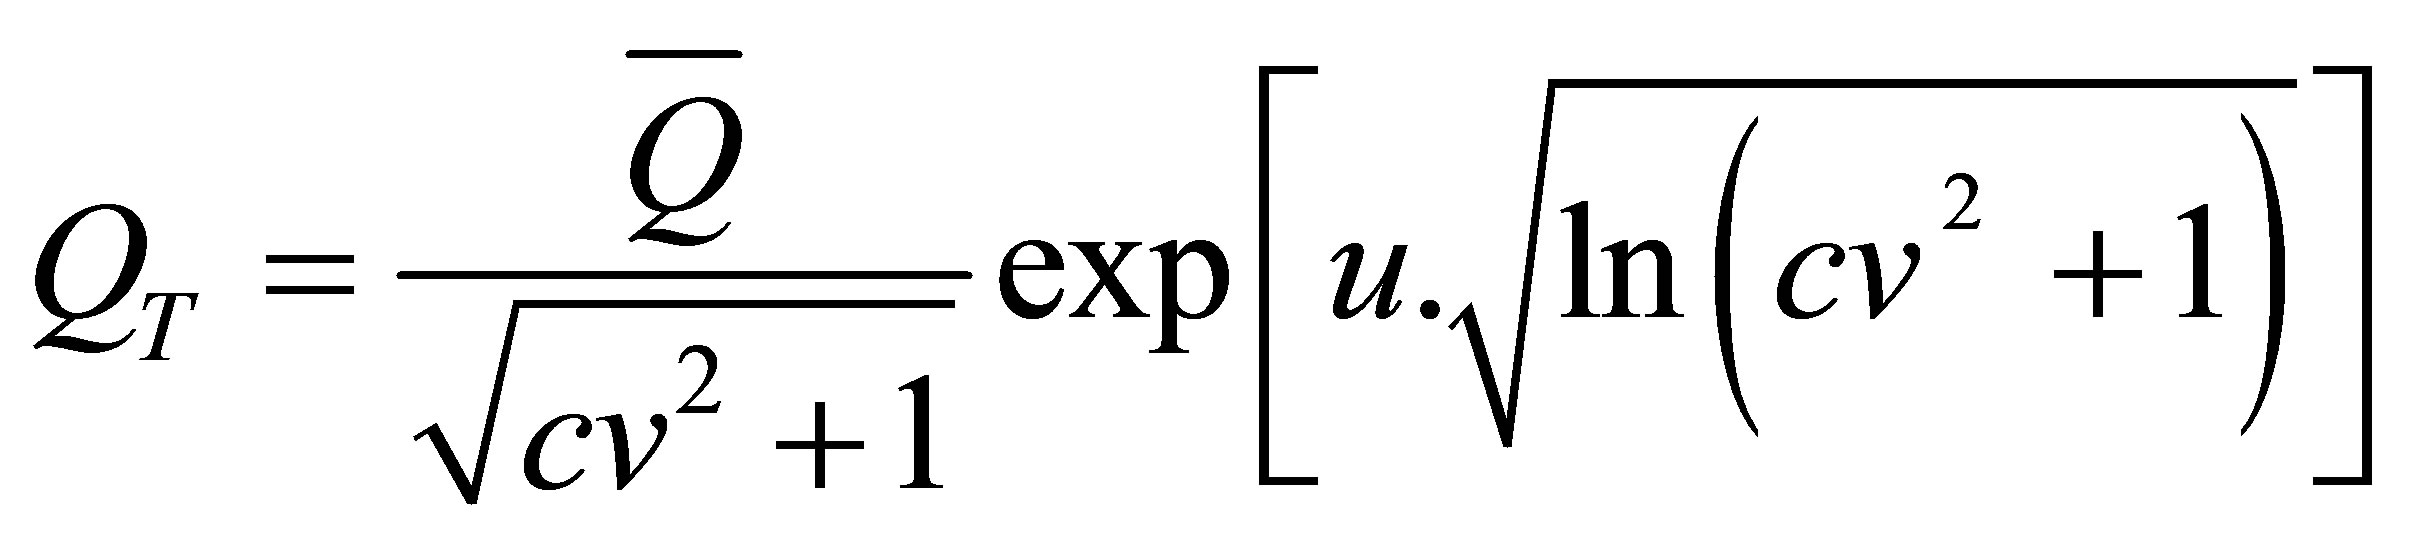 (3)
(3)
With:
 : flow max frequency return period T (m3/s)
 : Average annual maximum flow rates (m3/s)
CV: coefficient of variation u: reduced variable of Gauss, with values are tabulated and selected according to the frequency (return period)
The flow ( ) average annual instantaneous maximum flow rates will be replaced by (
 )
)
 : Average annual maximum instantaneous flow specific (m3/s∙km2)
S: Watershed area (Km2)
2.4. Determination of Parameters ( 5 />) and (Cv) of the Model
Several authors connect the maximum specific rate, a single argument which is often the watershed area. Experience indicates that the water takes longer to concentrate on it as their emissary the basin is more extensive and rain and snow usually peak over the entire watershed at a time. Specific flood flow is primarily a function of the extent the watershed and inversely proportional. This means that the maximum flood believes slower than the watershed area.
Numerous studies conducted in several countries [11, 12] to analyze the maximum flow rates depending on the watershed area led to formulas whose prototype is that of:
Myer: ; (with: en m3/s∙S en Km2) (4)
C: coefficient of Myer, according to the physical characteristics the watershed
α: Exponent varies between 0.4 - 0.8 Franco and Rodier: 
 (5)
(5)
Pagliaro: 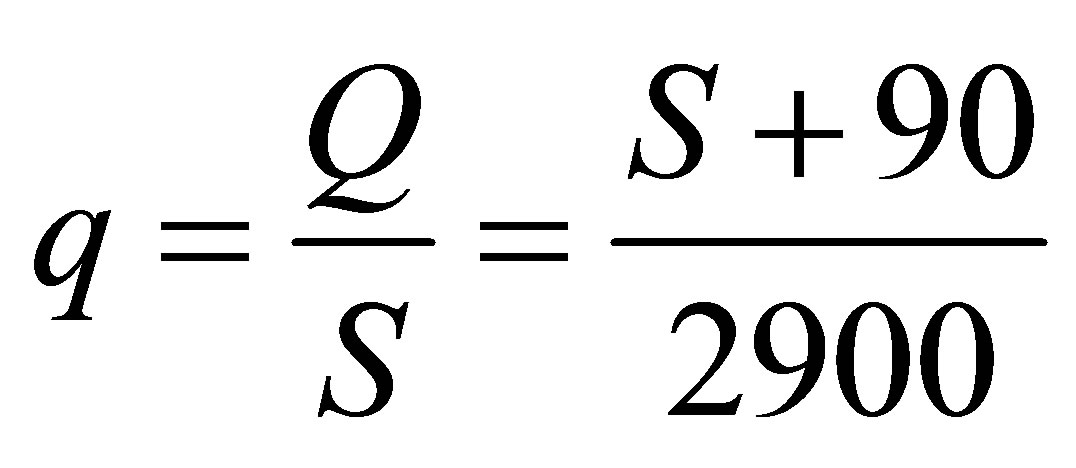 [Q (m3/s) and
 (6)
(6)
2.5. Determination of Instantaneous Maximum Specific Flow Rate (Annual Average) 
The extrapolation of these models to the arid and semiarid regions of Algeria confirms the decrease of maximum specific flow rate with the decrease of air the watershed (Figure 3).
The correlation between these two hydrological characteristics is very strong and is reflected by a correlation coefficient R = 0.91 La relation giving the maximum value of the specific flow rate based on the surface watershed for arid and semi-arid regions of the Algeria is:
 (7)
(7)
2.6. Determination the Coefficient of Variation (Cv)
Experience shows that the hydrological territorial or spatial variation of several parameters of the flow (flood, drought, etc.).Is the result of the interaction of several factors physical geography and climate of a particular geographical area. It is possible to interpolate the values measured in the hydrometric sites. Early methods of determining the coefficient of variation in the absence of measurement data are formulas and empirical relations [13]. The majority of these formulas relate the coefficient of variation in principal factors, hydrometeorological and physical factors of watersheds. The analysis of the relation between the coefficient of variation Cv, flow maximum specific and watershed area (Figure 4) shows that the points align well around the line of adjustment this correlation resulted in a simple following exponential relation of:
 (8)
(8)
 (9)
(9)
3. Results and Discussions
Analyzes and results obtained above can offer a formula maximum instantaneous flood discharges frequency domain ungauged water in semi-arid and arid regions of Algeria. This formula is based on the log-normal distribution, generalized distribution for all regions and including the main parameters (watershed area and maximum specific flow rate) is involved in the genesis of flooding.
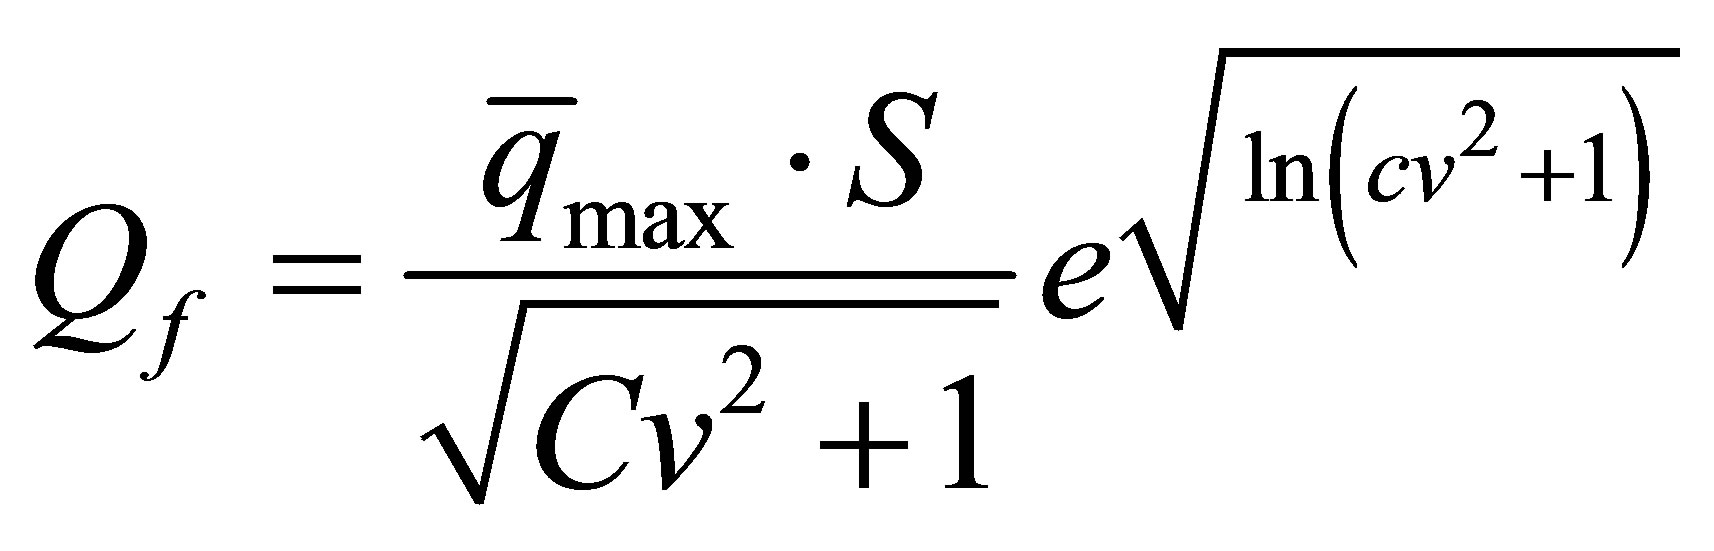 (10)
(10)
Table 4 is summary of the comparison between the calculated and measured flood. This comparison shows that the flood values are close to those modeled measured average calculation error does not exceed 16%.
We wish to specify that the change to high peak flows

Figure 3. Relation between maximum specific flow and Watershed surface in Regions arid and semi-arid of Algeria.

Figure 4. Relation between  and log (S + 1).
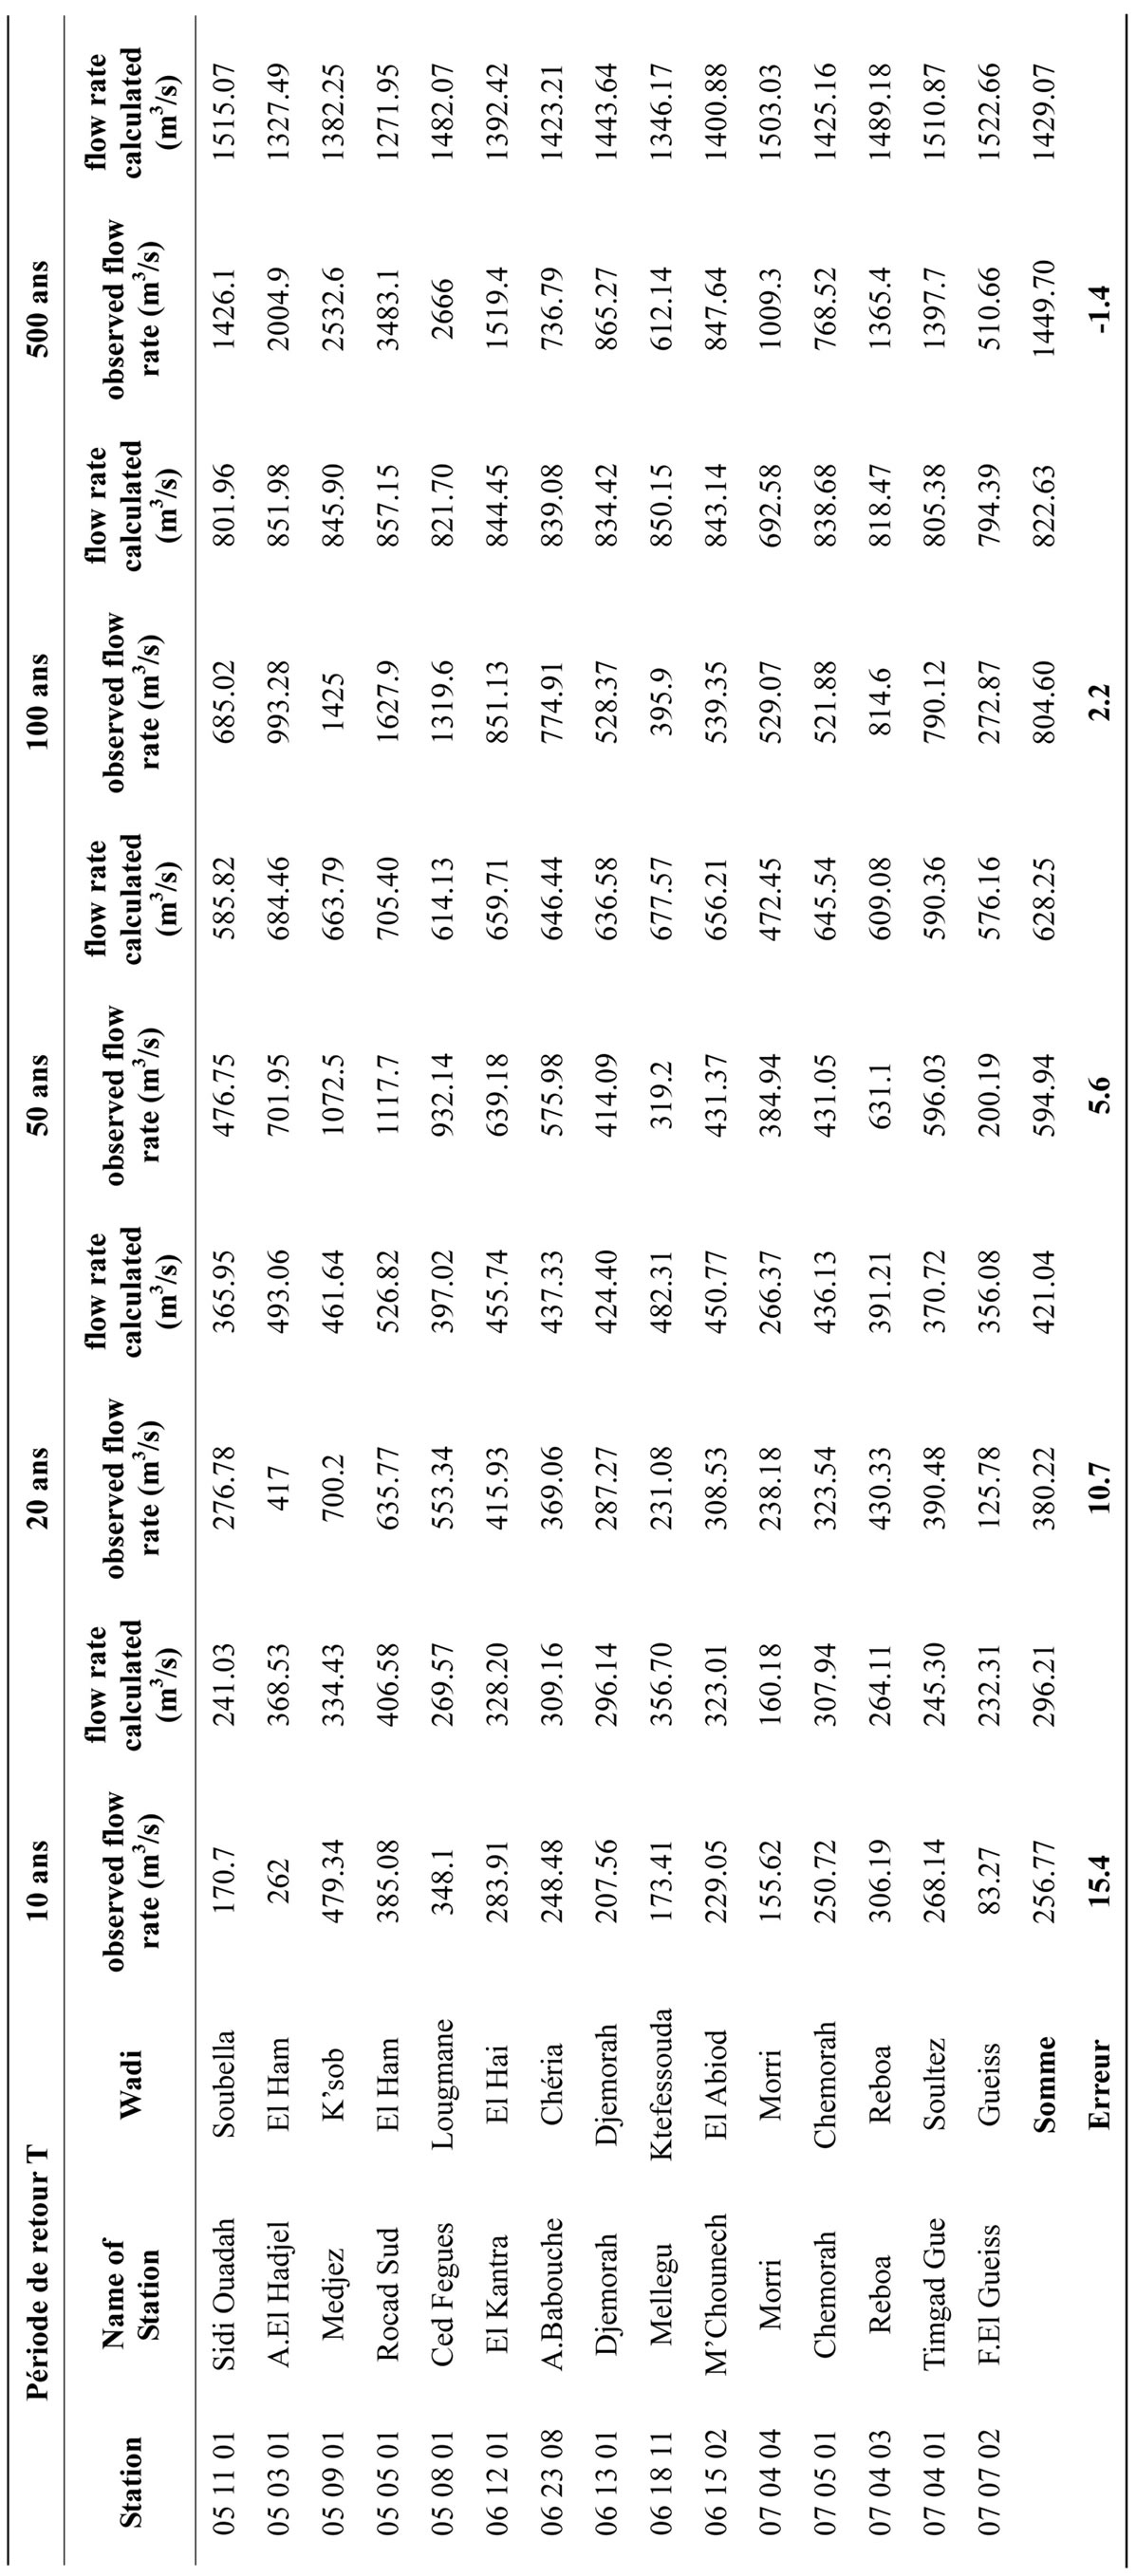
Table 4. Comparison between the calculated and modeled flood.
(from tens to thousands of m3/s) also characterizes the rivers of the arid and semi-arid regions of Algeria, hydrology, the difference in average 15% - 20% of a sample of flood discharge is admissible [14]. The relation established can be used to determine flood of ungauged wadis in arid and semi-arid Algeria.
4. Conclusion
The value of flood is indispensable as analysis and design of hydraulic structures are still often unknown in arid and semi-arid regions of Algeria and the lack of measurement data and/or lack of methodology for appropriately calculating these areas. The analysis of some parameters (average annual maximum flow rates specific ( ), the watershed area S and the coefficient of variation Cv) involved in the genesis of flooding streams is associated with some theoretical considerations (theoretical lognormal distribution law in general, all the space in the arid and semi-arid, allowed development of a calculation model of flood flow rates for ungauged streams in these areas). Operation requires only knowledge of the watershed area S. The value of the latter is determined by planimetry of the contour of the basin on a topographic map. The established method provided satisfactory results and considered reliable for hydrological study in the absence of measurement data.
REFERENCES
- D. Boutoutaou, F. Belagoune and H. Zeggane, “Flood Study Watersheds in Arid and Semi-Arid Regions of Algeria,” Annals of Science and Technology, University of Ouargla, Vol. 3, No. 1, 2011, pp. 46-53.
- S. Lahlah, “Introduction to the Study of Floods,” Hydrological Studies Day, ANRH, Algeria, 23-24 December 1997.
- D. Boutoutaou and A. Smati, “Method of Calculation of Flood Flows in Algeria Septentrional,” National Seminar On-Water Resources and Their Uses, Khemis Miliana, 6- 7 Mai 2006
- M. Niggli, D. Talamba, B. Hingray and A. Musy, “Estimation des Débits de Pointe Pour des Bassins Versants non Jaugés,” 2001.
- D. Boutoutaou and V. I. Vitaly, “Method of Calculating Average Maximum Storm Flow Rivers of the Mediterranean,” International Social Academy of Ecological Safety and Nature Management, No. 3, Moscou, 2008.
- P. Meylan, A. C. Favre and A. Musy, “Hydrology Frequency, a Predictive Science,” Press Poly and Univ Romandes, Italy, 2005, p. 173.
- R. B. Nelsen, “An Introduction to Copulas,” Lecture Notes in Statistics, Springer-Verlag, New York, 1999. http://dx.doi.org/10.1007/978-1-4757-3076-0
- A. Sklar, “Distribution Functions of n Dimensions and Margins,” Publications of the Institute of Statistics at the University of Paris, Paris, 1959, pp. 229-231.
- J. Béliveau, “Multivariate Analysis of Frequency Tip of the Volume and the Duration of Flood,” University Laval, 2006.
- P. Dubreuil, “Introduction to Hydrologic Analysis,” Masson-Cje, Paris, 1974, p. 216.
- D. Boutoutaou, “Mudflows and Disaster in Bab El Oued. National Seminar, Natural Disasters Linked to Climate,” INFR, Oran, 6-7 November 2007.
- A. Taibi, “Flood Frequency Study and Study-Sol in Algeria,” ANRH, Algeria, 1997.
- H. Benoit, P. Cecile and M. Andre, “Hydrology 2, An Engineering Science,” Press Poly and Univ Romandes, Italy, 2009, p. 601.
- P. Garachkov, “Hydrological Calculations,” Hydro-Météo, Leningrad, 1979, pp. 9-10.
NOTES
*Corresponding author.