Food and Nutrition Sciences
Vol. 3 No. 4 (2012) , Article ID: 18506 , 11 pages DOI:10.4236/fns.2012.34079
Physical Activity, Screen Time, and Prevalence of Overweight/Obesity among Adolescents in a Creative, Problem-Solving Program
![]()
1Department of Exercise and Sport Science, East Carolina University, Greenville, USA; 2Department of Exercise, Sport, and Leisure Studies, The University of Tennessee, Knoxville, USA; 3Department of Retail, Hospitality, and Tourism Management, The University of Tennessee, Knoxville, USA; 4Department of Animal Science, The University of Tennessee, Knoxville, USA; 5Department of Nutrition, The University of Tennessee, Knoxville, USA; 6Institute of Agriculture, AgResearch, The University of Tennessee, Knoxville, USA.
Email: costello@utk.edu
Received February 4th, 2012; revised March 9th, 2012; accepted March 18th, 2012
Keywords: health behaviors; physical activity; adolescent obesity
ABSTRACT
Certain dietary, physical activity, and sedentary behaviors have been studied extensively and consistently have been found to be associated with childhood overweight and obesity Productive sedentary-to-light activity pursuits may enhance the relationship among positive health behaviors. The purpose of this study was to identify the prevalence of overweight and obesity in a population of adolescents participating in a creative, problem-solving afterschool program and to identify the physical activity, sedentary, and dietary behaviors related to overweight and obesity in this group. This study describes health behaviors thought to be related to weight status for 1679 adolescents in grades 6 - 12 participating in a competitive, creative, team-oriented, problem-solving afterschool program. Self-reported dietary, physical activity, and sedentary behavior data were collected in this convenience sample based on the 2007 Youth Risk Behavior Survey. Measured height and weight data were collected to calculate BMI percentile. Using multinomial regression, models were constructed to predict the likelihood of being classified as overweight/obese. The prevalence of overweight in the study population was 15.6%, obese was 11.4%. Fruit/vegetable intake, milk consumption, moderate-to-vigorous physical activity, television time, and total screen time were all independently associated with weight status. After controlling for all covariates, male gender, minority racial/ethnic status, and high screen time while not meeting the physical activity recommendation significantly increased the likelihood of overweight/obesity. The participants in the current study are leaner and engage in healthier behaviors compared to national data for adolescents. The interactive variable combining both sedentary and PA measures is a relatively new technique used to provide a better understanding of the relationship between sedentary and physical activity behaviors as they relate to weight status. Even among healthy eating, physically active, low-risk adolescents, the interactive variable of physical activity and screen time strongly was associated with weight status.
1. Introduction
Childhood overweight and obesity has been identified as a national public health priority and described as an epidemic of this century [1,2]. According to the National Health and Nutrition Examination Survey (NHANES) using data from 2003-2006, 16.5% of adolescents, ages 12 - 19, are classified as overweight while17.6% of adolescents are obese [3]. There are numerous immediate physical [4,5] and psychosocial [2,6] consequences of childhood obesity ranging from metabolic disorders such as Type 2 diabetes and cardiovascular disease to psychological consequences such as low self-esteem and depression. Many of these negative consequences continue into adulthood. Adolescents who are overweight or obese are more likely to be overweight or obese as adults and are at an increased risk of mortality from all causes [7]. Thus, interventions in youth are likely to prevent obesity and its deleterious complications.
Certain dietary, physical activity, and sedentary behaviors have been studied extensively and consistently have been found to be associated with childhood overweight and obesity [1,2,6,8-19]. Common dietary behaviors associated with childhood obesity include consumption of fruits, vegetables, soda, and milk. Physical activity is another important determinant of weight status. According to the 2008 Physical Activity Guidelines produced by the US Department of Health and Human Services [20], the current physical activity recommendation for children and adolescents is 60 minutes of moderate-to-vigorous physical activity daily. The 2007 Youth Risk Behavior Surveillance System (YRBSS) defines “meeting the PA recommendation” as accumulating 60 minutes or more of moderate-to-vigorous PA five or more days/week. Sedentary behaviors, like television watching and computer/video game time also have been linked to overweight/obesity in adolescents [12,21]. Other sedentary pursuits, like homework, are actually positively associated with healthy weight status and obtaining sufficient levels of physical activity [22]. Productive sedentary pursuits (such as reading, doing homework, and computer use), part-time work, extra-curricular activities, and hobbies, not initially intended to increase physical activity, have been found to be associated with higher levels of physical activity and have been suggested as possible ways to treat adolescent overweight and obesity [1,18,22].
Thus, it is possible that other after-school activities, besides sport and other physical activities, impact weight status. Accordingly, it was hypothesized that participation in a creative afterschool program would positively impact WS and health behaviors. To test this hypothesis, we studied a convenience sample of children grades 6 - 12 participating in the Destination Imagination® (DI) program. DI is a creative, problem-solving program that requires team work in a competitive environment [23]. Teams of students participating in this program are given a multi-faceted problem to solve; they invest months of planning and research into solving the problem and also prepare a potential solution to be presented at the Global Finals.
The purposes of this paper were: 1) to identify the prevalence of overweight and obesity in a population of adolescents participating in a creative, problem-solving afterschool program, 2) to identify the physical activity (PA), sedentary, and dietary behaviors related to overweight and obesity in this population, and 3) to determine whether or not length of exposure to the program is related to weight status after controlling for dietary, PA, and sedentary behaviors.
2. Methods
2.1. Sample
This study is an analysis of cross-sectional data collected during the weeklong DI Global Finals in Knoxville, Tennessee. The DI Global Finals is a one-week event involving multiple problem-solving competitions among teams from across the world.
Eligible participants in this study were DI Global Finals participants (N = 6000) in grades 3 - 12 who lived in the US Parental consent was obtained from 2843 (47.4%) participants either before they arrived at the DI Finals or at a data collection site during the Global Finals event. For the current study, 2236 (78.6%) provided data resulting in an overall response rate of 37.3% for all DI Global Finals participants. This study focused on a subset of 1720 participants, grades 6 - 12. Participants below grade 6 (N = 516) were excluded because data collected were restricted to only demographic and height/weight measures.
2.2. Data Collected
Each participant completed a short survey and had their height and weight measured directly. Human subject approval was granted from the University of Tennessee Institutional Review Board.
The survey used in data collection included demographic questions as well as eight dietary, two sedentary behavior, and three PA questions taken directly from the 2007 Youth Risk Behavior Survey (YRBS) [24]. The YRBS was developed by the Center for Disease Control and Prevention (CDC) to monitor priority health-risk behaviors, including the prevalence of obesity, dietary, sedentary, and PA behaviors of US youth.
The demographic questions assessed age, gender, grade, and race/ethnicity. A question pertaining to years of participation in the DI program was included. The dietary questions captured information about fruit juice, fruit, green salad, potato, carrot, other vegetable, soda, and milk consumption. From these questions three dietary measures were coded: 1) met fruit and vegetable (FV) recommendation (five servings/day)—yes/no, 2) drank three or more glasses of milk/day—yes/no, and 3) drank one or more sodas/day—yes/no. The two YRBS sedentary behaviors questions captured time spent watching television and time playing video games and on the computer (unrelated to school work) on an average school day, and were coded into having watched three or more hours/day of television/day (yes/no) and three or more hours/day of video/computer time (yes/no). Three YRBS physical activity questions were coded on: 1) met the physical activity recommendation (60 or more minutes of physical activity five or more days/week)— yes/no, 2) played on one or more sports teams/year— yes/no, and 3) attended PE five days/week—yes/no.
Additional variables also were coded: combined screen time (ST) and an interactive PA/ST variable. To create the ST variable, the television and video/computer variables were combined and broken into the following three categories: 1) low ST (<1 hour/day), 2) moderate ST (1 - 3 hours/day), and 3) high ST (>3 hours/day). Interactive PA/ST combined the two PA recommendation categories (yes met/no did not meet) with the three ST categories (low, moderate, high) so that a new six-level measure was created: 1) Yes PA rec/Low ST; 2) Yes PA rec/Mod ST; 3) Yes PA rec/High ST; 4) No PA rec/Low ST; 5) No PA rec/Mod ST; and 6) No PA rec/High ST.
BMI was calculated from weight measured using Seca S-882 strain gauge digital scales and height measured using Seca S-214 Road Rod freestanding stadiometers. BMI percentile and BMI WS categories (normal is ≥5 and <85 percentile, overweight is ≥85 percentile, and obese is ≥95 percentile) were calculated and classified according to the CDC Growth Chart Training instructions [25].
Research team members were trained during a two-day training session outlining correct CDC measurement [26] and survey administration protocols, data site logistics, and other issues, such as confidentiality.
2.3. Statistical Analysis
Chi-square statistics, using SPSS 16.0 statistical software (SPSS Inc., Chicago, IL), were used to report prevalence rates of overweight and obesity by demographic and health behavior measures. Multinomial regression, using SAS statistical software (SAS Institute Inc., Cary, NC), was used to test three different models using select demographic and behavioral factors to predict the likelihood of being classified as overweight and/or obese compared to normal weight status. Model one focused on determining odds risk ratios for all main effects of demographic, behavioral, and years of participation in the afterschool program. Model two examined the effects of combined ST with demographic, select behavioral, and years of participation in the afterschool program. Model three examined the interactive effect of PA and ST behaviors.
3. Results
The distribution of participants according to demographics and years of participation in the program is shown in Table 1. Of the 1,679 participants, most were Non-Hispanic White (82.4%) and in middle school and female. The distribution of participants relative to their participation in the program was fairly even, with 22.8% of the participants reporting 5 or more years of participation.
Table 2 presents select demographics by weight status
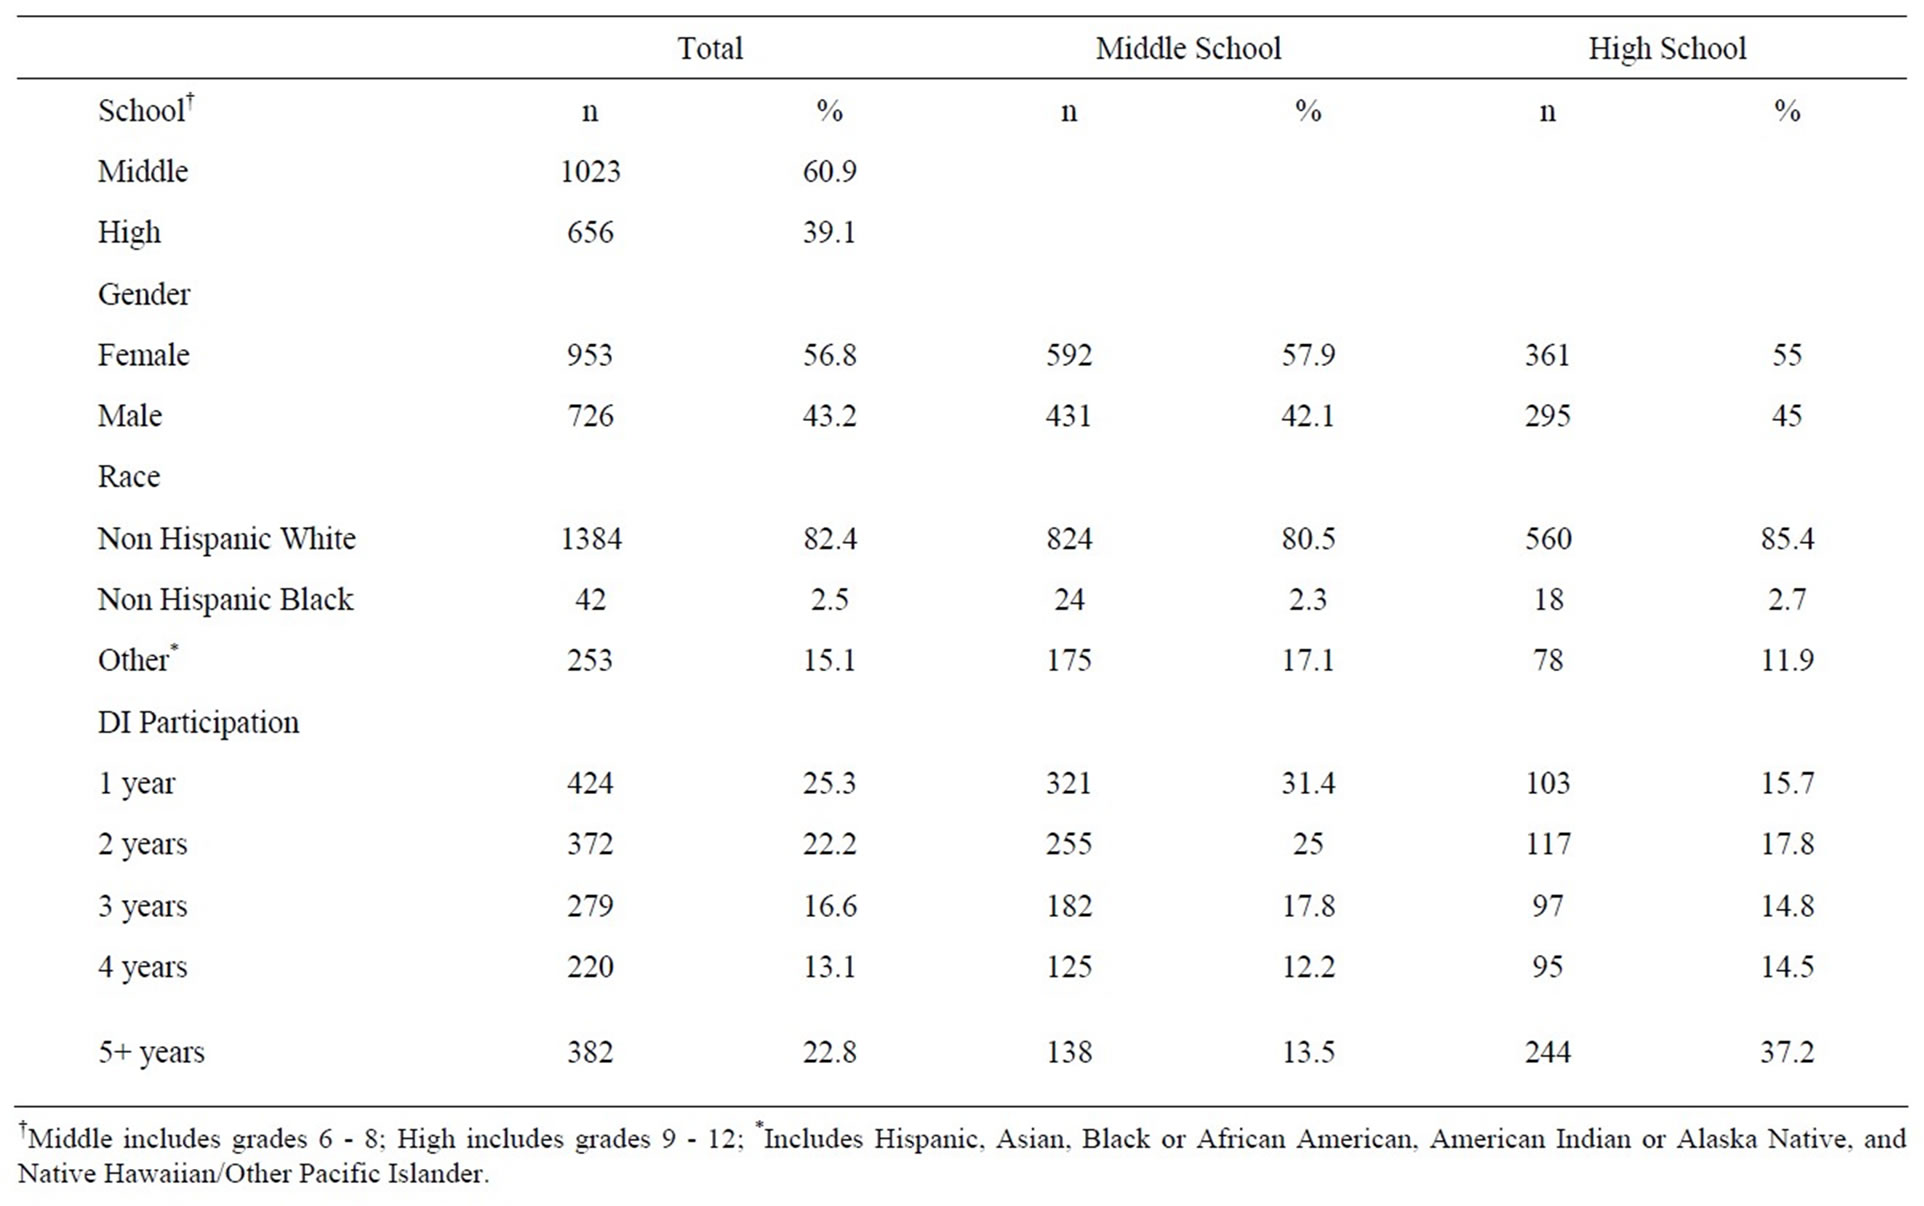
Table 1. Participant demographics (N = 1679).
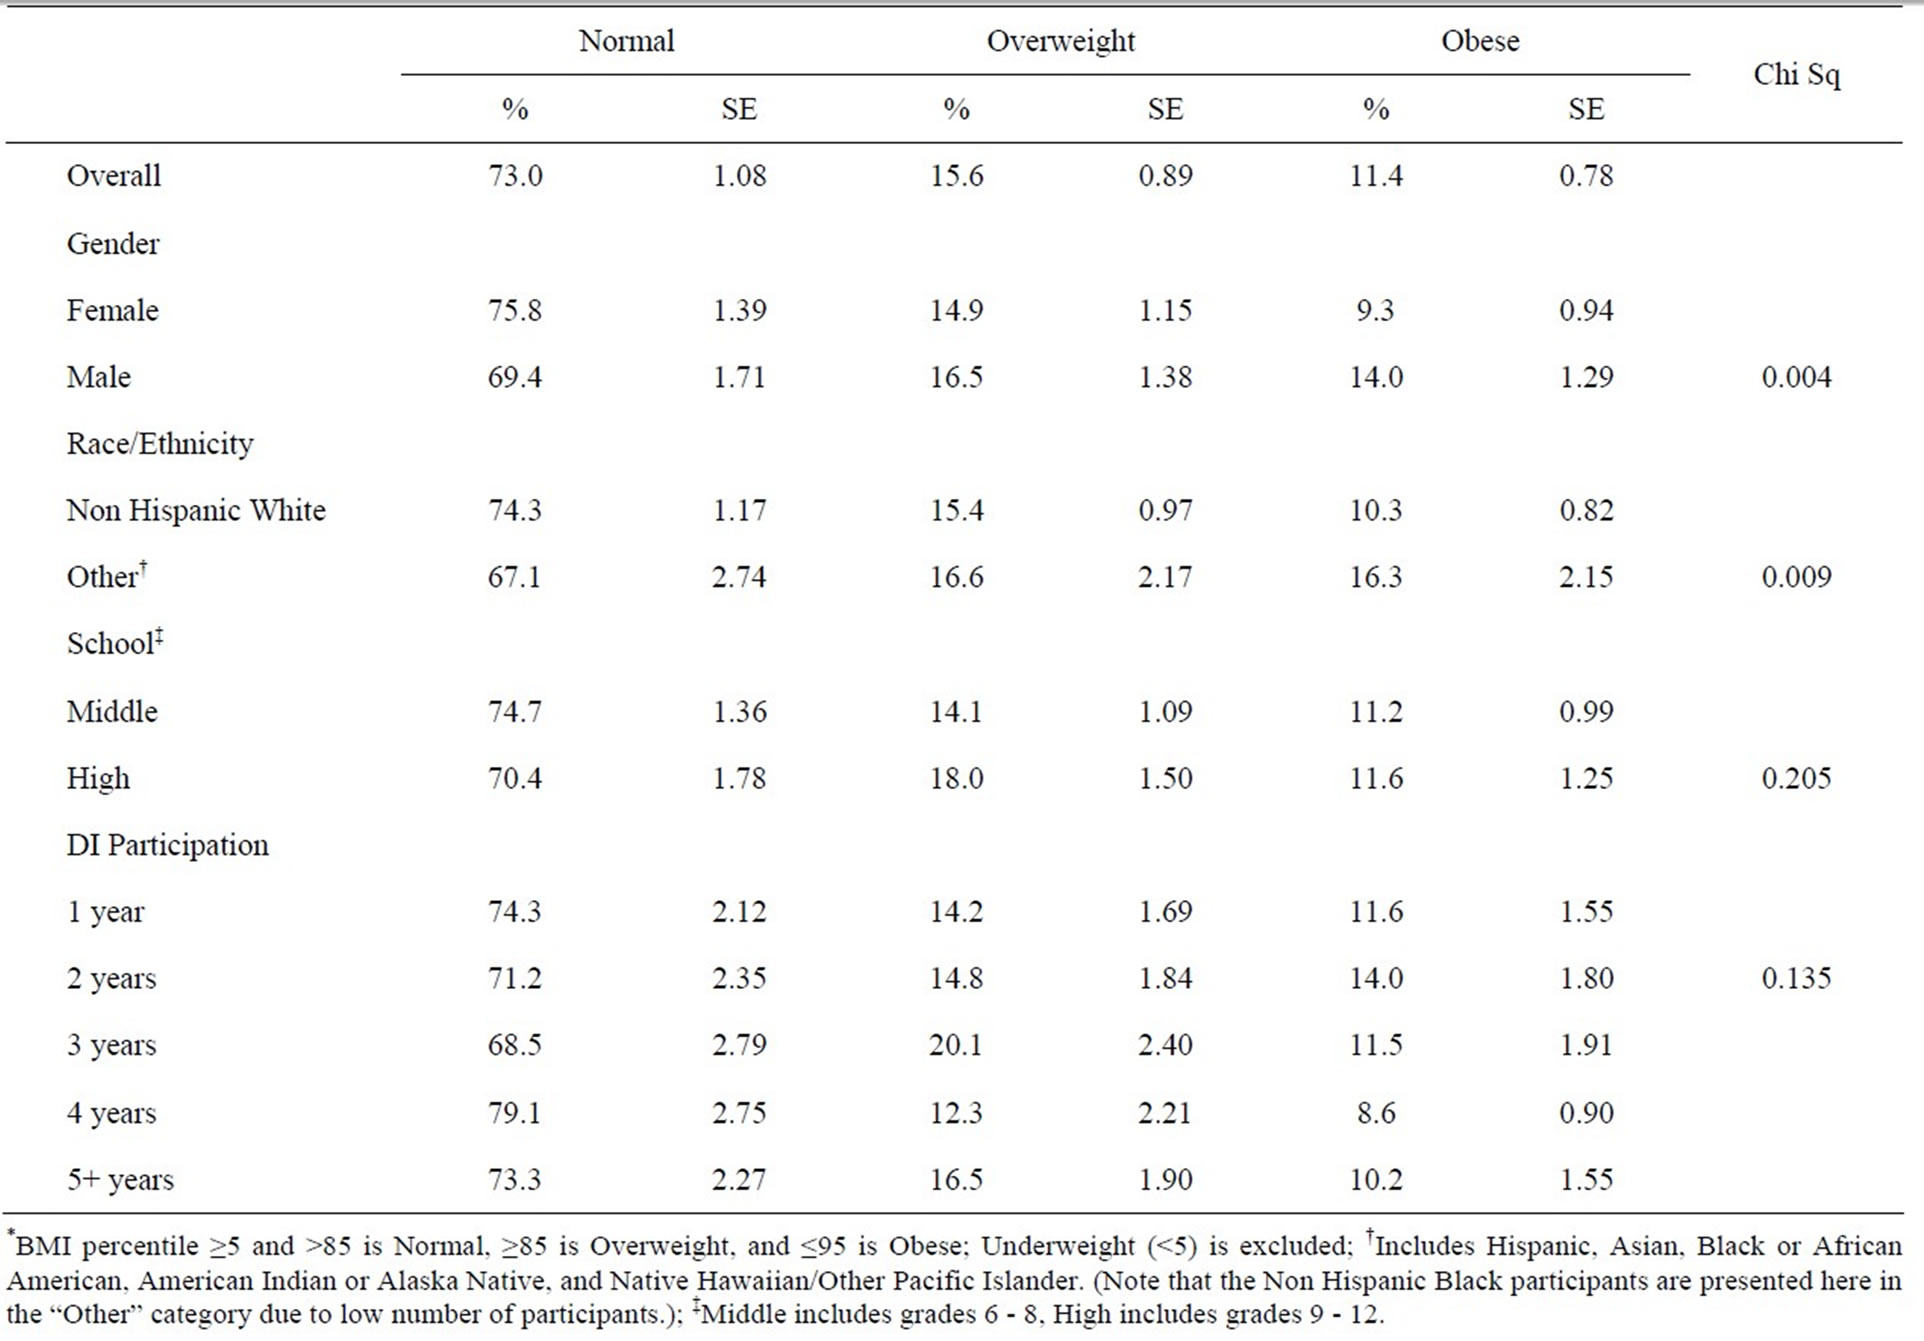
Table 2. BMI weight status of participants by demographic characteristics (N = 1679)*.
categories, illustrating the distribution of normal weight, overweight, and obese participants. Overall, the percent age of participants in the study with a BMI percentile ≥85 was 15.6% (overweight); the percentage with a BMI percentile ≥95 was 11.4% (obese). More females than males were classified as normal weight, while fewer females were classified as overweight or obese (x2 = 11.0; p = 0.004). Related to race, a higher proportion of minorities were overweight or obese (x2 = 9.5; p = 0.009). There were no statistically significant differences between WS status distribution for middle school (MS) and high school (HS) or years of DI participation.
Overall, a low percentage of participants met the fruit and vegetable recommendation (32.0%), as found in Table 3. The participants were active, with 63% of middle school students and 47.6% of high school students meeting the PA recommendation and almost 74% of high school and 85.8% of middle school students reporting participating in at least one sport. Overall only 19.6% (16.8% middle school and 23.8% high school) accumulated more than three hours of ST (classified as high ST) on an average school day.
Table 4 presents weight status by dietary, PA, and sedentary behaviors. Of the dietary behaviors associated with WS, milk consumption (x2 = 6.4; p = 0.041) and FV intake (x2 = 7.4; p = 0.024) were found to be statistically significant. Adolescents who met the fruit and vegetable recommendation were much more likely to be in the normal weight category. Also, adolescents who drank three or more glasses of milk/day were less likely to be in the obese category. Related to overweight and obesity, there were no statistically significant differences between the adolescents consuming one or more sodas/day and those not consuming one or more sodas/day. Adolescents meeting the PA recommendation (60+ minutes of PA five or more days/week) (x2 = 15.1; p = 0.001) and playing on a least one sports team (x2 = 6.6; p = 0.037) were more likely to be classified as normal weight and less likely to be obese. Video/computer game time (x2 = 3.7; p = 0.160) was not independently associated with WS; however, adolescents who watched three or more hours/day of television were more likely to be overweight or obese (x2 = 10.3; p = 0.006). Also, adolescents accumulating low ST (less than one hour/day) were much less likely to be overweight or obese compared to adolescents accumulating high ST (three or more hours/
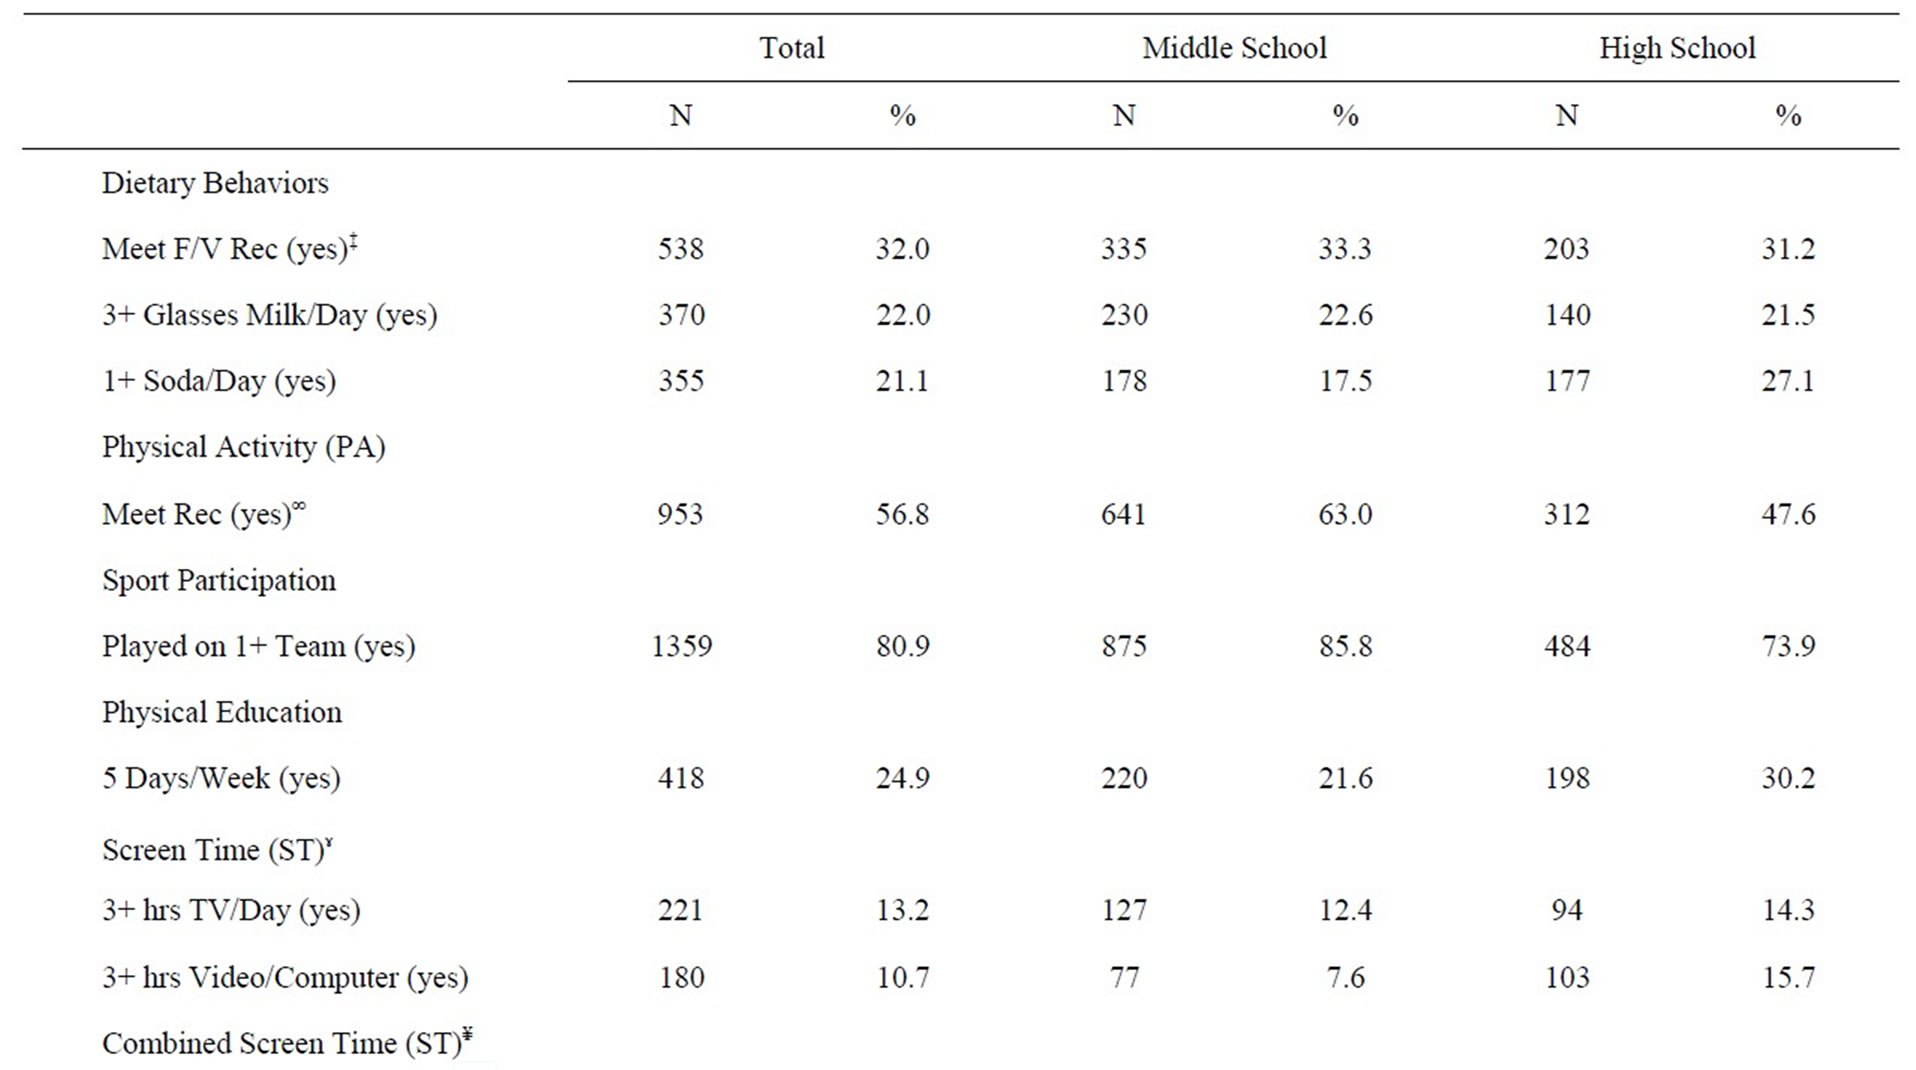
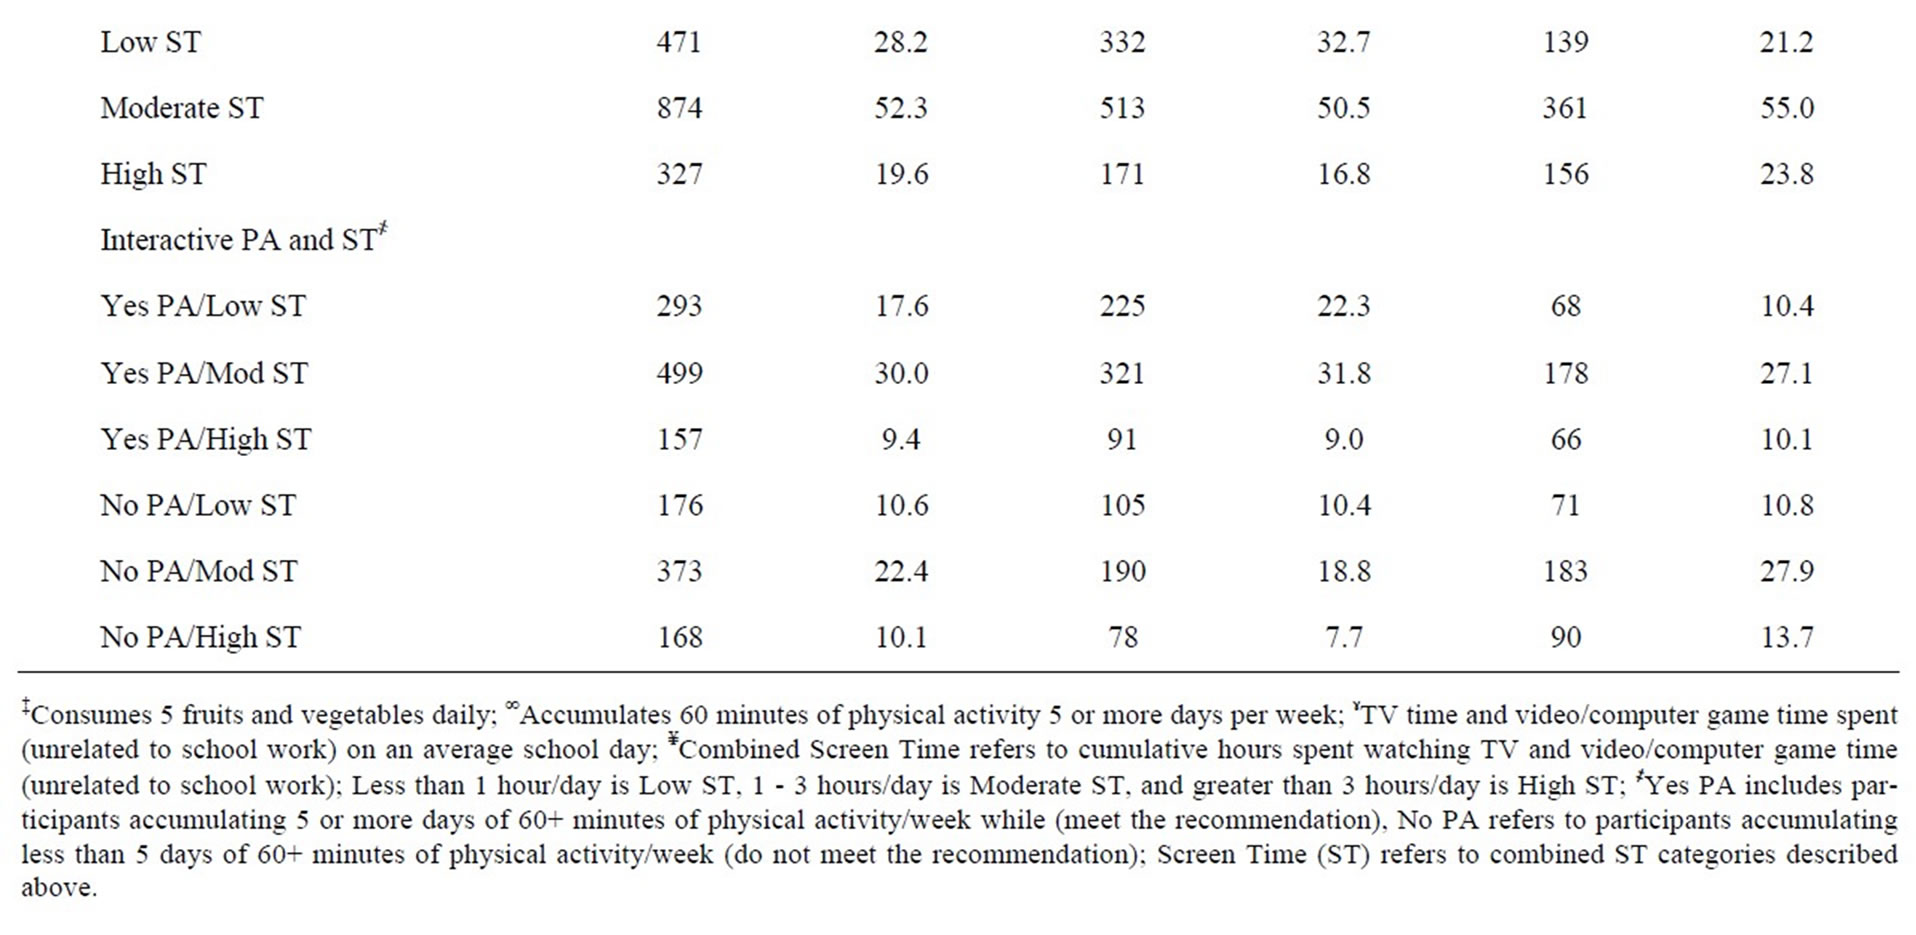
Table 3. Dietary, physical activity, and sedentary behaviors of participants (N = 1679).
day) (x2 = 14.2; p = 0.007). When focusing on the interactive PA/ST measure, in the lowest risk group (Yes PA/Low ST), only 21.8% were classified as overweight or obese, while 40.4% of the adolescents in the highest risk group (No PA/High ST) were overweight and obese (x2 = 37.4; p = 0.000).
Using multinomial regression analysis, three different models were constructed to test which demographics, dietary behaviors, PA, and sedentary behaviors were associated with increased likelihood of being classified as overweight/obese (see Table 5). Model I consists of main effect variables. Model II builds upon the previous model by adding combined ST. Model III advances the model by including the interactive measure of PA with ST. Across all three models, males compared to females were significantly more likely (38% - 43%) to be overweight/obese. Other race/ethnic adolescents, compared to Non-Hispanic White adolescents, were significantly more
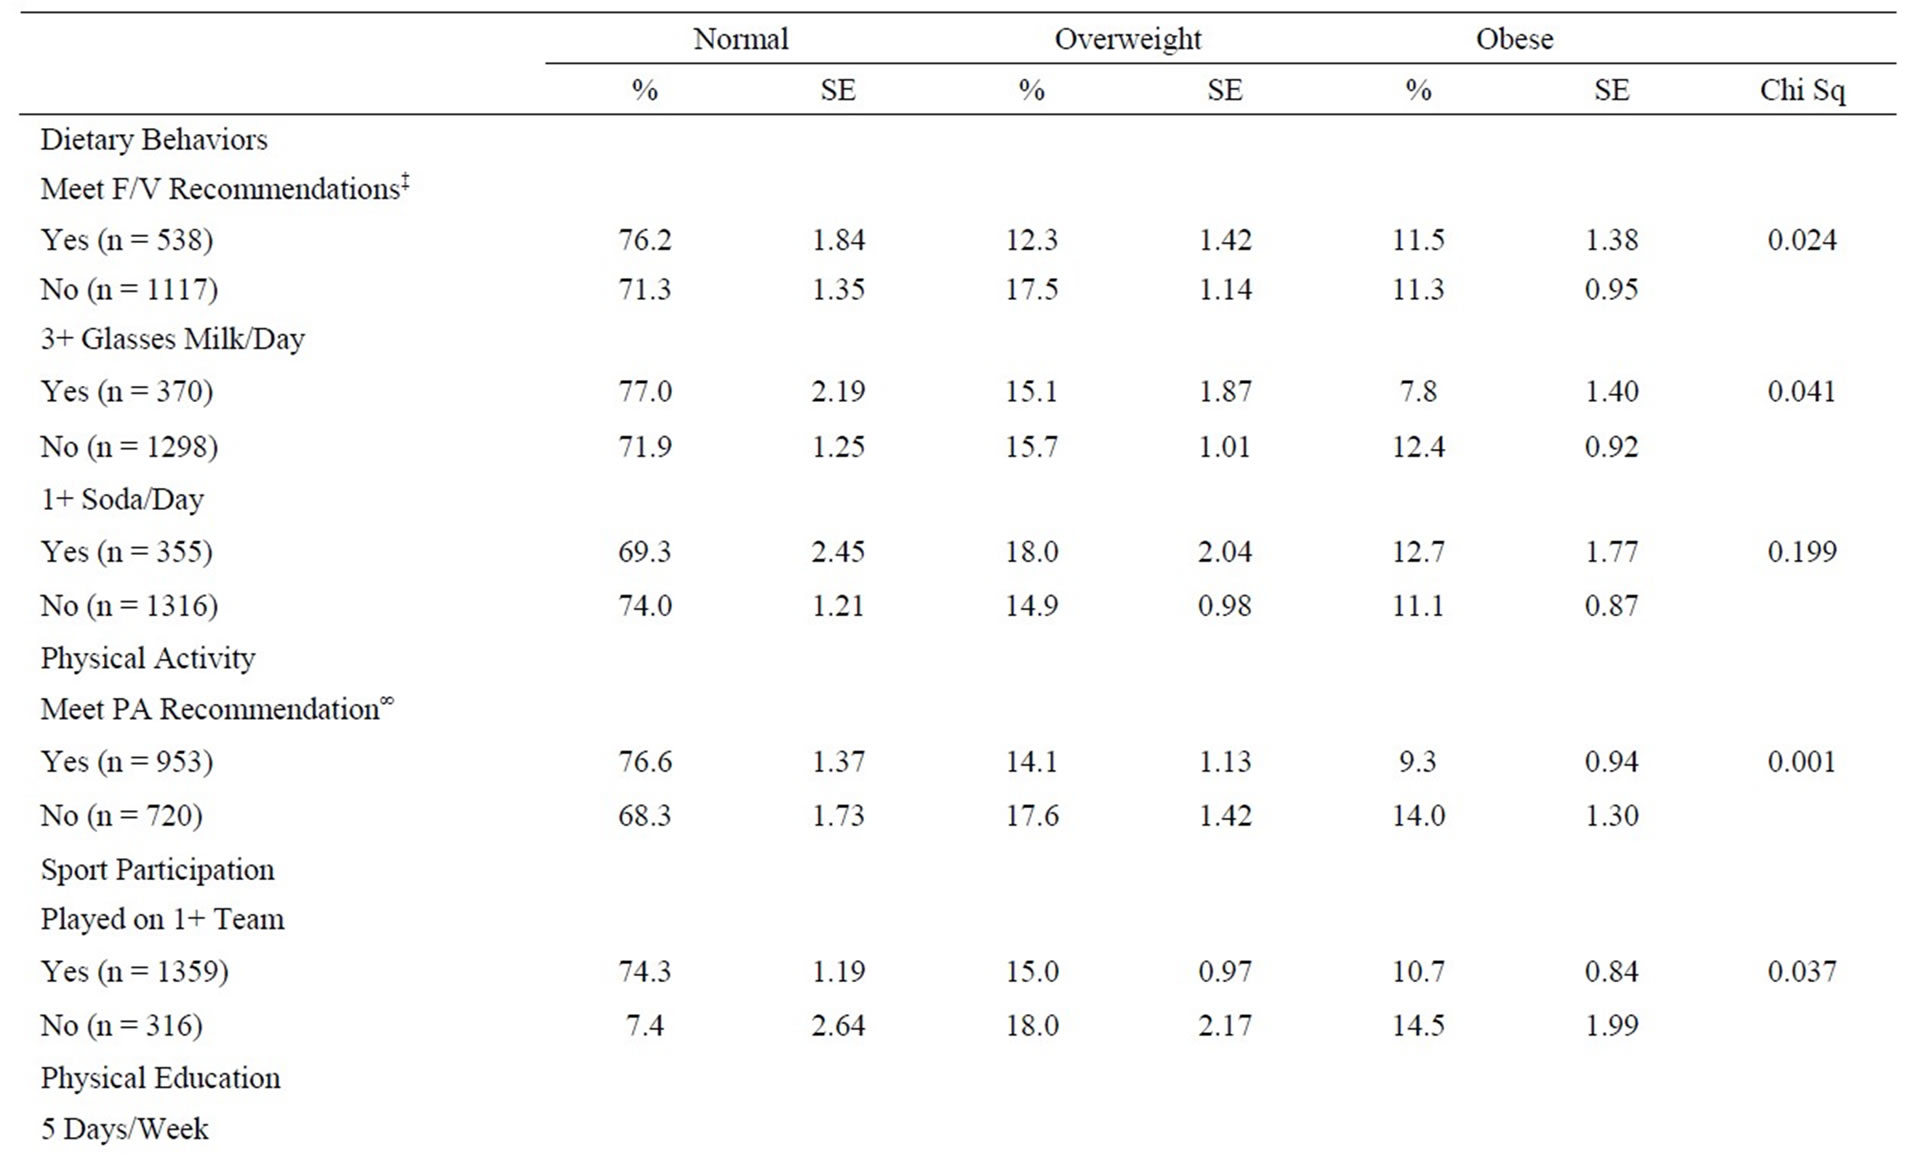
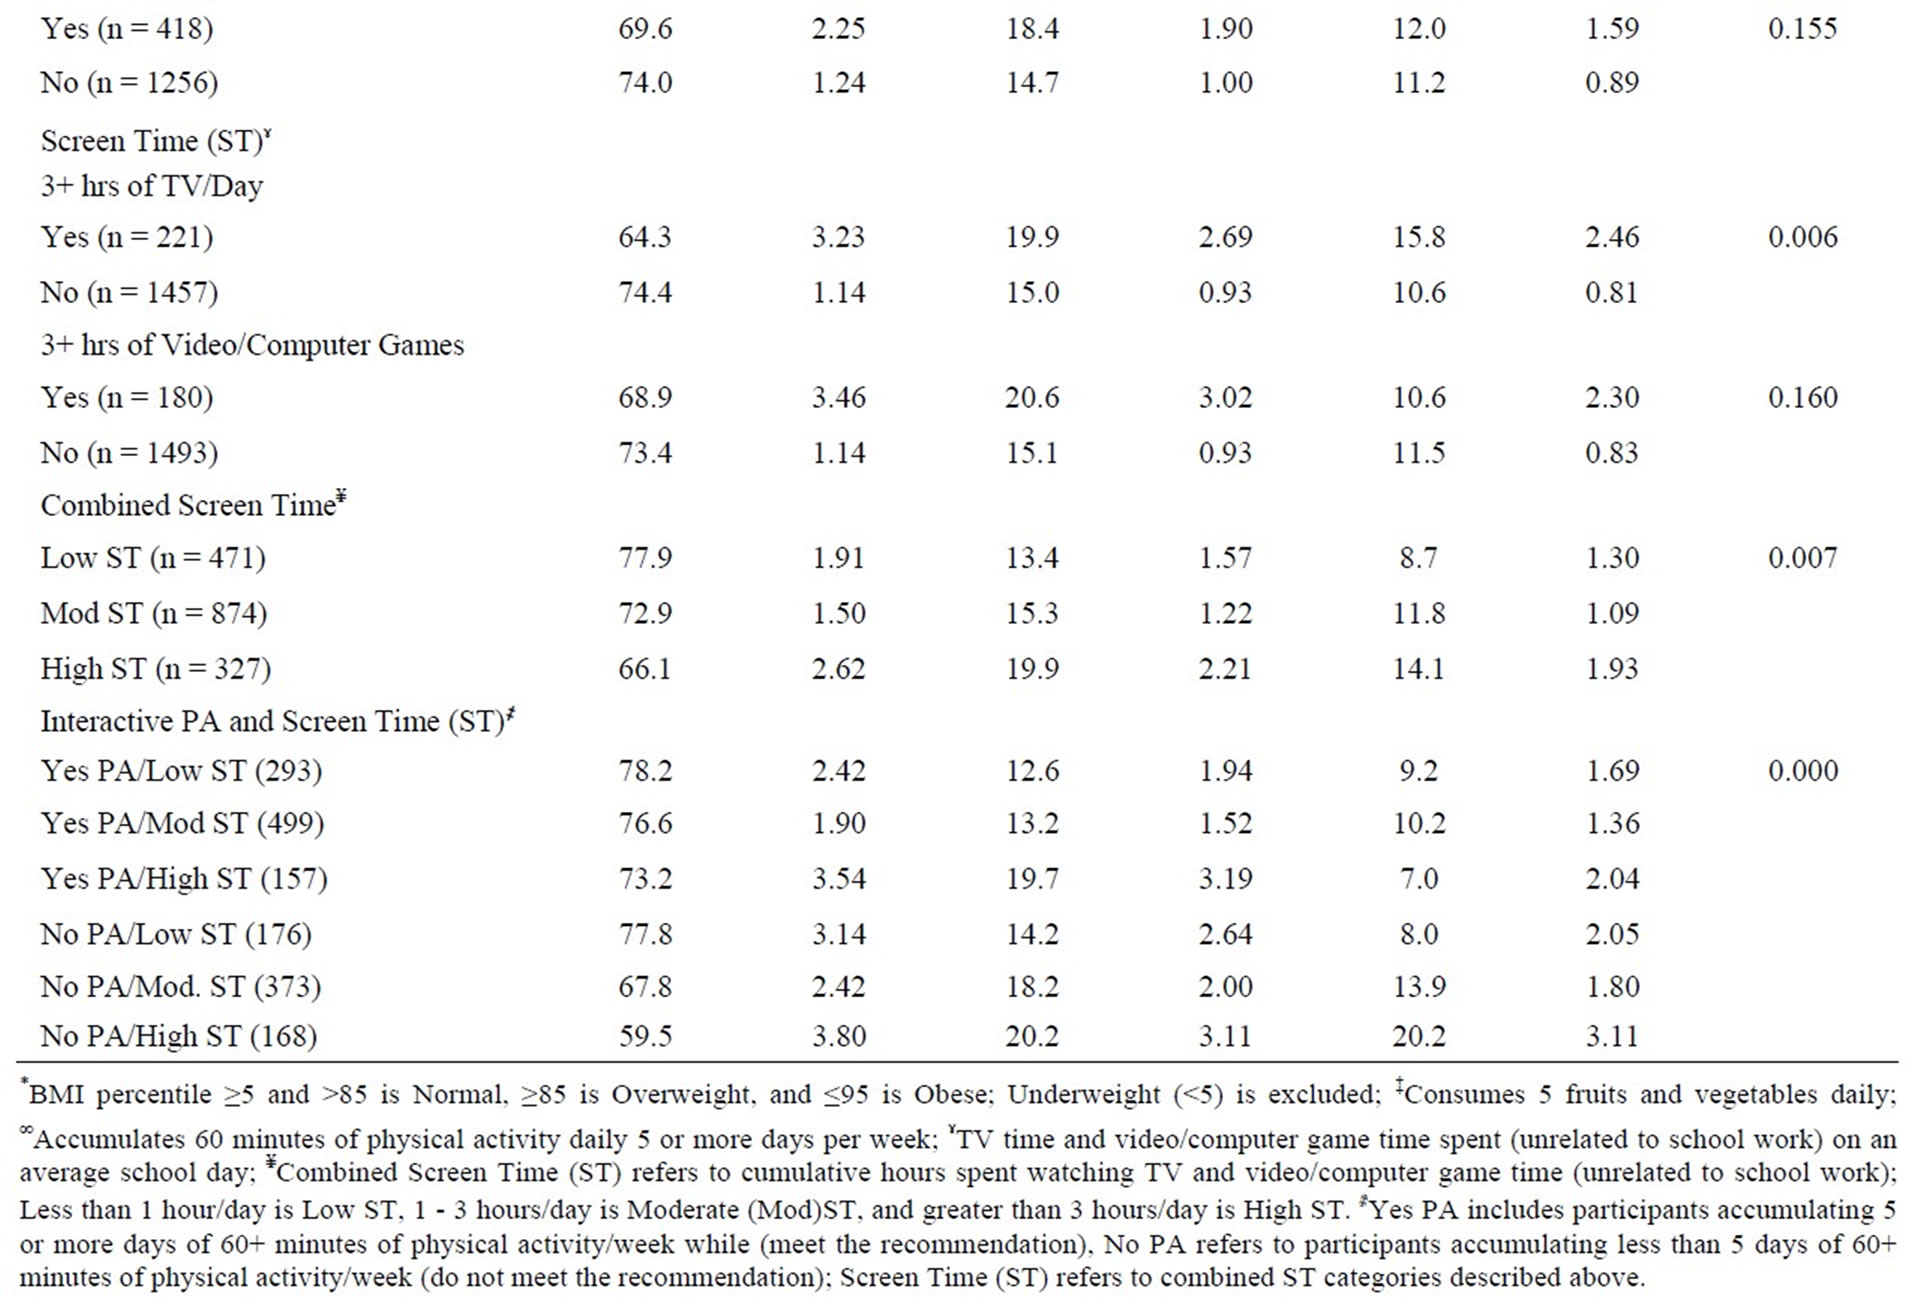
Table 4. BMI weight status categories by select dietary, physical activity, and sedentary behaviors (N = 1679)*.
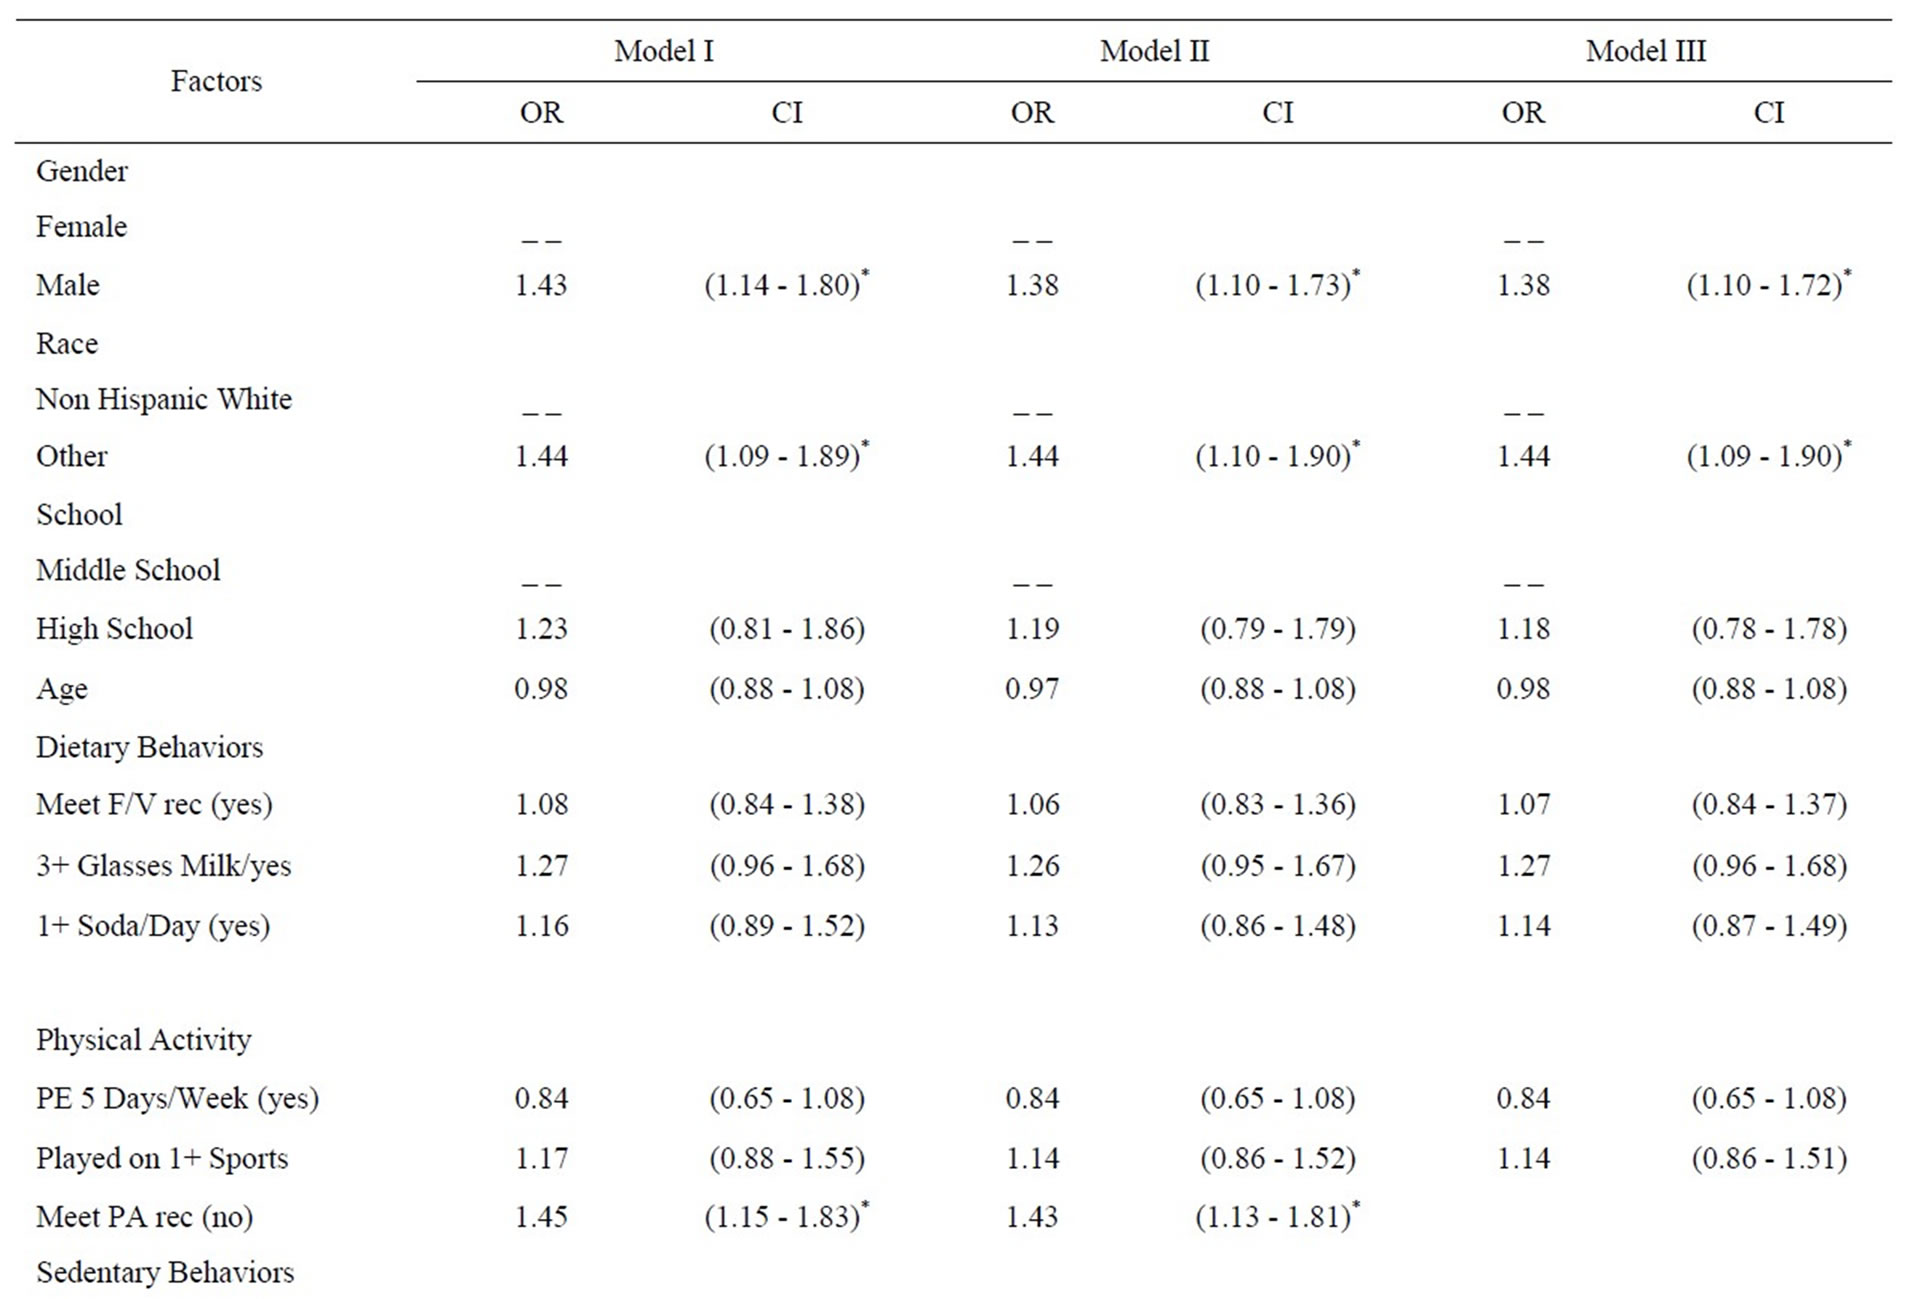
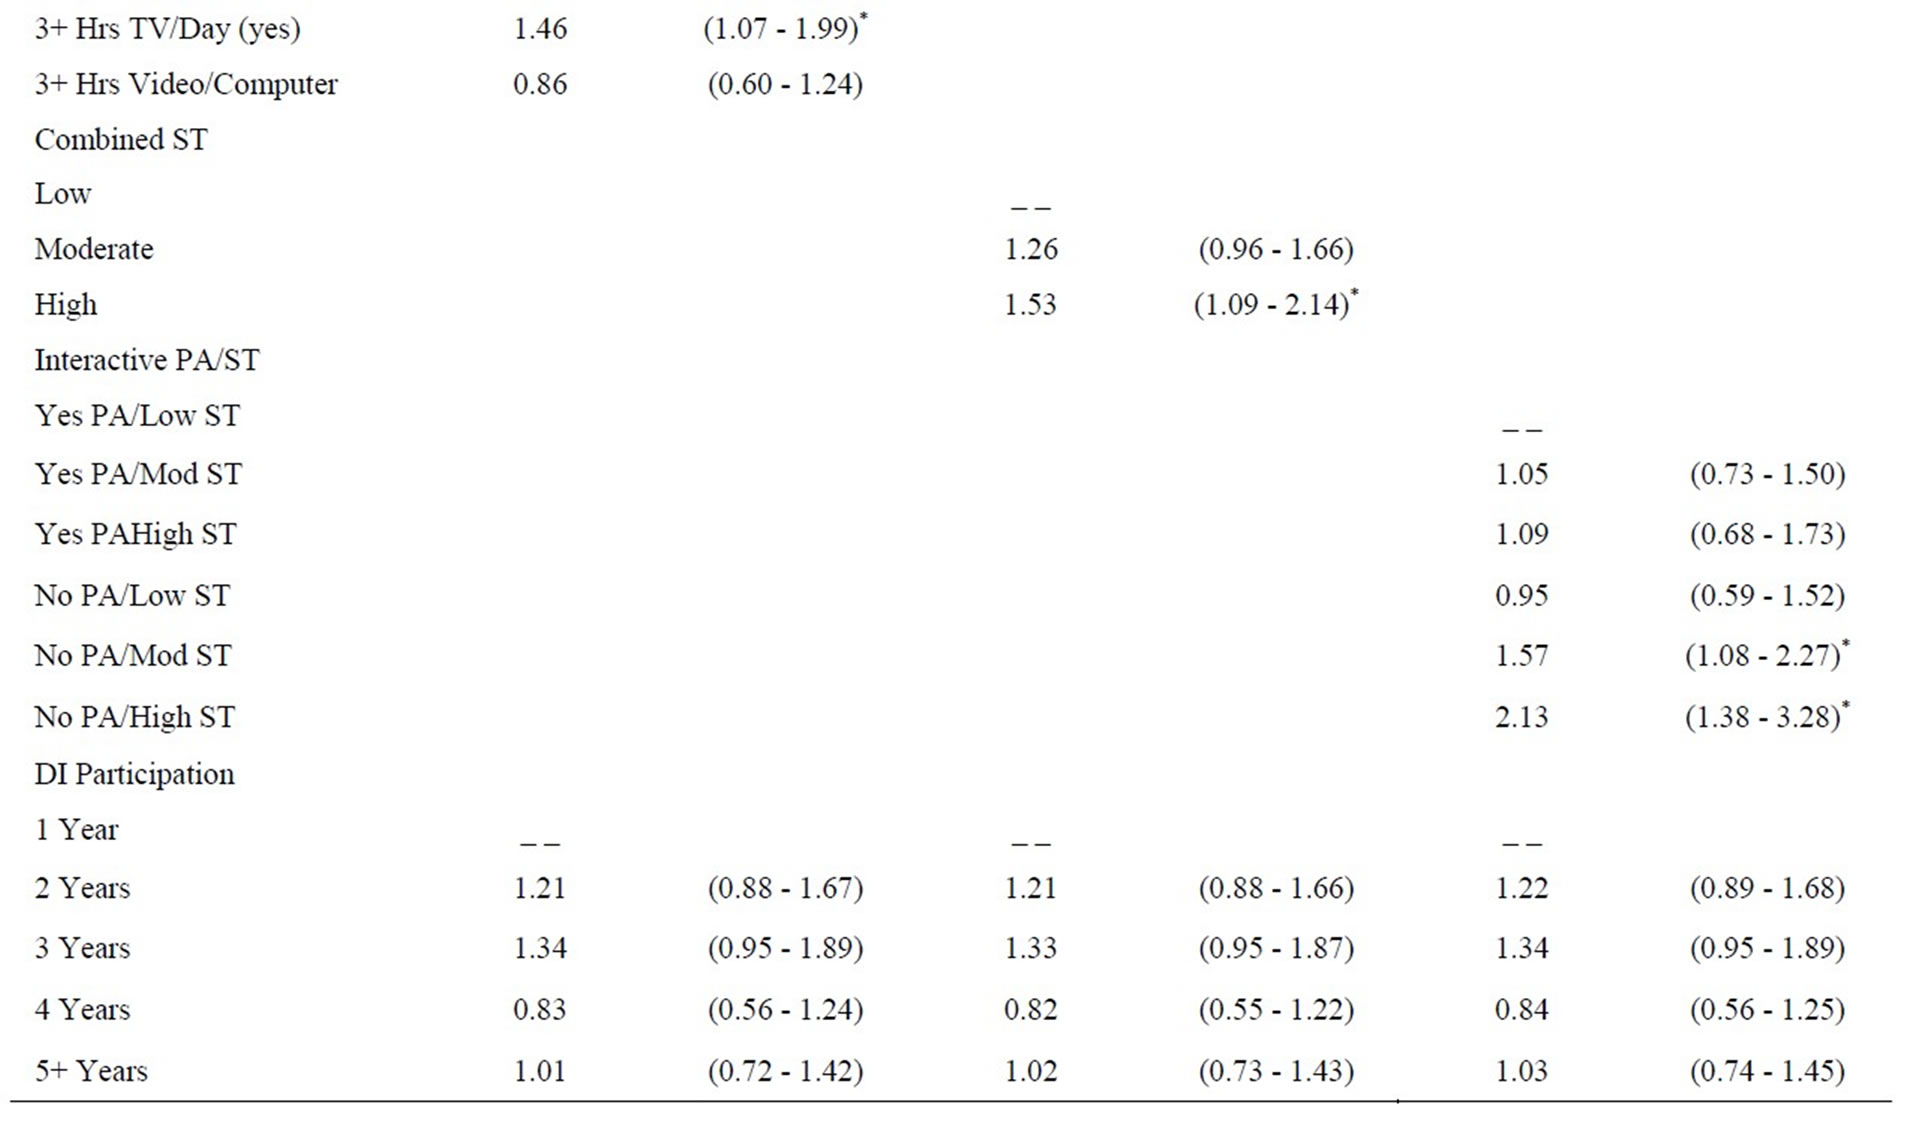
Table 5. Multinomial regression models using select demographic and behavioral characteristics to estimate risk of overweight/obesity (N = 1626).
likely (44%) to be overweight/obese across all three models.
Specific to model I, adolescents who did not meet the PA recommendation (OR = 1.45; 95% CI = 1.15 - 1.83) and who watched more than three hours of television/day (OR = 1.46, 95% CI = 1.07 - 1.99) were likely to be classified as being overweight/obese. Similarly in model II, adolescents not meeting the PA recommendation (OR = 1.43; 95% CI = 1.13 - 1.81) and accumulating high ST (OR = 1.53; 95% CI = 1.09 - 2.14) were more likely to be classified as overweight/obese. Model III, which tested associations with the interaction between PA and ST, found an increased likelihood of overweight/obesity among adolescents who did not meet the PA recommendation and accumulated moderate ST (OR = 1.57, 95% CI = 1.08 - 2.27) or high ST (OR = 2.13; 95% CI = 1.38 - 3.28). Length of participation in the program was not significantly associated with WS in any of the models.
4. Discussion
This study examined the association of diet, physical activity, and sedentary behaviors with overweight/obesity among middle and high school students from across the US, who participated in a competitive, creative, problem-solving, afterschool program. Overall, the participants in the current study are leaner and engage in healthier behaviors compared to reported national dietary, sedentary, and PA data for high school adolescents [10]. A lower proportion of the participants in the current study are overweight and obese compared to national data for high school and middle school (27.0% vs. 34.1% overweight and obese) [3]. This noticeably lower percentage of overweight and obesity for participants in the program compared to reported NHANES data was also found for females (23.9% vs. 33.3%), males(30.5% vs. 34.9%), and Non-Hispanic White adolescents (25.7 % vs. 33.1%) [3].
Related to dietary measures, it appears that fruit and vegetable, milk, and soda consumption, after controlling for all other factors measured in this study, were not associated with weight status. However, meeting the fruit and vegetable recommendation and drinking three or more glasses of milk/day was found to be independently associated with weight status (see Table 4). These results are consistent with other studies that report a negative relationship between fruit and vegetable intake and overweight/obesity [10,12,16]. Several studies have shown an association between increased soda consumption and increased BMI [15,17], while another study did not report a significant relationship between soda consumption and BMI [19] Overall, the high school students in this sample, when compared to the high school YRBS estimates [8], ate more fruit and vegetables and drank more milk and less soda than national statistics.
Accumulating 60 or more minutes of moderate-tovigorous PA five or more days/week (meeting the PA recommendation) was both independently associated with weight status and remained significant after controlling for all covariates in the regression models, which suggests that meeting the PA recommendation is an important factor related to weight status. Although sports participation was significantly and independently associated with weight status, it was not significant in the regression models. One explanation is that when the adolescents reported the number of days they participate in 60 or more minutes of moderate-to-vigorous PA, they included time spent in sports participation. If so, it is not surprising that the response to this one sports participation question was not significantly associated with weight status in the regression models that included the variable measuring overall PA daily. In the current study we found a high level (80.9%) of sports participation, suggesting involvement in multiple extracurricular activities. Such involvement indicates social support for these adolescents, which may indirectly influence a variety of health behaviors including weight status, as discussed previously [27,28].
Overall, high school participants in the current study spent far less time engaging in sedentary behaviors, like television watching and video game/computer time (unrelated to school work), compared to national estimates from the high school YRBS [8]. Watching three or more hours of television per day was independently associated with weight status and was found to be significant in model I, while video/computer time was not. This supports the current literature that suggests television time may be more closely associated to overweight/obesity among adolescents [12,22,29] than video/computer time [21]. A potential underlying reason may include the increased caloric intake while watching television rather than television time alone [29].
Combined ST was found to be independently associated with weight status and was significant in regression model II. Perhaps this significance is driven by television time and less dependent on video/computer game time (the later was not significant in Tables 4 and 5). However, other studies report a positive relationship between increased ST (i.e. time spent watching television, playing video games, and/or using the computer) and increasing BMI [12,21,30], which is consistent with these current findings.
It has been suggested that PA and sedentary are not mutually exclusive and that examining the interaction between these behaviors might provide better insights and perhaps be a better predictor of weight status [31,32]. Regression models I and II found strong independent relationships between PA and weight status as well as ST and weight status. Model III found a strong independent relationship between the PA/ST interaction with weight status. There was a much higher prevalence of overweight and obesity among the highest risk group (No PA/High ST) when compared to the lowest risk group (Yes PA/Low ST) (40.4% vs. 21.8%). Even after controlling for other risk factors in regression model III, there was a significant difference in the likelihood of overweight and obesity among the interactive variable categories, specifically the lowest versus the highest risk groups. These results are consistent with a similar study among high school students [32].
Several interesting implications arise from this data. The results support the notion that some adolescents spend a substantial amount of time engaging in sedentary pursuits while still making time to engage in substantial amounts of PA, meaning it would be inaccurate to assume high sedentary adolescents exhibit low PA [22,32]. Secondly, the findings may provide insight into better designed intervention studies aimed at preventing/treating childhood obesity. Such interventions might target increasing PA levels (to at least meet the PA recommendation), reducing ST to less than one hour/day, or both. For example, if the target group has no desire to increase their PA levels, perhaps they might be willing to reduce their ST. And importantly, the results indicate that PA may protect against overweight and obesity as ST increases. Also, if an adolescent is not physically active, accumulating very low ST might promote a healthy weight status.
This study suggests that participation in a creative, problem-solving, afterschool program, regardless of length of enrollment, does not appear to have an independent association with weight status, either independently or after controlling for all other covariates. However, without a control group and experimental groups measured at entry into DI at the local level, we are not able to classify DI as one of the “productive sedentary pursuits” that have been found to be associated with positive health behaviors.
This group of participants was unique, and it would be difficult to get access to another sample like this. It is recognized that this sample is not very diverse but it would be challenging to collect data for such a large sample size of adolescents from across the US participating in a productive pursuit like DI, not initially intended to increase moderate-to-vigorous PA. The height/ weight data used to calculate BMI were measured data, not self-reported. The interactive variable combining both sedentary and PA measures is a relatively new technique used to provide a better understanding of the relationship between sedentary and PA behaviors as they relate to weight status. Even among healthy eating, physically active, low-risk adolescents, the interactive PA/ ST variable was strongly associated with weight status.
5. Conclusion
In conclusion, the participants in this study had a lower prevalence of overweight/obesity and, in general, engaged in more positive health behaviors compared to national data. Even among these low-risk adolescents, the interaction between PA and ST, presented as an interactive measure, was strongly associated with weight status. The interaction between PA and ST can be used to identify different groups of adolescents and their risk of being classified as overweight and obese. DI exposure, as measured in the current study, does not appear to enhance the relationship of health behaviors related to overweight and obesity and weight status.
6. Acknowledgements
This project was supported by the National Research Initiative Grant #55215-18799 from the USDA National Institute of Food and Agriculture.
REFERENCES
- P. Nowicka and C. E. Flodmark, “Physical Activity-Key Issues in Treatment of Childhood Obesity,” Acta Paediatrica Supplement, Vol. 96, No. 454, 2007, pp. 39-45. doi:10.1111/j.1651-2227.2007.00169.x
- J. P. Koplan, C. T. Liverman and V. I. Kraak, “Preventing Childhood Obesity: Health in the Balance: Executive Summary,” Journal of the American Dietetic Association, Vol. 105, No. 1, 2005, pp. 131-138. doi:10.1016/j.jada.2004.11.023
- C. L. Ogden, M. D. Carroll and K. M. Flegal, “High Body Mass Index for Age among US Children and Adolescents, 2003-2006,” Journal of the American Medical Association, Vol. 299, No. 20, 2008, pp. 2401-2405. doi:10.1001/jama.299.20.2401
- D. S. Freedman, W. H. Dietz, S. R. Srinivasan and G. S. Berenson, “The Relation of Overweight to Cardiovascular Risk Factors among Children and Adolescents: The Bogalusa Heart Study,” Pediatrics, Vol. 103, No. 6, 1999, pp. 1175-1182.
- W. H. Dietz, “Health Consequences of Obesity in Youth: Childhood Predictors of Adult Disease,” Pediatrics, Vol. 101, No. 3, 1998, pp. 518-525.
- M. B. Schwartz and R. Puhl, “Childhood Obesity: A Societal Problem to Solve,” Obesity Research, Vol. 4, No. 1, 2003, pp. 57-71. doi:10.1046/j.1467-789X.2003.00093.x
- A. Must, P. F. Jacques, G. E. Dallal, C. J. Bajema and W. H. Dietz, “Long-Term Morbidity and Mortality of Overweight Adolescents. A Follow-Up of the Harvard Growth Study of 1922 to 1935,” The New England Journal of Medicine, Vol. 327, No. 19, 1992, pp. 1350-1355. doi:10.1056/NEJM199211053271904
- D. K. Eaton, L. Kann, S. Kinchen, S. Shanklin, J. Ross, J. Hawkins, W. A. Harris, R. Lowry, T. McManus, D. Chyen, C. Lim, N. D. Brener and H. Wechsler, “Youth Risk Behavior Surveillance—United States, 2007,” Morbidity and Mortality Weekly Report, Vol. 57, No. 12, 2008, pp. 1-27.
- J. C. Eisenmann, G. J. Welk, M. Ihmels and J. Dollman, “Fatness, Fitness, and Cardiovascular Disease Risk Factors in Children and Adolescents,” Medicine & Science in Sports & Exercise, Vol. 39, No. 8, 2007, pp. 1251-1256. doi:10.1249/MSS.0b013e318064c8b0
- I. Janssen, P. T. Katzmarzyk, W. F. Boyce, M. A. King and W. Pickett, “Overweight and Obesity in Canadian Adolescents and Their Associations with Dietary Habits and Physical Activity Patterns,” Journal of Adolescent Health, Vol. 35, No. 5, 2004, pp. 360-367. doi:10.1016/j.jadohealth.2003.11.095
- M. C. Nelson and P. Gordon-Larsen, “Physical Activity and Sedentary Behavior Patterns Are Associated with Selected Adolescent Health Risk Behaviors,” Pediatrics, Vol. 117, No. 4, 2006, pp. 1281-1290. doi:10.1542/peds.2005-1692
- M. Shields, “Overweight and Obesity among Children and Youth,” Health Reports, Vol. 17, No. 3, 2006, pp. 27-42.
- G. K. Singh, M. D. Kogan, P. C. Van Dyck and M. Siahpush, “Racial/Ethnic, Socioeconomic, and Behavioral Determinants of Childhood and Adolescent Obesity in the United States: Analyzing Independent and Joint Associations,” Annals of Epidemiology, Vol. 18, No. 9, 2008, pp. 682-695. doi:10.1016/j.annepidem.2008.05.001
- R. Lowry, S. M. Lee, M. L. McKenna, D. A. Galuska and L. K. Kann, “Weight Management and Fruit and Vegetable Intake among US High School Students,” Journal of School Health, Vol. 78, No. 8, 2008, pp. 417-424.
- R. Novotny, Y. G. Daida, S. Acharya, J. S. Grove and T. M. Vogt, “Dairy Intake Is Associated with Lower Body Fat and Soda Intake with Greater Weight in Adolescent Girls,” Journal of Nutrition, Vol. 134, No. 8, 2004, pp. 1905-1909.
- M. G. Roseman, W. K. Yeung and J. Nickelsen, “Examination of Weight Status and Dietary Behaviors of Middle School Students in Kentucky,” Journal of the American Dietetic Association, Vol. 107, No. 7, 2007, pp. 1139- 1145. doi:10.1016/j.jada.2007.04.015
- R. H. Striegel-Moore, D. Thompson, S. G. Affenito, D. L. Franko, E. Obarzanek, B. A. Barton, G. B. Schreiber, S. R. Daniels, M. Schmidt and P. B. Crawford, “Correlates of Beverage Intake in Adolescent Girls: the National Heart, Lung, and Blood Institute Growth and Health Study,” Journal of Pediatrics, Vol. 148, No. 2, 2006, pp. 183-187. doi:10.1016/j.jpeds.2005.11.025
- W. L. Elkins, D. A. Cohen, L. M. Koralewicz and S. N. Taylor, “After School Activities, Overweight, and Obesity among Inner City Youth,” Journal of Adolescence, Vol. 27, No. 2, 2004, pp. 181-189. doi:10.1016/j.adolescence.2003.10.010
- K. A. Pfeiffer, M. Dowda, R. K. Dishman, K. L. McIver, J. R. Sirard, D. S. Ward and R. R. Pate, “Sport Participation and Physical Activity in Adolescent Females across a Four-Year Period,” Journal of Adolescent Health, Vol. 39, No. 4, 2006, pp. 523-529. doi:10.1016/j.jadohealth.2006.03.005
- US Department of Health and Human Services Office of the Surgeon General, “The Surgeon General’s Call to Action to Prevent and Decrease Overweight and Obesity, Overweight in Children and Adolescents,” 2007.
- N. Koezuka, M. Koo, K. R. Allison, E. M. Adlaf, J. J. Dwyer, G. Faulkner and J. Goodman, “The Relationship between Sedentary Activities and Physical Inactivity among Adolescents: Results from the Canadian Community Health Survey,” Journal of Adolescent Health, Vol. 39, No. 4, 2006, pp. 515-522. doi:10.1016/j.jadohealth.2006.02.005
- D. E. Feldman, T. Barnett, I. Shrier, M. Rossignol and L. Abenhaim, “Is Physical Activity Differentially Associated with Different Types of Sedentary Pursuits?” Archives of Pediatrics & Adolescent Medicine, Vol. 157, No. 8, 2003, pp. 797-802. doi:10.1001/archpedi.157.8.797
- Destination ImagiNation—Who We Are, 2008. http://www.idodi.org/index.php?option=com_content&view=category&layout=blog&id=1&Itemid=7
- CDC National Center for Chronic Disease Prevention and Health Promotion, “Youth Risk Behavior Survey Item (YRBS) Rationale for the 2007 Core Questionnaire,” 2007.
- CDC, 2007 National YRBS Data Users Manual, 2008. http://www.cdc.gov/HealthyYouth/yrbs/pdf/2007_National_YRBS_Data_Users_Manual.pdf
- CDC, Growth Chart Training, 2008. http://www.cdc.gov/nccdphp/dnpa/growthcharts/index.htm.
- K. W. Bauer, M. C. Nelson, K. N. Boutelle and D. Neumark-Sztainer, “Parental Influences on Adolescents’ Physical Activity and Sedentary Behavior: Longitudinal Findings from Project EAT-II,” International Journal of Behavioral Nutrition and Physical Activity, Vol. 5, No. 12, 2008.
- K. K. Davison, T. M. Cutting and L. L. Birch, “Parents’ Activity-Related Parenting Practices Predict Girls’ Physical Activity,” Medicine & Science in Sports & Exercise, Vol. 35, No. 9, 2003, pp. 1589-1595.
- J. P. Rey-Lopez, G. Vicente-Rodriguez, M. Biosca and L. A. Moreno, “Sedentary Behaviour and Obesity Development in Children and Adolescents,” Nutrition, Metabolism & Cardiovascular Diseases, Vol. 18, No. 3, 2008, pp. 242-251. doi:10.1016/j.numecd.2007.07.008
- M. Schneider, G. F. Dunton and D. M. Cooper, “Media Use and Obesity in Adolescent Females,” Obesity (Silver Spring), Vol. 15, No. 9, 2007, pp. 2328-2335. doi:10.1038/oby.2007.276
- J. Van den Bulck and A. Hofman, “The Television-toExercise Ratio Is a Predictor of Overweight in Adolescents: Results from a Prospective Cohort Study with a Two Year Follow-Up,” Preventive Medicine, Vol. 48, No. 4, 2009, pp. 368-371. doi:10.1016/j.ypmed.2009.02.006
- S. L. Wong and S. T. Leatherdale, “Association between Sedentary Behavior, Physical Activity, and Obesity: Inactivity among Active Kids,” Preventing Chronic Disease, Vol. 6, No. 1, 2009, p. 26.