American Journal of Plant Sciences
Vol.06 No.08(2015), Article ID:56745,14 pages
10.4236/ajps.2015.68131
Remote Sensing of Selected Winter and Spring Host Plants of Tarnished Plant Bug (Heteroptera: Miridae) and Herbicide Use Strategies as a Management Tactic
Donald L. Sudbrink1, Steven J. Thomson2, Reginald S. Fletcher2, F. Aubrey Harris3, Patrick J. English3, James T. Robbins3
1Austin Peay State University, Department of Agriculture, Clarksville, USA
2United States Department of Agriculture, Agricultural Research Service, Crop Production Systems Research Unit, Stoneville, USA
3Delta Research and Extension Center, Mississippi State University, Stoneville, USA
Email: steven.thomson@ars.usda.gov
Copyright © 2015 by authors and Scientific Research Publishing Inc.
This work is licensed under the Creative Commons Attribution International License (CC BY).
http://creativecommons.org/licenses/by/4.0/


Received 21 October 2014; accepted 25 May 2015; published 28 May 2015
ABSTRACT
Remote sensing was used in a series of experiments over a three-year period to obtain spectral reflectance data for studying differences in vegetation indices between grasses, broadleaf plants, and grass/broadleaf plant mixtures. Selected non-crop winter and spring host plants of tarnished plant bug, Lygus lineolaris, were planted in field-plot experiments. Multispectral reflectance data were aerially acquired with both a Real-Time Digital Airborne Camera System (RDACS) sensor and Geospatial Systems (Duncan Tech) MS-2100 multispectral camera. The following six vegetation indices of spectral reflectance were evaluated in this study: normalized difference vegetation index, ratio vegetation index, green normalized difference vegetation index, green vegetation index, green ratio vegetation index, and Ashburn vegetation index. Vegetation indices calculated with imagery data for the grasses and broadleaves differed significantly; there appeared to be more discriminating differences between vegetation indices for grasses and broadleaf plants when the indices were based on a combination of green and near infrared or green and red spectral bands than when the indices were based on red and near infrared spectral bands. Insect data from these studies confirm that tarnished plant bug prefers broadleaf host plants, but can use Italian ryegrass for food and reproduction. The narrow temporal window of host suitability for Italian ryegrass may limit its significance. Herbicide destruction of broadleaf host plants in early spring prevented the tarnished plant bug population increases that occurred in untreated plots. Findings of this study would be useful in site-specific vegetation management decisions in programs such as the prototypical area-wide tarnished plant bug management experiment conducted in the Delta region of Mississippi.
Keywords:
Remote Sensing, Vegetation Index, Lygus lineolaris, Area-Wide Management

1. Introduction
Tarnished plant bug has become the key pest of cotton in many cotton-producing areas of the United States. Recognition of the importance of potential tarnished plant bug damage to cotton in the past often has been diminished by the severe damage potential and high control costs of boll weevil, Anthonomus grandis Boheman; bollworm, Helicoverpa zea (Boddie); and tobacco budworm, Heliothis virescens (Fabricius) [1] . However, pest status of tarnished plant bug has changed in many areas from a short-term early-season pest to being the primary reason for insecticide applications throughout the growing season. Layton [1] gives four reasons for the increased importance of tarnished plant bug in cotton, (1) development of insecticide resistance to organophosphate and pyrethroid insecticides [2] -[4] , (2) boll weevil eradication [5] , (3) increased adoption of transgenic Bt cotton and the associated decrease in coincidental control of tarnished plant bug with insecticides applied to control caterpillar pests, and (4) loss of coincidental control of tarnished plant bug when modern caterpillar- specific foliar insecticides are used.
The evolution of tarnished plant bug from an occasional pest to the key pest of cotton in many cotton-pro- ducing areas also reduces other potential values of boll weevil eradication and transgenic Bt technology, e.g., benefits such as reduced adverse environmental residues of chemical pesticides, less selection for insecticide resistance, and greater preservation of natural enemies of pests. Increasing tarnished plant bug control frequency, difficulty and cost are particularly important in areas where large investments have been made in boll weevil eradication and transgenic Bt technology. The economic value of these technologies is reduced when an opportunistic pest like the tarnished plant bug requires multiple and expensive insecticide applications. McKinion et al. [6] saw the potential for targeted or site specific application for control, and developed technology for using geographic information system-based map scouting and special techniques to obtain low-level insect population counts in both rapidly growing and poorer growing areas of cotton.
It is clear that effective and non-chemical insecticide methods for management and control of tarnished plant bug are needed. For that reason, the United States Department of Agriculture, Agricultural Research Service (USDA-ARS) began an area-wide research and technology-transfer project for managing tarnished plant bug by reducing alternate host plants in marginal non-crop areas in the Mississippi Delta prior to the growing season [7] .
The tarnished plant bug may utilize more than 300 species of host plants [8] -[10] , of which 169 host-plant species have been identified in the Delta region of the mid-South [11] . This region also has a limited proportion of its area (2.4% in one study) in non-cropland areas where undisrupted development of broadleaf- and broadleaf/grass-plant communities normally occur [12] . This relatively small area is important in the dynamics of tarnished plant bug population development. Three or four generations of plant bugs can be completed on these alternate host plants before they senesce and the bugs move to infest cultivated cotton fields. Reproduction on early-season host plants may prove to be a weak point that can be exploited in development of tarnished plant bug management tactics.
The approach used in the USDA-ARS area-wide tarnished plant bug management project has been to mow or apply herbicides to the non-crop areas for destruction of broadleaf plants (winter and spring food and reproductive hosts of tarnished plant bug) and reduce population increases of plant bugs that would later invade cotton [7] [13] -[16] . Tarnished plant bug adults and nymphs were reduced almost 50% in treated areas and costs for insecticides to control tarnished plant bug were reduced but not eliminated on farms within the treated areas [7] . One of the assumptions of this technique is that tarnished plant bug is primarily attracted to broadleaf hosts so that vegetation management could be focused on destruction of broadleaf species. The ability to detect wild host plant areas with geo-spatial technologies could facilitate the site-specific application of vegetation management strategies to reduce tarnished plant bug populations before the cropping season begins. This model for area-wide management of tarnished plant bug may be used with other suppression tactics such as mycoinsecticides [17] and sterile-insect releases [18] , where the efficiencies of limited area applications would be important. In addition to numerous other biological, technical, strategic, and tactical aspects of any proposed area-wide tarnished plant bug management program, efficient and reliable location of non-cropland winter and spring host-plant communities will be an essential operational component. Remote Sensing is a promising geo-spatial technology that has shown promise as tool for detecting crop areas [19] and alternate host plants infested by pests [20] [21] . This technology may provide the data necessary to characterize and map plant communities (crop and non-crop) in a target landscape where area-wide management tactics will be applied to limited areas.
Vegetation indices (mathematical combinations of spectral band reflectance data, i.e. ratios, differences, or ratios of differences and sums) derived from remotely-sensed imagery data have been used to assess various vegetation features such as biomass, moisture content, stress, plant health, crop and discrimination, and crop production [22] -[24] . These relative expressions are designed to amplify measurable differences in reflectance specified by spectral bands for vegetation of interest. Analysis of indices based on such differences may provide sufficient information to identify, or more likely to generally classify vegetation by species, species mixtures, or habitat type. Researchers have employed remotely-sensed vegetation indices in insect management research to classify cotton fields into high and low tarnished plant bug infestation risk management zones and to develop spray/no spray prescription maps when above threshold tarnished plant bug infestation occurred [20] [25] -[28] and to classify a cotton field into end-of-season management zones (for timing of site-specific insect control termination and harvest-aid chemical application) based on crop maturity [29] . Preliminary analyses of multi- spectral imagery data and spectroradiometer data acquired over uncultivated plant communities showed that late-season broadleaf hosts of tarnished plant bug, Lygus lineolaris (Palisot de Beauvois), could be distinguished from grasses [30] . This suggests that the technology may also be useful for detection and differentiating early- season hosts of tarnished plant bug. Motivating factors for interest in using data acquired via remote-sensing techniques to classify plant communities are the increased importance of tarnished plant bug as a pest of cotton, and the relevancy of applying this technology in area-wide tarnished plant bug management programs.
Field-plot experiments were conducted during three years beginning in the fall of 1999 and concluded in the spring of 2002. Treatments were designed as empirical simulations of non-crop winter and spring host plants of tarnished plant bug. The objective was to determine if remote sensing techniques could be used to detect and differentiate the different plant species (grasses, broadleaves, and species mixtures). Data were also acquired on the incidence of tarnished plant bug in the plots of selected plants, and on the effect of broadleaf host plant destruction.
2. Materials and Methods
2.1. Field Plot Establishment
Field plots were planted at Stoneville, MS for the remote-sensing and tarnished plant bug studies to be conducted the following winter and spring. On 18 November 1999, a test containing the following plant species (eight host-plant treatments) was planted in plots with a four replicate randomized complete block (RCB) arrangement (n = 32 plots): broadleaf plants-radish, Raphanus sativus L.; crimson clover, Trifolium incarnatum L.; winter pea, Pisum sativum L.; and hairy vetch, Vicia villosa (L.) Roth; and grasses-Italian ryegrass, Lolium multiflorum Lam.; rye, Secale cereale L.; wheat, Triticum aestivum L.; and oats, Avena sativa L. On 25 October 2000, a test containing the following plant species and mixtures of species (five host-plant treatments) was planted in plots with an eight replicate RCB arrangement (n = 40 plots): Italian ryegrass, hairy vetch, crimson clover, a Italian ryegrass/hairy vetch mixture; and a Italian ryegrass/crimson clover mixture. On 9 October 2001, a test containing the following plant species and a mixture of species (three host-plant treatments) was planted in plots with an eight replicate RCB arrangement (n = 24 plots): Italian ryegrass, hairy vetch, and an Italian ryegrass/hairy vetch mixture.
Plots were approximately 256 m2 (16 m × 16 m) and square or slightly angled parallelograms bordered on each side by a 5-m wide tilled alley. Seedbed preparation was accomplished by tilling the test area with a disc harrow and seedbed conditioner (reel, harrow, and drag) to remove all vegetation and to provide a level and uniform soil surface for planting. Seeding was accomplished with an all-terrain vehicle mounted cyclone-type seeder. Seed rate and coverage provided complete and uniform coverage of the plots with the designated plant species when percent germination was high. In 1999, germination proved to be low in some plots, a function of seed quality and cool temperatures following the 18 November 1999 planting date. A follow-up seeding was done in early December 1999 with a hand operated cyclone-type seeder. No follow-up seeding was done in the fall 2000 and 2001 plantings. Where mixtures of two plant species were planted, a seeding rate was used to achieve approximately equal vegetation coverage.
2.2. Imagery Data and Acquisition Image Processing
Remotely-sensed data were acquired aerially with a Real-Time Digital Airborne Camera System (RDACS) sensor on 25 February 2000 (altitude―1829 m), 6 April 2001 (altitude―1829 m), and 21 February 2002 (altitude― 3659 m). The RDACS sensor acquired spectral reflectance data in three bands with center wavelengths as follows: green = 550 nm, red = 695 nm, and near infrared = 850 nm. Pixel size was 1 m2 in imagery acquired with the RDACS sensor in 2000 and 2001, and 2 m2 in imagery acquired with the RDACS sensor on 21 February 2002. A second set of remotely-sensed imagery data was aerially acquired in 2002 from an altitude of about 1067 m on 2 April with a Geospatial Systems Duncantech MS-2100 digital camera using three spectral bands with center wavelengths as follows: green = 540 nm, red = 660 nm, and near infrared = 800 nm. Spatial resolution of the imagery was 1 m2.
Imagery data representing each plot were processed from pixels in an area within the plot defined as the area of interest. The area of interest for each plot was positioned within the whole plot so that all sides were approximately equidistant from the whole plot sides. Dimensions of areas of interest were approximately 10.2 m × 11.5 m in 2000, 12.6 m × 11.8 m in 2001; 10.8 m × 9.9 m for 21 February 2002 imagery and 12.1 m × 11.7 m for 2 April 2002 imagery. Radiance values for each spectral band in each pixel were used in Arcview® to calculate vegetation indices for each pixel within each area of interest (Arcview® software, Environmental Systems Research Institute Inc., Redlands, California). Arcview® was used to calculate the minimum, maximum, range, mean, and standard deviation for each index in the area of interest of each plot. The mean vegetation index value for the area of interest within a plot was used as the raw datum vegetation index for the plot. The number of pixels per area of interest ranged from 116 to 119 in 2000, from 122 to 136 in 2001, from 25 to 30 in 21 February 2002 imagery, and from 128 to 140 in 2 April 2002 imagery. Variation in number of pixels per area of interest was caused by uncontrolled spatial orientation of imagery pixels relative to orientation of plots on the ground. When one-half or more of a borderline pixel was within the area of interest, it was considered part of the area of interest and its radiance values were included in calculations.
2.3. Vegetation Indices
The vegetation indices were calculated with reflectance data of the spectral bands described above, i.e. bands characterized by the wavelength of each band center―green (540 or 550 nm), red (660 or 695 nm), and near infrared (NIR) (800 or 850 nm). Wavelength centers depended on whether the RDACS or Geospatial Systems imaging systems were used. The following six vegetation indices were calculated from imagery and analyzed: (1) the normalized difference vegetation index (NDVI Equation 1) is a widely used vegetation index [31] , essentially the standard vegetation index; (2) the ratio vegetation index (RVI Equation 2) was defined earlier than NDVI and provides similar information for dense vegetation cover [32] ; (3) green normalized difference vegetation index (GNDVI, Equation (3)) is a variation of the standard NDVI [33] ; (4) green ratio vegetation index (GRVI, Equation 4) is similar to RVI but green replaces red in the equation [34] ; (5) the green vegetation index (GVI, Equation 5) is a ratio of the difference and sum of green and red band reflectances [35] ; and (6) the Ashburn vegetation index (AVI, Equation (6)) is a simple calculation of the difference in radiance between NIR and red [36] . The equations used to calculate the vegetation indices are as follows:
 (1)
(1)
 (2)
(2)
 (3)
(3)
 (4)
(4)
 (5)
(5)
 (6)
(6)
2.4. Reassignment of Treatments for Insect Study
After imagery acquisition was completed and in preparation for tarnished plant bug studies, there was need to reconfigure the experimental design of the 2001 and 2002 experiments. The experiment planted in 1999 for study in the winter and spring of 2000 remained eight treatments replicated four times and arranged in randomized complete blocks throughout observation period of the experiment. The treatments in experiments planted in the fall of 2000 and 2001 for study in the winter and spring of 2001 and 2002, respectively, were reassigned to factorial configurations so that each treatment (plant species or species mixture) was split into two subplot herbicide treatments. This was done to accommodate study of the incidence of tarnished plant bug in the plots of selected plants and study of the effect of broadleaf host plant destruction on tarnished plant bug, i.e. an empirical simulation of the area-wide approach to reducing tarnished plant bug numbers on winter and spring broadleaf host plants.
The reassigned factorial arrangement of treatments for the 2000/2001 experiment was the five host plant treatments (factor A) (Italian ryegrass, hairy vetch, crimson clover, an Italian ryegrass/hairy vetch mixture, and an Italian ryegrass/clover mixture) split into the two factor B herbicide treatments: herbicide treated and untreated. Reassigned treatments for the 2001/2002 experiment were the three host plant treatments (factor A) (Italian ryegrass, hairy vetch, and an Italian ryegrass/vetch mixture) split into the two factor B herbicide treatments: herbicide treated and untreated. Both experiments then became four replications of the factorial treatment array, where n remained 40 plots in 2001 and 24 plots in 2002.
Herbicide treatments were applied in both 2001 and 2002 after all imagery data acquisitions were completed and after tarnished plant bug populations were established in broadleaf plots. The herbicide treatments (2, 4-D [LV4 - 63.7%], @ 1.12 kg/ha) (WilFarm, Gladstone, MO) were applied 6 April and 2 April in 2001 and 2002, respectively, which accomplished the selective destruction of broadleaf plants in the plots.
2.5. Field Plot Observations
In addition to remote sensing acquisition of reflectance data, various observations for biological data acquisition were made each year in the field plots. Relative ground cover estimates for each plant species were made in the plots and recorded as percent ground cover. These ground cover estimates (visual observation and subjective judgment of percent coverage) were based on the discussion of [37] . Round sampling rings containing an area of 0.25 sq m per ring were randomly positioned in each plot (5 rings/plot). Percent ground cover for each species within each ring was estimated on 3 March, 31 March, 18 April, and 12 May 2000; on 6 April (pre-application of herbicide) and 17 April (post-application) in 2001; and on 1 April (pre-application of herbicide) and 24 April (post-application) in 2002. Insect samples with a standard 38-cm sweep net (25 sweeps/plot) were made at four- to eight-day intervals from late February through mid May in 2000, at four- to five-day intervals in April of 2001, and at six- to nine-day intervals from early April to mid May in 2002.
2.6. Statistical Analyses
All data were subjected to analysis of variance (ANOVA) and test of mean differences by a least significant difference comparison (LSD) (P ≤ 0.05) (PROC GLM Procedure, SAS Institute, Inc. 2003, Cary, NC).
3. Results
3.1. Imagery
Vegetation indices calculated from multispectral imagery data acquired on 25 February 2000 are summarized in Table 1. These data show statistically significant differences in all mean vegetation index values between the four broadleaf species compared with the four grass species in the pure stands in the experiment. Differences are also apparent in the color infrared image of the 2000 experiment derived from imagery acquired on 25 February (Figure 1). Poor stand establishment and/or slow growth of hairy vetch and crimson clover in 1999/2000 resulted in low percent ground cover ratings for these species (Table 2). This is probably why vegetation indices for these two species were significantly different in most cases from those for radish and winter pea. Only mean GNDVI and GVI showed up differences between radish and winter pea. All two grasses showed relatively high percent ground cover ratings on all rating dates (Table 2). There were no significant differences between grasses
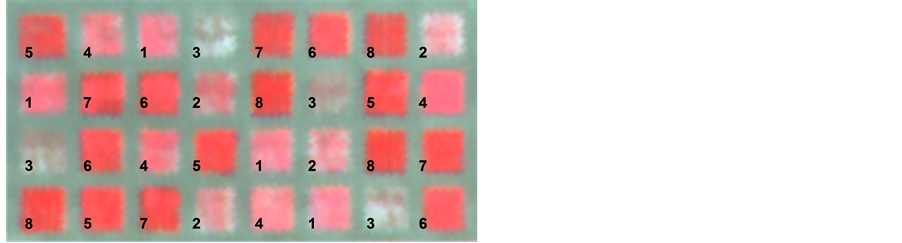
Figure 1. Color infrared image of the experiment from aerial imagery acquired on 25 February 2000, where 1 is radish, 2 is crimson clover, 3 is hairy vetch, 4 is winter pea, 5 is Italian ryegrass, 6 is rye, 7 is wheat, and 8 is oats.

Table 1. Mean vegetation indices for imagery data obtained on 25 February 2000, for eight plant species (grass or broadleaf), Stoneville, Mississippi.
aNDVI: normalized difference vegetation index, RVI: ratio vegetation index, GNDVI: green normalized difference vegetation index, GRVI: green ratio vegetation index, GVI: green vegetation index, AVI: Ashburn vegetation index. bMeans within the same column followed by the same letter are not significantly different based on least significant difference comparisons (P ≤ 0.05).
Table 2. Mean percent ground cover ratings of planted species on four dates, Stoneville, Mississippi, 2000.
aMeans within the same column followed by the same letter are not significantly different based on least significant difference comparisons (P ≤ 0.05).
for vegetation indices that were based on reflectance in red and near infrared bands, i.e. NDVI, RVI, and AVI. There were significant differences between grasses for vegetation indices that were based on relative reflectances in green and near infrared bands and in green and red bands, i.e. GNDVI, GRVI, and GVI (Table 1).
Vegetation indices calculated from multispectral imagery data acquired on 6 April 2001 are summarized in Table 3. The later date for imagery acquisition in 2001 than in 2000 allowed greater plant growth and more ground cover than had occurred at the earlier date in 2000. However in these data, vegetation indices for crimson clover were influenced by a poor stand. Percent ground cover estimates presented in Table 4 show near 30% or less cover before application of herbicide in the pure stand of crimson clover. Therefore, the data for crimson clover and Italian ryegrass/clover are ignored. Vegetation index differences between Italian ryegrass and hairy vetch were not as large in the 6 April 2001 data as in the 25 February 2000 data, but there were significant differences for RVI, GNDVI, GRVI, and GVI. The differences in Italian ryegrass and Italian ryegrass/hairy vetch were not statistically significantly different (P > 0.05), except for mean GVI values. Vegetation indices for the Italian ryegrass/vetch mixture were very close to those for the pure stand of Italian ryegrass and indicate that mixtures of grass and broadleaf species may be difficult to distinguish from pure grass stands. However, mean GNDVI, GRVI, and GVI (vegetation indices that involved the green spectral band) for the Italian ryegrass/hairy vetch mixture consistently, but not significantly, ranked intermediate to those indices for the pure stands of Italian ryegrass and hairy vetch. Vegetation index means were higher in most cases (exception was GVI) for pure Italian ryegrass and Italian ryegrass/hairy vetch mixture plots than for pure hairy vetch plots (Table 3).
Vegetation indices calculated for multispectral imagery data acquired on two dates in 2002 are summarized in Table 5. Percent ground cover ratings (Table 6) indicate high levels of ground cover for all target species in plots studied in 2002. The mean differences for the various vegetation indices in 2002 were similar to those shown in 2000 and 2001 data. Ranges of means within vegetation indices were slightly different between the 21 February imagery acquisition and the 2 April imagery acquisition, but relative differences were similar.
3.2. Tarnished Plant Bug and Host Plants
First collections of tarnished plant bug from broadleaf host plots occurred in late February of 2000, but counts did not reach consistently measurable levels until late March (Figure 2). Tarnished plant bug counts increased from late March until reaching peak levels in early May, then declined as host senescence began. Tarnished plant bug preference for broadleaf hosts is shown by higher numbers sampled in the broadleaf species than in the grass species (Figure 2 and Figure 3, note the ten-fold higher scale for tarnished plant bug on broadleaf species than on grass species). Radish was an attractive host plant for tarnished plant bug from late March
Table 3. Mean vegetation indices for imagery data obtained on 25 February 2000, for eight plant species (grass or broadleaf), Stoneville, Mississippi.
aNDVI: normalized difference vegetation index, RVI: ratio vegetation index, GNDVI: green normalized difference vegetation index, GRVI: green ratio vegetation index, GVI: green vegetation index, AVI: Ashburn vegetation index; bMeans within the same column followed by the same letter are not significantly different based on least significant difference comparisons (P ≤ 0.05).

Figure 2. Tarnished plant bug counts (nymphs plus adults), late winter and spring on four broadleaf plant species, study of 2000.
Table 4. Mean percent ground cover of planted species before and after herbicide application, Stoneville, Mississippi, 2001.
aHerbicide (2,4-D) applied on 6 April 2001; bMeans within the same column followed by the same letter are not significantly different based on least significant difference comparisons (P ≤ 0.05); cNP: not planted in treatment plots; dVolunteer or accidental Italian ryegrass plants in non-Italian ryegrass plots.
Table 5. Mean vegetation indices for imagery data obtained on 21 February and 2 April 2002 for a grass species, a broadleaf species, and a grass/broadleaf mixture, Stoneville, Mississippi.
aNDVI: normalized difference vegetation index, RVI: ratio vegetation index, GNDVI: green normalized difference vegetation index, GRVI: green ratio vegetation index, GVI: green vegetation index, AVI: Ashburn vegetation index; bMeans within the same column followed by the same letter are not significantly different based on least significant difference comparisons (P ≤ 0.05).
Table 6. Mean percent ground cover of plant species before and after herbicide application, Stoneville, Mississippi, 2002.
aHerbicide (2,4-D) applied on 2 April 2002; bMeans within the same column followed by the same letter are not significantly different based on least significant difference comparisons (P ≤ 0.05); cNP: not planted in treatment plots; dVolunteer or accidental Italian ryegrass plants in non-Italian ryegrass plots.
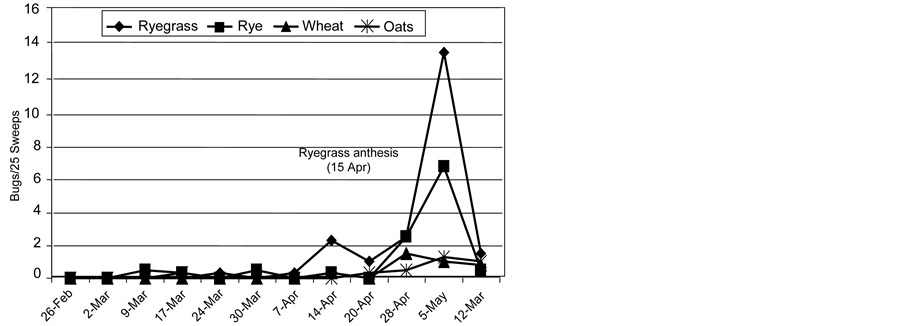
Figure 3. Tarnished plant bug counts (nymphs plus adults), late winter and spring on four grass species, study of 2000.
throughout the remainder of the sample period (February-May). The highest tarnished plant bug numbers in the study were collected from radish plots, followed by crimson clover, hairy vetch, winter pea, and the grass species. Low levels of tarnished plant bug were collected from grasses, particularly Italian ryegrass and rye (Figure 3).
3.3. Effect of Broadleaf Host Plant Destruction
The first collections of tarnished plant bug in 2001 occurred in some of the plots in mid-March, but populations did not occur consistently until early April. In samples taken just prior to herbicide application (6 April 2001), tarnished plant bug populations (adults) were significantly greater in the hairy vetch and Italian ryegrass/hairy vetch plots compared with the other plots (Table 7). Percent cover of hairy vetch was reduced following the herbicide application while there was no significant change in the untreated plots (Table 4). Crimson clover did not establish complete stands in plots in 2001. At the first post-application sampling date (11 April 2001), average tarnished plant bug counts were significantly greater in hairy vetch or Italian ryegrass/hairy vetch plots than in Italian ryegrass or crimson clover plots (data not shown). In plots planted with hairy vetch, tarnished plant bug counts averaged over three post-application sample dates were significantly higher in untreated hairy vetch and Italian ryegrass/hairy vetch plots than in herbicide treated hairy vetch and Italian ryegrass/hairy vetch plots (Table 7). As in 2000, low numbers of tarnished plant bug were collected in Italian ryegrass plots when the plants reached anthesis (11 April 2001―data not shown). All Italian ryegrass plots (both Italian ryegrass alone and Italian ryegrass in combination with a broadleaf species) showed low level tarnished plant bug infestation after a herbicide application when averaged over the three post-application sampling dates (Table 7). By the last sampling date (20 April 2001), average tarnished plant bug counts were highest in the untreated hairy vetch and Italian ryegrass/hairy vetch plots, and there were 91% and 84% reductions in tarnished plant bug numbers in both herbicide treated hairy vetch and Italian ryegrass/hairy vetch mix plots, respectively, compared to the untreated hairy vetch and Italian ryegrass/hairy vetch plots.
In 2002, tarnished plant bug first occurred in some plots in mid-January, but populations did not start to significantly increase until the last week of March. Before herbicide was applied, tarnished plant bug numbers were lower in pure Italian ryegrass plots compared with the other plots containing hairy vetch (Table 8). The herbicide reduced the percent cover of hairy vetch in treated plots while there was no change in untreated plots (Table 6). Consequently, there were higher (P ≤ 0.05) tarnished plant bug numbers in untreated hairy vetch and Italian ryegrass/hairy vetch plots than in herbicide treated hairy vetch and Italian ryegrass/hairy vetch plots (Table 8). As in previous years, tarnished plant bug increased in Italian ryegrass plots when plants reached anthesis (11 April 2002―data not shown). By the last sampling date (7 May 2002), there was a 94% reduction in tarnished plant bug numbers in herbicide treated hairy vetch plots compared with untreated hairy vetch plots and a 76% reduction in tarnished plant bug numbers in herbicide treated Italian ryegrass/hairy vetch plots compared with untreated Italian ryegrass/hairy vetch plots. The average percent reductions of tarnished plant bug by the herbicide treatment over the five post-application sample dates for hairy vetch plots and Italian ryegrass/hairy vetch plots were 81% and 45%, respectively (Table 8).
Table 7. Mean tarnished plant bug counts in alternate host plant study before and after herbicide application for broadleaf plant destruction, Stoneville, Mississippi, 2001.
aHerbicide (2,4-D) applied on 6 April 2001; bAverage of three post-application observation dates, 11 April, 16 April, and 20 April 2001; cNo statistical analysis; dMeans within the same column followed by the same letter are not significantly different based on least significant difference comparisons (P ≤ 0.05).
Table 8. Mean tarnished plant bug counts in alternate host plant study before and after herbicide application for broadleaf plant destruction, Stoneville, Mississippi, 2002.
aHerbicide (2,4-D) applied on 2 April 2002; bApril Average of five post-application observation dates, 11 April, 17 April, 23 April, 29 April, and 7 May; cMeans within the same column followed by the same letter are not significantly different based on least significant difference comparisons (P ≤ 0.05).
4. Discussion
4.1. Imagery
Differences in vegetation indices between grasses (four species) and broadleaf plants (one brassica and three legumes) suggest that use of remote sensing and geo-spatial technologies to identify and locate these and similar late winter and early spring broadleaf host plants could be useful in the implementation of area-wide tarnished plant bug management programs, especially in areas with limited non-crop vegetation communities. The various vegetation index differences between homogenous stands of grasses and homogenous stands of broadleaf plants is consistent with the work reported by [38] in which the spectral signatures of grasses produced higher NDVI values than broadleaf plants and with the work reported by [39] -[41] in which they distinguished weed and crop plants with multispectral video and multispectral digital imagery. There appeared to be more discriminating differences between vegetation indices for grasses and broadleaf plants when the indices were based on green and near infrared or green and red spectral bands than when the indices were based on red and near infrared spectral bands. This suggests that the ability for more discriminating classification of plant species and communities may be gained by future work using other bands of multispectral imagery, or with hyperspectral imagery, than has been accomplished with the conventional NDVI.
Chlorophyll concentration varies from one plant species to the next. NDVI performs well when chlorophyll concentration is low and partial plant cover exists; however, the sensitivity of NDVI is significantly affected when chlorophyll concentrations are high [42] . Saturation of NDVI at chlorophyll levels ranging from 3 - 8 ug∙cm−2 has been reported in the literature [43] -[46] . Vegetation indices consisting of a green spectral band have performed well when chlorophyll concentrations are high and were more sensitive to changes in chlorophyll concentrations in plant leaves [33] . For this study, it is speculated that the vegetation indices consisting of a green spectral band provided better separation between the broadleaf and the grass plant species because of their sensitivity to changes in chlorophyll concentration between the plant species.
4.2. Effect of Broadleaf Host Plant Destruction
Results of the field plot tests at Stoneville in 2000, 2001, and 2002 confirm that use of imagery data to generally classify vegetation into broadly defined categories (i.e., annual grasses, grass/broadleaf mixtures, or annual broadleaf groups) may be sufficient for a program such as the prototypical area-wide tarnished plant bug management program that has been conducted in the delta area of Mississippi. This is consistent with results of area-wide tarnished plant bug management studies where herbicides were used to destroy non-crop broadleaf host plants in late winter and early spring [16] . The occurrence of tarnished plant bug on several grasses in the 2000 experiment (Figure 3) and on Italian ryegrass in the 2001 and 2002 experiments (Table 7 and Table 8), especially the occurrence of nymphs on Italian ryegrass after herbicide application in 2001, indicate that this polyphagous insect can use grass as a host. This phenomenon was also observed by Abel and Snodgrass [47] who reported that tarnished plant bug nymphs feed and develop on corn, Zea maize L., another grass species. In their study, tarnished plant bug nymphs fed on and developed on corn undergoing tasseling and silking. Reference [16] reported tarnished plant bugs feeding on Italian ryegrass. Consequently, the authors changed the timing of herbicide applications in their area-wide experiment in 2000 and 2001. In their study, Italian ryegrass served as a reproductive host of tarnished plant bug only when it flowered during late April and May and laboratory feeding studies confirmed that nymphs did not develop to adulthood on non-flowering Italian ryegrass. This narrow phenological window of host suitability was also observed in our study as tarnished plant bug numbers increased in late April peaked in early May and declined by mid-May (Figure 3). While adaptation to feeding on flowering Italian ryegrass by tarnished plant bug has required adjustments to timing of area-wide herbicide treatments, Also, the incorporation of other site-specific suppression methods, such as mycoinsecticides, the sterile insect technique, or other biological control methods, which do not limit tarnished plant bug to grass species in the spring, may reduce the bug’s host-shifting potential.
5. Conclusions
The following conclusions can be made based on results of our study:
1. Vegetation indices calculated from multispectral imagery data showed statistically significant differences in all mean vegetation index values among the four broadleaf species compared with four grass species in the pure stands.
2. There were no significant differences between grasses for vegetation indices that were based on reflectance in red and near infrared bands, but there were significant differences between grasses for vegetation indices that were based on relative reflectance in green and near infrared bands and in green and red bands.
3. Insect data confirmed that tarnished plant bug prefers broadleaf host plants, but can use Italian ryegrass for food and reproduction. The narrow temporal window of host suitability for Italian ryegrass may limit its significance.
4. Use of imagery data to generally classify vegetation into broadly defined categories (i.e., annual grasses, grass/broadleaf mixtures, or annual broadleaf groups) may be sufficient for a program such as the prototypical area-wide tarnished plant bug management program that has been conducted in the delta area of Mississippi.
5. Based on our results, herbicide destruction of broadleaf host plants in early spring prevented the tarnished plant bug population increases that occurred in untreated plots.
Acknowledgements and Disclaimer
The authors would like to thank Randy Furr, Sean Horton, Gordon Snodgrass, William Scott, Boise Stokes, and David Sullivan for their assistance in conducting this research; Brenda Yant for her assistance with image processing and preparation of figures; N. Buehring, Gordon Snodgrass, and Gene Wills for review and help in preparation of the manuscript; and Debbie Boykin and Patrick Gerard for their advice and assistance in statistical analyses of data. This research was funded in part by National Aeronautics and Space Administration through the Mississippi State University Remote Sensing Technologies Center, and the United States Department of Agriculture (USDA)-National Institute of Food and Agriculture, Advanced Spatial Technologies in Agriculture project at Mississippi State University. Mention of trademark, vendor, or proprietary product does not constitute a guarantee or warranty of the product by the USDA or Mississippi State University and does not imply its approval to the exclusion of other products that may also be suitable.
References
- Layton, M.B. (2000) Biology and Damage of the Tarnished Plant Bug, Lygus lineolaris, in Cotton. Southwestern Entomologist, 23, 7-20.
- Snodgrass, G.L. (1994) Pyrethroid Resistance in a Field Population of the Tarnished Plant Bug in Cotton in the Mississippi Delta. Proceedings of the Beltwide Cotton Conferences, San Diego, 5-8 January 1994, 1186-1187.
- Snodgrass, G.L. and Elzen, G.W. (1995) Insecticide Resistance in a Tarnished Plant Bug Population in Cotton in the Mississippi Delta. Southwestern Entomologist, 20, 317-323.
- Snodgrass, G.L. (1996) Insecticide Resistance in Field Populations of the Tarnished Plant Bug (Heteroptera: Miridae) in Cotton in the Mississippi Delta. Journal of Economic Entomology, 89, 783-790. http://dx.doi.org/10.1093/jee/89.4.783
- Harris, F.A. and Smith, J.W. (2001) Boll weevil Eradication in Mississippi. In: Dickerson, W.A., Brashear, A.L., Brumley, J.T., Carter, F.L., Grefenstette, W.J. and Harris, F.A., Eds., Boll Weevil Eradication in the United States through 1999, Reference Book Series No. 6, The Cotton Foundation, Memphis, 305-344.
- McKinion, J.M., Jenkins, J.N., Willers, J.L. and Zumanis, A. (2009) Spatially Variable Insecticide Applications for Early Season Control of Cotton Insect Pests. Computers and Electronics in Agriculture, 67, 71-79. http://dx.doi.org/10.1016/j.compag.2009.03.004
- Snodgrass, G.L., Scott, W., Robbins, J.T. and Hardee, D.D. (2003) Suppression of Tarnished Plant Bugs in Cotton by Treatment of Early Season Wild Host Plants with Herbicides in Nine-Square-Mile Areas of the Mississippi Delta. Proceedings of the Beltwide Cotton Conferences, Nashville, 6-10 January 2003, 933-935.
- Young, O.P. (1986) Host Plants of the Tarnished Plant Bug, Lygus lineolaris, (Hemiptera: Miridae). Annals of the Entomological Society of America, 79, 747-762. http://dx.doi.org/10.1093/aesa/79.4.747
- Fleischer, S.J. and Gaylor, M.J. (1987) Seasonal Abundance of Lygus lineolaris (Heteroptera: Miridae) and Selected Predators in Early Season Uncultivated Hosts: Implications for Managing Movement into Cotton. Environmental Entomology, 16, 379-389. http://dx.doi.org/10.1093/ee/16.2.379
- Penn State Extension (2014) Fact Sheet: Tarnished Plant Bug. http://ento.psu.edu/extension/factsheets/tarnished-plant-bug
- Snodgrass, G.L., Scott, W. and Smith, J.W. (1984) Host Plants and Seasonal Distribution of the Tarnished Plant Bug in the Delta of Arkansas, Louisiana, and Mississippi. Environmental Entomology, 13, 110-116. http://dx.doi.org/10.1093/ee/13.1.110
- Snodgrass, G.L., Stadelbacher, E.A. and Smith, J.W. (1991) Distribution and Abundance of Early Season Wild Host Plants and Bollworm and Tobacco Budworm Populations (Lepidoptera: Noctuidae) in an Intensively Cropped Area of the Mid-Delta of Mississippi. Journal of Entomological Science, 26, 9-16.
- Weaver-Missick, T. (1999) Banishing Tarnished Plant Bugs from Cotton. Agricultural Research, 47, 12-14.
- Robbins, J.T., Snodgrass, G.L. and Harris, F.A. (2000) A Review of Wild Host Plants and Their Management for Control of the Tarnished Plant Bug in Cotton in the Southern US. Southwestern Entomologist, 23, 21-25.
- Snodgrass, G.L., Scott, W., Hardee, D. and Robbins, J.T. (2000) Results of a Two Year Study of Tarnished Plant Bug. Proceedings of the Beltwide Cotton Conferences, San Antonio, 4-8 January 2000, 1229-1233.
- Snodgrass, G.L., Scott, W.P., Abel, C.A., Robbins, J.T., Gore, J. and Hardee, D.D. (2005) Tarnished Plant Bug (Heteroptera: Miridae) Populations near Fields after Early Season Herbicide Treatment. Environmental Entomology, 34, 705-711. http://dx.doi.org/10.1603/0046-225X-34.3.705
- Leland, J.E. and Behle, R.W. (2003) Development of Mycoinsecticides for Controlling Tarnished Plant Bugs on Wild Host Plants. Proceedings of the Beltwide Cotton Conferences, Nashville, 6-10 January 2003, 954-964.
- Villavaso, E.J. (2005) Effects of Irradiation on Reproduction in Tarnished Plant Bug (Heteroptera: Miridae) and F1 Progeny. Journal of Entomological Science, 40, 39-46.
- Thenkabail, P.S., Lyon, J.G. and Huete, A. (2012) Hyperspectral Remote Sensing of Vegetation. CRC Press, Taylor and Francis Group, Boca Raton.
- Allen, J.C., Kopp, D.D., Brewster, C.C. and Fleischer, S.J. (1999) 2011: An Agricultural Odyssey. American Entomologist, 45, 96-104. http://dx.doi.org/10.1093/ae/45.2.96
- Brewster, C.C., Allen, J.C. and Kopp, D.D. (1999) IPM from Space: Using Satellite Imagery to Construct Regional Crop Maps for Studying Crop―Insect Interaction. American Entomologist, 45, 105-117. http://dx.doi.org/10.1093/ae/45.2.105
- Jackson, R.D. and Huete, A.R. (1991) Interpreting Vegetation Indices. Preventive Veterinary Medicine, 11, 185-200. http://dx.doi.org/10.1016/S0167-5877(05)80004-2
- Silleos, N.G., Alexandridis, T.K., Gitas, I.Z. and Perakis, K. (2006) Vegetation Indices: Advances Made in Biomass Estimation and Vegetation Monitoring in the Last 30 Years. Geocarto International, 21, 21-28. http://dx.doi.org/10.1080/10106040608542399
- Meyer, G.E. and Neto, J.C. (2008) Verification of Color Vegetation Indices for Automated Crop Imaging Applications. Computers and Electronics in Agriculture, 63, 282-293. http://dx.doi.org/10.1016/j.compag.2008.03.009
- Willers, J.L., DuPont, J.K., Campanella, R., Seal, M.R., Hood, K.B., Williams, J. and Woodard, D. (2000) Employment of Spatially Variable Insecticide Applications for Tarnished Plant Bug Control in Cotton. Proceedings of the Beltwide Cotton Conferences, San Antonio, 4-8 January 2000, 1133.
- DuPont, K., Campanella, R., Seal, M.R., Willers, J.L. and Hood, K.B. (2000) Spatially Variable Insecticide Applications through Remote Sensing. Proceedings of the Beltwide Cotton Conferences, San Antonio, 4-8 January 2000, 426- 429.
- Sudbrink, D.L., Harris, F.A., Robbins, J.T. and English, P.J. (2001) Remote Sensing and Site Specific Management of Cotton Arthropods in the Mississippi Delta. Proceedings of the Beltwide Cotton Conferences, Anaheim, 9-13 January 2001, 1220-1225.
- Sudbrink, D.L., Harris, F.A., Robbins, J.T. and English, P.J. (2002) Site Specific Management in Mississippi Delta Cotton: Experimental Field Studies and On-Farm Application. Proceedings of the Beltwide Cotton Conferences, Atlanta, 8-12 January 2002, CD-ROM H060.
- Harris, F.A., English, P.J., Sudbrink, D.L., Nichols, S.P., Snipes, C.E., Hanks, J. and Wills, G. (2004) Remote-Sensing Measures of Cotton Maturity―Cutout and Boll Opening. Proceedings of the Beltwide Cotton Conferences, San Antonio, 5-9 January 2004, 1869-1875.
- Sudbrink Jr., D.L., Harris, F.A., Robbins, J.T., Snodgrass, G.L. and Thomson, S.J. (2000) Remote Sensing of Late Season Pest Damage to Cotton and Wild Hosts of Tarnished Plant Bug in the Mississippi Delta. Proceedings of the Beltwide Cotton Conferences, San Antonio, 4-8 January 2000, 1220-1223.
- Rouse, J.W., Haas, R.H., Schell, J.A. and Deering, D.W. (1973) Monitoring Vegetation Systems in the Great Plains with ERTS. Proceedings of the Third ERTS Symposium, Washington DC, 10-14 December 1973, 309-317.
- Birth, G.S. and McVey, G. (1968) Measuring the Color of Growing Turf with a Reflectance Spectroradiometer. Agronomy Journal, 60, 640-643. http://dx.doi.org/10.2134/agronj1968.00021962006000060016x
- Gitelson, A.A., Kaufman, Y.J. and Merzlyak, M.N. (1996) Use of a Green Channel in Remote Sensing of Global Vegetation from EOS-MODIS. Remote Sensing of Environment, 58, 289-298. http://dx.doi.org/10.1016/S0034-4257(96)00072-7
- Jordan, C.F. (1969) Derivation of Leaf Area Index from Quality of Light on the Forest Floor. Ecology, 50, 663-666. http://dx.doi.org/10.2307/1936256
- Tucker, C.J. (1979) Red and Photographic Infrared Linear Combinations for Monitoring Vegetation. Remote Sensing of Environ, 8, 127-150. http://dx.doi.org/10.1016/0034-4257(79)90013-0
- Ashburn, P. (1978) The Vegetative Index Number and Crop Identification. Proceedings of Technical Sessions of the LACIE Symposium, Houston, 23-26 October 1978, 843-856.
- Barbour, M.G., Burk, J.H. and Pitts, W.D. (1987) Methods of Sampling the Plant Community. In: Barbour, M.G., Burk, J.H. and Pitts, W.D., Eds., Terrestrial Plant Ecology, 2nd Edition, Benjamin/Cummings Pub. Co., Menlo Park, 182- 207.
- Jensen, J.R. (2000) Remote Sensing of the Environment. Prentice Hall, New York.
- Richardson, A.J., Menges, R.M. and Nixon, P.R. (1985) Distinguishing Weed from Crop Plants Using Video Remote Sensing. Photogrammetric Engineering and Remote Sensing, 51, 1785-1790.
- Medlin, C.R., Shaw, D.R., Gerard, P.D. and LaMastus, F.E. (2000) Using Remote Sensing to Detect Weed Infestations in Glycine max. Weed Science, 48, 393-398. http://dx.doi.org/10.1614/0043-1745(2000)048[0393:URSTDW]2.0.CO;2
- Bajwa, S.G. and Tian, L.F. (2001) Aerial CIR Remote Sensing for Weed Density Mapping in a Soybean Field. Transactions of the American Society of Agricultural Engineers, 44, 1965-1974.
- Yoder, B.J. and Waring, R.H. (1994) The Normalized Difference Vegetation Index of Small Douglas-Fir Canopies with Varying Chlorophyll Concentrations. Remote Sensing of Environment, 48, 81-91. http://dx.doi.org/10.1016/0034-4257(94)90061-2
- Buschmann, C. and Nagel, E. (1993) In Vivo Spectroscopy and Internal Optics of Leaves as Basis for Remote Sensing of Vegetation. International Journal of Remote Sensing, 14, 711-722. http://dx.doi.org/10.1080/01431169308904370
- Gitelson, A. and Merzlyak, M.N. (1994) Spectral Reflectance Changes Associated with Autumn Senescence of Aesculus hipppocastanum L. and Acer platanoides L. Leaves. Spectral Features and Relation to Chlorophyll Estimation. Journal of Plant Physiology, 143, 286-292. http://dx.doi.org/10.1016/S0176-1617(11)81633-0
- Gitelson, A. and Merzlyak, M.N. (1994) Quantitative Estimation of Chlorophyll-a Using Reflectance Spectra: Experiments with Autumn Chestnut and Maple Leaves. Journal of Photochemistry and Photobiology, 13, 247-252. http://dx.doi.org/10.1016/1011-1344(93)06963-4
- Vogelman, T.C., Rock, B.N. and Moss, D.M. (1993) Red Edge Spectral Measurements from Sugar Maple Leaves. International Journal of Remote Sensing, 14, 1563-1575. http://dx.doi.org/10.1080/01431169308953986
- Abel, C.A. and Snodgrass, G.L. (2003) The Development of Tarnished Plant Bugs on Various Corn Tissue. Proceedings of the Beltwide Cotton Conferences, Nashville, 6-10 January 2003, 949-953.