Open Journal of Anesthesiology
Vol.3 No.3(2013), Article ID:31727,6 pages DOI:10.4236/ojanes.2013.33047
Assessment of Pericardium Volume by the Stroke Volume Variation in Patients with Off-Pump Cardiac Surgery
![]()
1Department of Clinical Medicine, Shandong University, Jinan, China; 2Department of Orthopedics, Qilu Hospital of Shandong University, Jinan, China; 3Department of Anesthesiology, Qianfo Mountain Hospital of Shandong University, Jinan, China.
Email: wyldgf@163.com
Copyright © 2013 Chenyang Dai et al. This is an open access article distributed under the Creative Commons Attribution License, which permits unrestricted use, distribution, and reproduction in any medium, provided the original work is properly cited.
Received January 26th, 2013; revised April 1st, 2013; accepted April 15th, 2013
Keywords: Stroke Volume Variations; Heart-Lung; Sternotomy; Monitoring; Functional Hemodynamic; Cardiac Surgery
ABSTRACT
Objective: SVV is derived from the cardiopulmonary interaction, which is used to predict the responsiveness of cardiac preload guiding fluid therapy in patients under general anesthesia in non-opened chest surgery. From a clinical point of view, it is important to know how well SVV reflects preload and fluid responsiveness during cardiac surgery. This study was undertaken to assess the accuracy and reliability of SVV derived from the FloTrac/Vigileo system in monitoring changes in blood volume in patients undergoing off-pump coronary artery bypass grafting (OPCABG) under general anesthesia. Methods: After approval from the ethics committee and obtaining the permission of the patients, twenty-nine patients, ASA II-III and NYHA II-III, aged 44 - 77 yr, undergoing elective off-pump coronary artery bypass grafting, were randomly divided into 2 groups: the control group (group C, n = 8) and volume expansion group (group V, n = 21). After patients entered the operating room, veins were put in line, ECG, HR, SpO2, and PETCO2 were continuously monitored. Left radial arterial and right internal jugular vein catheters were inserted under local anesthesia. The FloTracTM/VigileoTM system was connected and MAP, CO, CI, SVV, SV, SVI, SVR, SVRI, CVP were continuously monitored. BIS values were kept at 45% - 55.6% hydroxyethyl starch 130/0.4 sodium chloride solution 7 ml/kg was intravenously infused after completion of sternotomy and pericardiotomy at a rate of 0.25 ml/kg–1/min–1 in group V. MAP, HR, CVP, systemic vascular resistance (SVR), SVV, and stroke volume index (SVI) were determined 10 min before (T1) and after the infusion of finished (T2), and the change rate (ΔHR, ΔMAP, ΔCVP, ΔSVR, ΔSVV, ΔSVI) was calculated. Sodium chloride injection 3 ml/kg was infused in group C. Results: CVP, SVI, CO and CI were increased after volume expansion, SVRI and SVV significantly decreased in group V(P < 0.01), while MAP and HR were not changed. Changes in HR(r = –0.737, P < 0.05) and SVR(r = –0.480, P < 0.05) were significantly correlated to changes in SVI, but there was no correlation between ΔCVP, ΔMAP, ΔSVV and ΔSVI. SVV(r = 0.640, P < 0.01) and HR(r = 0.591, P < 0.01) before volume expansion were correlated to changes in SVI,but no correlation was found between MAP, SVR, CVP and changes in SVI. Analysis of results of the receiver operating characteristic (ROC) curve showed that when the change rate of SVI ≥ 25% was used as the criteria for assessment of the changes in blood volume, the diagnostic threshold of SVV was 8.8%. When SVV ≥ 8.8%, the sensitivity and specificity of blood volume monitoring were 52.6% and 100% respectively. Conclusion: SVV derived from the FloTrac/Vigileo system cannot accurately monitor changes in fluid responsiveness in patients undergoing off-pump coronary artery bypass grafting under general anesthesia, though it is better than CVP and MAP.
1. Introduction
Overzealous fluid therapy can increase blood volume and overfill the heart, while hypovolemia can lead to a reflex increase in heart rate. Both conditions may inevitably increase myocardial oxygen consumption and are dangerous to patients with poor cardiac function or ischemic heart disease [1]. Therefore, it is extremely important to accurately assess and guide fluid therapy and avoid factors and processes that increase myocardial oxygen consumption. The key to anesthesia in off-pump coronary artery bypass grafting (OPCABG) is to maintain the myocardial oxygen supply and demand balance. Consequently it is particularly important to control the heart rate, maintain the stability of blood pressure, and assess and regulate the volume. The appropriate indicators to assess OPCABG patients’ blood volume changes and timely, scientific and effective treatment of volume have important clinical significance [2]. Traditional indicators such as CVP and PAWP used in the reflection of blood volume changes were easily influence by changes in posture, heart position, cardiovascular compliance and intra-thoracic pressure. SVV, as a new dynamic hemodynamic indicator to reflect cardiac preload fluid responsiveness of mechanically ventilated patients has been clinically used [3-5]. During open chest surgery, whether SVV can predict the cardiac preload fluid responsiveness and veracity of monitoring the blood volume change in general anesthesia patients is still unknown [6-8]. Hence, this research was proposed to assess whether SVV can predict the fluid responsiveness of patients under general anesthesia with off-pump coronary artery bypass grafting and how good it is in open chest surgery.
2. Materials and Methods
2.1. General Materials
The Ethics Committee of Qianfoshan Hospital Affiliated to Shandong University approved this study, and patients participating in the study signed the anesthesia informed consent form.
2.1.1. Case Selection and Grouping
Twenty-nine cases of patients under general anesthesia who needed off-pump coronary artery bypass grafting (OPCABG) were selected in this study, male or female, aged from 44 - 77, ASA II-III and NYHA Functional Classification II-III, with myoglobin (Hb) ≥ 110 g/L, hematocrit (Hct) > 30% and left ventricular ejection fraction (LVEF > 35%), without respiratory and endocrine system disease history, and without obvious abnormalities such as liver, kidney, lung or blood coagulation. Also there was no peripheral arterial occlusive disease, intraventricular shunt, severe valvular disease and arrhythmia found. All patients were randomly divided into 2 groups: the control group (group C, n = 8) and the volume expansion group (V group, n = 21).
2.1.2. Test Equipment and Drugs
Anesthesia machine (Drager Julian,Germany), Philips E2 multifunctional vital signs monitor (Philips Company, Holland), Aspect 2000 bispectral index (BIS) monitor (Aspect Company, America), FloTrac sensor/Vigileo monitor, 7F three lumen central venous catheter, pressure sensor (Edwards Company, USA), 6% hydroxyethyl starch 130/0.4 sodium chloride injection (Voluven, 500 ml/
bag, Beijing Fresenius Kabi Pharmaceutical Co., Ltd.), and compound sodium chloride injection (500 ml/bag, Qingdao Huaren Pharmaceutical Co., Ltd.).
2.2. Methods
2.2.1. Experimental Design Grouping
Twenty-nine patients (male or female) were selected and randomly divided into two groups:
Control group: C group, n = 8, the T1 and T2 uniform infused 3 ml/kg compound sodium chloride injection.
Volume expansion group: V group, n = 21, open chest surgery, pericardium opened, after being hemodynamically stable for 5 min (denoted as T1), 6% hydroxyethyl starch 130/0.4 sodium chloride injection 7 ml/kg of intravenous infusion was performed at the rate of 0.25 ml/ kg–1/min–1 (Recorded for T2 10 min after infusion).
2.2.2. Anesthesia Implementation
1) Preparation of Anesthesia Thirty min before anesthesia 0.3 mg of intramuscular scopolamine and 5 mg of morphine were given. After opening the chest, patients were continuously monitored by electrocardiogram (ECG), heart rate (HR), apulse oximetry (SpO2) and end-tidal carbon dioxide partial pressure (PETCO2). The left radial artery and right internal jugular vein puncture catheter were conducted with local anesthesia, and connected to the FloTracTM sensor and VigileoTM monitor to continuously monitor the mean arterial pressure (MAP), cardiac output (CO), cardiac index (CI), stroke volume variation (SVV) and stroke volume (SV), stroke volume index (SVI), systemic vascular resistance (SVR), systemic vascular resistance index (SVRI) and CVP.
2) Anesthesia Methods The patients of the two groups underwent general anesthesia. Inductions of anesthesia were: intravenous injection with 3 mg of midazolam, 0.2 mg/kg of etomidate, 10 μg/kg of fentanyl, 0.6 - 0.8 mg/kg of rocuronium and 30 mg of lidocaine; after 3 - 5 min direct vision intubation under the laryngoscope was conducted (50 mg of Spray lidocaine was given in the trachea before intubation). Then intermittent positive pressure ventilation (IPPV) was performed. Respiratory indicators were: 8 ml/kg of tidal volume (VT), 12 times/min of respiratory rate (RR), positive end expiratory pressure (PEEP) with 0, 80% of inhaled oxygen concentration, 3 L/min of the oxygen flow; maintaining airway pressure < 30 cm H2O (1 cm H2O = 0.098 kPa), end-expiratory carbon dioxide partial pressure at 35 - 45 mmHg (1 mmHg = 0.133 kPa) and SpO2 > 98%. Maintenance of anesthesia was: intravenous target-controlled infusion (TCI) with propofol, the target plasma concentration at 2 - 3 µg/ml and continuous intravenous infusion with 0.2 - 0.45 µg/kg–1/min–1 of remifentanil, following inhalation of sevoflurane and intermittent intravenous injection with atracurium. BIS values were kept at 45 - 55 during surgery. Arterial blood gas analysis and detection were periodically performed during surgery.
BIS values were kept at 45 - 55 and 3 ml/kg of interval compound sodium chloride injection was infused in group C.
2.3. The Observed Monitoring Indicators
Six percent hydroxyethyl starch 130/0.4 sodium chloride solution 7 ml/kg was infused intravenously in group V. MAP, HR, CVP, CO, CI, systemic vascular resistance (SVR), SVRI, SVV and stroke volume index (SVI) were determined 10 min before (T1) and after the infusion of finished (T2), The average of the three measured data at each time point was taken as valid indicators. Also the change rates of hemodynamic indicators [value T2 – T1/ value T1] were calculated and recorded as ΔHR, ΔMAP, ΔCVP, ΔSVR, ΔSVV and ΔSVI.
The change rates of hemodynamic indicators (MAP, HR, CVP, CO, CI, SVR, SVRI, SVV and SVI) were determined at T1 and T2 in group C. The average of the three measured data at each time point was also taken as valid indicators. The change rates of hemodynamic indicators (ΔMAP, ΔHR, ΔCVP, ΔSVV, ΔSVI and ΔSVR) were calculated.
2.4. Statistic Process
SPSS17.0 statistic software was adopted in the data analysis, and measurement data expressed as mean ± standard deviation. Paired t test was used in intra-group comparison and group t test was used in inter-group comparison. The receiver operator characteristic curve (ROC) of fluid responsiveness of CVP, MAP, HR, SVV and SVR was drawn. ΔSVI ≥ 25% [9] was used as the criteria of effective water treatment expansion, comparing the area under the curve (AUC, AUC ≤ 0.5 indicated no clinical significance of diagnostic tests; 0.5 < AUC ≤ 0.7 suggested low diagnostic value; 0.7 < AUC ≤ 0.9 indicated the diagnostic value of the medium; while AUC > 0.9 showed diagnosis of high value).
3. Results
3.1. General Condition
Differences of constituent ratio of gender, age, height, and weight and body surface area in patients were not statistically significant (Table 1).
3.2. Changes in Hemodynamic Indicators
Compared with T1, CVP, SVI and CI were raised and SVRI and SVV were decreased (P < 0.01) at T2 in the volume expansion group, with no statistical significance in the differences of MAP and HR. There was no statistical significance in each indicator at T1 and T2 in control group (P > 0.05). The hemodynamic indicators of the two groups at each time point were within the normal range, with no statistical significance in inter-group comparison (P > 0.05) (Table 2).
3.3. The Correlation between Hemodynamic Indicators and ΔSVI
In group V, ΔSVI was (39 ± 16)% after infusion, which was ΔSVI ≥ 25%[(42 ± 15)%] in 19 patients and ΔSVI ≤ 25%[(14 ± 4)%] in 2 patients. ΔHR(r = –0.737, P < 0.05) and ΔSVR(r = –0.480, P < 0.05) had significant correlation with ΔSVI while ΔCVP, ΔMAP and ΔSVV had no significant correlation with ΔSVI in group V. Before expansion, SVV(r = 0.640, P < 0.01) and HR(r = 0.591, P < 0.01) were correlated to ΔSVI in the volume expansion group while MAP, SVR, CVP had no significant correlation to ΔSVI (Table 3).
3.4. ROC Curve Analysis
During open chest surgery, ΔSVI ≥ 25% was the criteria to predict fluid responsiveness; the diagnostic threshold of SVV was 8.8%, sensitivity 52.6% and specificity 100%. The area under the ROC curve showed SVV (0.579) was superior to CVP, MAP and SVR (0.053 - 0.368), though the accuracy of the SVV in monitoring blood volume changes was low (Table 4).
4. Discussions
It is important to accurately assess the volume state of
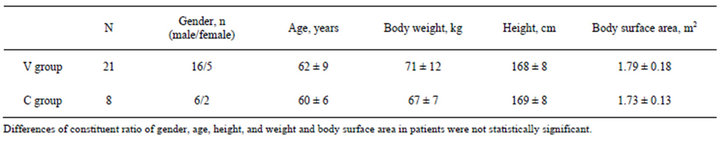
Table 1. General characteristics in the two groups .
.
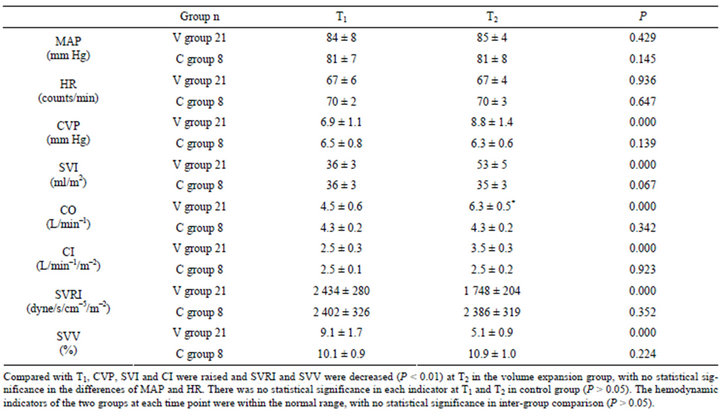
Table 2. Comparison of hemodynamic indicators at various points in time between the two groups .
.
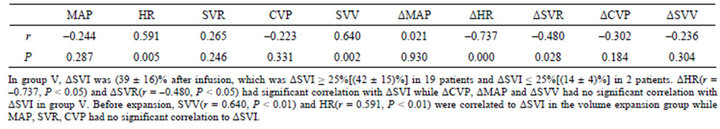
Table 3. The relationship between hemodynamic changes and ΔSVI at T1 and T2 in group V.
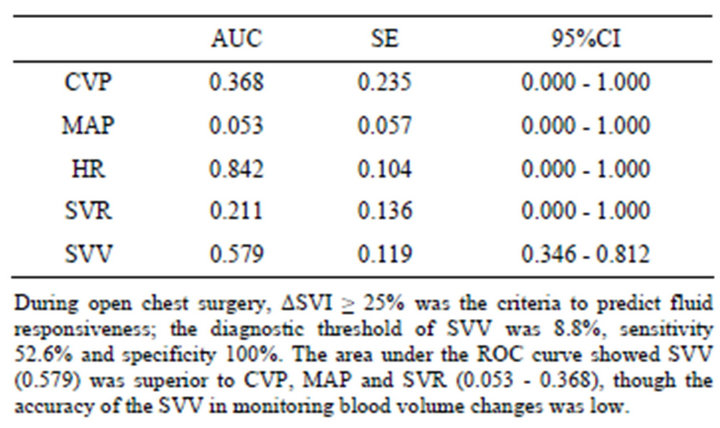
Table 4. The area under ROC and 95% confidence intervals of various indicators.
the patients and give reasonable volume therapies, and also to reduce unnecessary use of vasoactive drugs and increase cardiac output so that there is an increased per fusion of the heart and other various body organs and tissues, in order to reduce oxygen consumption while increasing oxygen supply and maintaining the balance of oxygen supply and oxygen consumption, in cardiac surgery anesthesia, especially in the OPCABG anesthesia process.
CVP, PCWP, right atrial pressure (RAP), pulmonary artery occlusion pressure (PAOP), right ventricular enddiastolic volume (RVEDV) and left ventricular end-diastolic area (LVEDA) cardiac preload volume indicators have been used as indicators to predict fluid responsiveness in critically ill patients [10,11]. In a comprehensive study of fluid responsiveness predictors in critically ill patients, Michard F. et al. stated that the indicators did not always accurately reflect ventricular preload [11]. Although volume indicators obtained by transesophageal echocardiography could accurately assess the cardiac function and volume [10], the clinical application was limited due to expensive equipment, high operating requirements, and discontinuous monitoring.
According to prior research, SVV is a good indicator for predicting cardiac preload responsiveness and guiding fluid therapy [9,12,13]. An study on SVV in coronary artery bypass graft surgery by Cannesson M. et al. [4] with the FloTrac/Vigileo system showed SVV had sufficient sensitivity and specificity to predict fluid responsivenessin mechanically ventilated patients. SVV had a high correlation to ΔCI (r = 0.60, P = 0.01), the threshold of SVV to distinguish between fluid responsiveness was 10%, the sensitivity was 82% and specificity 88%.
SVV is derived from the interaction between the heart and lungs. With intermittent positive pressure ventilation, intra-thoracic pressure will create changesin the heart lung interaction. In a respiratory cycle, inspiratory SV is reduced and expiratory SV is increased. In a hypovolemic state, the vena cava and right atrium are more compliant and prone to collapse [14,15]. Intra-thoracic pressure changes are more easily transmitted to the structure of the vena cava and right atrium. SV declines at this time and the reduction range of SV increases in exhaling when compared to inhaling, which results in SVV increasing. Therefore, the high SVV prompted that SV and cardiac output of hypovolemic patients can be improved by supplementing liquid. Conversely, vasoactive drug treatment is more reasonable for hypovolemic patients with lower SVV.
In most cardiac surgical procedures, pleural and pericardial cavities are opened, which have an important influence on hemodynamics and cardiopulmonary interaction [10]. In this study, the SVV and ΔSVI during open chest surgery had a moderately positive correlation, suggesting that monitoring SVV could predict fluid responsiveness in patients with heart preload and reflect the changes in blood volume. The size of the area under the ROC curve (the receiver operator characteristic curve) can reflect the diagnostic value of an indicator for a particular disease. ROC curve analysis showed that if ΔSVI ≥ 25% was used as a criterion for monitoring blood volume changes, the SVV diagnostic threshold value was 8.8%, with a sensitivity of 52.6%, and a specificity of 100%. In this study, the areas under the curve of the SVV, CVP and MAP were 0.579, 0.368, and 0.053 respectively; although the area under the curve of SVV was greater than CVP and MAP. The accuracy of monitoring blood volume changes of SVV was lower due to the small AUC.
The results of this study showed that the open pleural and pericardial cavity in OPCABG relieved the limits of chest wall and pericardium to the heart and the large blood vessels in the chest cavity, following the increase in venous return and cardiac preload, which made the Frank-Starling relationship curve of the left ventricular in patients shift to the right, and reduced changes in preload-dependent stroke volume, which meant that the changes in intra-thoracic pressure were influenced. But in the whole open chest surgery, because various ventilation parameters remained constant, intra-thoracic pressure changes were small and the venous return change was reduced, causing a small change range of SVV. This may be the reason in this study that diagnostic threshold of SVV in open chest surgery was lower than that in traditional non-open chest surgery in the prediction of fluid responsiveness. In addition, some studies [14] have confirmed that the complete pericardium plays an important role in functional preload indicators to predict ventricular liquid responsiveness. It has been proven that a pericardial incision can change the right ventricular filling, while interactions between the ventricular system are reduced due to the release of pericardial constraint in the heart, because following the contribution of the right ventricular filling to the cyclic changes of the left ventricular stroke volume are also weakened [16].
Therefore, the opened pericardium might be one of the reasons that caused the low accuracy of cardiac preload liquid responsiveness of mechanical ventilation in patients with general anesthesia and blood volume changes. Consequently, although SVV could reflect the cardiopulmonary interaction caused by positive pressure ventilation, it was weak in the accuracy of the prediction of cardiac preload fluid responsiveness in general anesthetic patients with mechanical ventilation and the monitoring of blood volume changes, which would not be good for guidance of fluid treatment of OPCABG patients.
5. Conclusions
1) During open chest surgery, SVV in the basic state can assess the fluid responsiveness of general anesthesia patients with OPCABG, although the diagnostic threshold of SVV during open chest surgery is lower than that in traditional non-open chest surgery in predicting fluid responsiveness (8.8%).
2) During open chest surgery, the accuracy of fluid responsiveness in mechanically ventilated in patients undergoing general anesthesia as measured by the FloTracTM/ VigileoTM system is relatively low.
6. Acknowledgements
Thanks to Dr. Edward C. Mignot, Shandong University, for linguistic advice.
REFERENCES
- D. Osman, C. Ridel, P. Ray, et al., “Cardiac Filling Pressures Are Not Appropriate to Predict Hemodynamic Response to Volume Challenge,” Critical Care Medicine, Vol. 35, No. 1, 2007, pp. 64-68. doi:10.1097/01.CCM.0000249851.94101.4F
- K. Bendjelid and J. A. Romand, “Fluid Responsiveness in Mechanically Ventilated Patients: A Review of Indices Used in Intensive Care,” Intensive Care Medicine, Vol. 29, No. 8, 2003, pp. 352-360. doi:10.1007/s00134-003-1777-0
- C. K. Hofer, A. Senn, L. Weibel, et al., “Assessment of Stroke Volume Variation for Prediction of Fluid Responsiveness Using the Modified FloTrac™ and PiCCOplus™ System,” Critical Care, Vol. 12, No. 3, 2008, p. R82. doi:10.1186/cc6933
- M. Cannesson, H. Musard, O. Desebbe, et al., “The Ability of Stroke Volume Variations Obtained with Vigileo/ FloTrac System to Monitor Fluid Responsiveness in Mechanically Ventilated Patients,” Anesthesia & Analgesia, Vol. 108, No. 2, 2009, pp. 513-517. doi:10.1213/ane.0b013e318192a36b
- P. E. Marik, R. Cavallazzi, T. Vasu and A. Hirani, “Dynamic Changes in Arterial Waveform Derived Variables and Fluid Responsiveness in Mechanically Ventilated Patients: A Systematic Review of the Literature,” Critical Care Medicine, Vol. 37, No. 9, 2009, pp. 2642-2647. doi:10.1097/CCM.0b013e3181a590da
- D. A. Reuter, M. S. G. Goepfert, T. Goresch, et al., “Assessing Fluid Responsiveness during Open Chest Conditions,” British Journal of Anaesthesia, Vol. 94, No. 3, 2005, pp. 318-323. doi:10.1093/bja/aei043
- P. A. Wyffels, P. Sergeant and P. F. Wouters, “The Value of Pulse Pressure and Stroke Volume Variation as Predictors of Fluid Responsiveness during Open Chest Surgery,” Anaesthesia, Vol. 65, No. 7, 2010, pp. 704-709. doi:10.1111/j.1365-2044.2010.06371.x
- S. Rex, G. Schälte, S. Schroth, et al., “Limitations of Arterial Pulse Pressure Variation and Left Ventricular Stroke Volume Variation in Estimating Cardiac Pre-Load during Open Heart Surgery,” Acta Anaesthesiologica Scandinavica, Vol. 51, No. 9, 2007, pp. 1258-1267.
- C. P. Tousignant, F. Walsh and C. D. Mazer, “The Use of Transesophageal Echocardiography for Preload Assessment in Critically Ill Patients,” Anesthesia & Analgesia, Vol. 90, No. 2, 2000, pp. 351-355.
- F. Michard and J. L. Teboul, “Predicting Fluid Responsiveness in ICU Patients: A Critical Analysis of the Evidence,” Chest, Vol. 121, No. 6, 2002, pp. 2000-2008. doi:10.1378/chest.121.6.2000
- M. Sander, C. D. Spies, K. Berger, et al., “Prediction of Volume Response under Open-Chest Conditions during Coronary Artery Bypass Surgery,” Critical Care, Vol. 11, No. 6, 2007, p. R121. doi:10.1186/cc6181
- L. Belloni, A. Pisano, A. Natale, et al., “Assessment of Fluid-Responsiveness Parameters for Off-Pump Coronary Artery Bypass Surgery: A Comparison among LiDCO, Transesophageal Echochardiography, and Pulmonary Artery Catheter,” Journal of Cardiothoracic and Vascular Anesthesia, Vol. 22, No. 2, 2008, pp. 243-248. doi:10.1053/j.jvca.2007.07.007
- C. K. Hofer, S. M. Müller and L. Furrer, et al., “Stroke Volume and Pulse Pressure Variation for Prediction of Fluid Responsiveness in Patients Undergoing Off-Pump Coronary Artery Bypass Grafting,” Chest, Vol. 128, No. 2, 2005, pp. 848-854. doi:10.1378/chest.128.2.848
- C. Barbier, Y. Loubieres, C. Schmit, et al., “Respiratory Changes in Inferior Vena Cava Diameter Are Helpful in Predicting Fluid Responsiveness in Ventilated Septic Patients,” Intensive Care Medicine, Vol. 30, No. 9, 2004, pp. 1740-1746. doi:10.1007/s00134-004-2259-8
- W. P. Santamore and J. N. Amoore, “Buffering of Respiratory Variations in Venous Return by Right Ventricle: A Theoretical Analysis,” American Journal of Physiology, Vol. 267, No. 6, 1994, pp. H2163-H2170.
- J. A. Shaver, P. S. Reddy, E. I. Curtiss, et al., “Noninvasive/Invasive Correlates of Exaggerated Ventricular Interdependence in Cardiac Tamponade,” Journal of Cardiology, Vol. 37, No. S1, 2001, pp. 71-76.