Vol.2, No.5, 427-431 (2010) Natural Science
http://dx.doi.org/10.4236/ns.2010.25052
Copyright © 2010 SciRes. OPEN ACCESS
The capabilities of the calculated approach for the
astroclimatic assessment in radioastronomy
Nikolay V. Ruzhentsev*, Alexander S. Mihailov
Department of Microwave Radiospectrometry, Institute of Radio Astronomy, National Academy of Sciences, Kharkov, Ukraine;
*Corresponding Author: ruzh@rian.kharkov.ua
Received 30 December 2009; revised 3 February 2010; accepted 25 February 2010.
ABSTRACT
The work is dedicated to calculation of daily
variability of monthly averaged full vertical at-
mospheric absorption for six well-known moun-
tain locations of sub-millimeter wave band ra-
diotelescopes obtained with usage of chosen by
authors models combination. Test locations we-
re defined as follows: Chajnantor plateau in the
Atacama mountain desert (Chile), Hanle (India),
South Pole (Antarctic), Mauna Kea (Hawaii,
USA), Sierra Negra (Puebla, Mexico) and El
Leoncito (Argentine). The data of these calcula-
tions were compared with the data of long term
radiometric observations of other authors. Se-
arching for new alternative places to comple-
ment existing sub-millimeter telescopes loca-
tions was attempted too.
Keywords: Radiotelescopes; Atmosphere
Absorption; Sub-Millimeter Waves Range;
Astroclimate
1. INTRODUCTION
Earth atmosphere causes considerable impediments for
radioastronomical observations at millimeter and sub-
millimeter waves bands due to atmosphere attenuation
and instability its transfer function. Consequently, even a
slight improvement of the transfer function and its sta-
bility can lead to a tangible radioastronomical observa-
tions efficiency increase, especially in the submillimeter
wave range. In view of this and taking uniqueness and
high cost of the radiotelescopes that are installed in
various regions of the world, location astroclimatic suit-
ability assessment is required. These assessments are
usually experimental and consist of gathering the statis-
tical information concerning the extent of atmospheric
attenuation, it’s seasonal and daily unsteadiness to reveal
the most favorable time and place for the observation to
be performed [1-5]. A few only places with most suitable
for allocation of sub-millimeter waves radiotelescopes
are known [6] to the present time in a world. It is Cha-
jnantor plateau in the Atacama mountain desert (Chile),
Hanle in the Chanthang mountain plateau (India), South
Pole (Antarctic) Mauna Kea (Hawaii, USA). The un-
questionable advantage of the experimental approach is
the precise measurement of the atmospheric attenuation
in the defined frequency range in the defined location.
However, the most significant disadvantages of this ap-
proach are the fact that only a limited set of frequencies
is used for the experiment (usually 1 or 2 frequencies)
[1-4], the necessity of continuous observations cycles
that last several years, financial, hardware and organiza-
tional efforts and expenses of this important, but yet
auxiliary support for radioastronomic observation.
On the contrary, analytical astroclymatic assessment
approaches could provide operative and cheap daily and
seasonal unsteadiness prognostication for any millimeter
and submillimeter wavelength in any location of the
world. However, there was an impediment on the route
to the practical implementation of this approach: There
were no adequate models of global distribution of mete-
orological parameters altitude profile that were required
for this kind of astroclymatic assessment until present
days. The purpose of this work is the finding and dem-
onstrating new possibility (unavailable earlier) of ob-
taining of astroclimatic estimations of atmospheric at-
tenuation average values by calculated method, as well
as definition new locations of radio telescopes (most
favourable for radioastronomical observations) of sub-
millimetre range.
As we have shown recently in [7-9] (on the example
of 15 regions of Ukraine) utilization of the chosen com-
bination of Liebe’s atmosphere attenuation model and
the latest meteorological atmosphere standard (grounded
on the ERA-15 base data) [10-12] allows us to acquire a
good (within the 10% precision interval) harmony of
analytical calculations and experimental data concerning
the monthly attenuation average in the atmosphere above
the plain-type landscape. It is also very important for
certain applications that the chosen models combination
N. V. Ruzhentsev et al. / Natural Science 2 (2010) 427-431
Copyright © 2010 SciRes. OPEN ACCESS
428
allows the atmospheric absorption variability prognosti-
cation for different times of day. However, mentioned
above application of models need to be considered for
the mountainous landscape also because a great amount
of radiotelescopes at millimeter range and especially
submillimeter range are located up to 5 km above the sea
level.
This work contains the calculation of daily variability
of monthly averaged full vertical atmospheric absorption
using the chosen model combination for six well-known
mountain locations of submillimeter waverange radio-
telescopes. Test locations were defined as follows: Cha-
jnantor plain in the Atacama mountain desert (Chile,
5000 m), Hanle (India, 4500 m), South Pole (Antarctic,
2800 m), Mauna Kea (Hawaii, USA, 4100 m), Sierra
Negra (Puebla, Mexico, 4600 m) and El Leonsito (Ar-
gentina, 2500 m).
Data from these calculations were compared with data
of long period radiometric observations (from one year
up to nine years) of other authors. Searching for new,
alternative or other places to complement existing sub-
millimeter telescope locations was attempted.
2. RESULTS OF CALCULATIONS
AND ITS COMPARISON WITH
EXPERIMENTAL DATA
Figure 1 displays analytically acquired dependencies of
monthly average full vertical atmospheric absorption
values on the UT time of day for Chajnantor during
January and July on the frequency of 225 GHz.
International astronomic submillimeter waverange ob-
servatory (ALMA) is located on the height of 5 km
above sea level. Nine years cycle atmospheric absorption
yearly observation results for the frequency of 225 GHz
[1] as well as the results of our calculations are displayed
on the same figure.
Figure 2 displays the calculated dependencies of the
full vertical atmospheric absorption on the UT time of
day for Hanle during January and July on the frequency
of 220 GHz. Indian astronomic submillimeter waverange
observatory (IAO) is located on the height of 4.5 km
above sea level in the Hanle. Atmospheric absorption
year cycle observation results for the frequency of 220
GHz taken from [2] are displayed on the same figure.
Figure 3(a) display analytically acquired dependen-
cies of monthly average full vertical atmospheric ab-
sorption values on the UT time of day for EI Leoncito
during January, February and July on the frequency of
405 GHz. EI Leoncito is an Argentinean-Brazilian
sub-millimeter wave range radiotelescope located on the
height of 2.5 km above sea level. The results of one-year
cycle of atmospheric absorption observation for 405
GHz frequency taken from [4] are displayed on the Fig-
ure 3(b).
Figure 4(a) display analytically acquired dependen-
cies of monthly average full vertical atmospheric ab-
sorption values on the UT time of day for South Pole
during January and July on the frequency of 225 GHz.
American Antarctic remote observatory with a sub-mil-
limeter wave range radiotelescope (AST-RO) was lo-
cated in the South Pole on the height of 2.8 km above
sea level. The results of half-year cycle of atmospheric
absorption observation for the 225 GHz frequency taken
from [3] are displayed on the Figure 4(b).
In the Figures 1-4 the rather close layout of data cal-
culated by us and points taken from the literary data [1-5]
is well visible for radio telescopes in El Leoncito Argen-
tina (405 GHz), on South Pole (220 GHz), in Hanle
(220 GHz), in Chajnantor (225 GHz).
The differences of calculation data and data of ex-
periments, as a rule, are concentrated in the interval of
(a)
(b)
Figure 1. Calculated dependencies of the daily
changing of the monthly average values of full verti-
cal atmospheric absorption (a) as well as the results
of our calculations (bold curve) and experimental
observations [1] (square) of monthly averaged values
of vertical atmospheric absorption (b) for the Cha-
jnantor (225 GHz).
N. V. Ruzhentsev et al. / Natural Science 2 (2010) 427-431
Copyright © 2010 SciRes. OPEN ACCESS
429
429
(a)
(b)
Figure 2. Calculated dependencies of daily
changing of the monthly average values of full
vertical atmospheric absorption (a) as well as
the results of our calculations (bold curve) and
experimental observations [2] (squares) of mon-
thly averaged values of vertical atmospheric
absorption (b) for the Hanle on the frequency of
220 GHz.
10-20% in the winter and 20-30% in the summer for the
year courses of monthly average values of vertical ab-
sorption of atmosphere on all of selected by us radiote-
lescopes. (The separate summer month only takes place
an exception in Chajnantor and in Hanle, when these
differences are noticeably higher.) Our calculations of
diurnal variability have completely qualitatively coin-
ciding with experiment and differed quantitatively from
experiments less than on 15-20%.
Let’s remark that it would be possible to expect a de-
creasing all these 10-30% values of differences in a case
of more correct comparison of calculated and experi-
mental data. The absence of complete correctness in rea-
lization of such comparisons is caused by different peri-
ods of averaging for different literary experimental data
and data of our calculation during definition of monthly
vertical absorption values of atmosphere. The values of
this parameter calculated by us were based on the data of
fifteen-years meteorological observations, while the ex-
perimental values reduced in the literature were obtained
by averaging from radiometer data for one of separated
years only.
Influence of above-mentioned cause is well visible,
for example, on dispersion of experimental values of
monthly average absorption defined for different years
in the Chajnantor (Figure 1) or in the Hanle [2]. The
small differences (less than 15%) between data of our
calculations (averaged for fifteen-years term) and ex-
perimental average-year values of absorption in Mauna
Kea [5] (averaged for eleven-years term) as well as be-
tween experimental data for Sierra Negra [13] (averaged
for four-years term) shows a validity of such point of
view.
Besides it is necessary to take into account that the
experimental measurements were carried out not always
in the conditions of completely clear atmosphere. But
nevertheless a carried out qualitative and quantitative
(though upper estimations) rating of errors of considered
(a)
(b)
term of observations: 28 February-1 March
Figure 3. Calculated dependencies of daily changing of the
monthly average values of full vertical atmospheric absorp-
tion (a) as well as the results of our calculations of monthly
averaged (gray curve) and daily experimental observations
(squares) values of vertical atmospheric absorption [4] (b)
for EI leoncito observatory on 405 GHz.
N. V. Ruzhentsev et al. / Natural Science 2 (2010) 427-431
Copyright © 2010 SciRes. OPEN ACCESS
430
(a)
(b)
Figure 4. Calculated dependencies of daily changing
of the monthly average values of full vertical atmos-
pheric absorption (a) as well as the results of our cal-
culations of monthly averaged (gray curve) and daily
experimental observations (squares) values of vertical
atmospheric absorption [3] (b) for South Pole on the
frequency of 220 GHz.
by us method of astroclimatic forecasting is visual and
useful enough (Figures 1-4).
3. SEARCH FOR ALTERNATIVE AND
ADDITIONAL RADIOTELESCOPE
LOCATIONS
The results that were acquired in the previous section
demonstrated an efficiency, high operability and func-
tional capabilities of calculational approach to astrocly-
matic assessment. At the same time, analysis of the most
successful locations of operational sub-millimeter wave
range radiotelescopes from the astroclymatic point of
view [6] allows us to note that out of four radiotelescope
locations two are situated in the southern hemisphere
(one in the Andes and one in the Antarctic) and two in
the tropics of the northern hemisphere (in the Hawaii
and in the Indian part of Chanthang mountain plateau).
And the most notable locations of southern hemisphere
are distinguished by being more seasonally stable and by
a smaller optical thickness value than in the northern
hemisphere. According to our calculation (Figure 5) we
can note that the best location in the astroclymatic point
of view would be southern pole where monthly-average
atmospheric absorption values () are two-three times
less than, for example, for the Mauna Kea or in the
summer months for the Chajnantor.
Seasonal vertical atmospheric absorption variability is
characteristic for every sub-millimeter wave range ra-
diotelescope location, but in different degrees. In con-
nection with that, the best radio astronomical observa-
tions from November to April can be made in the South
Pole, Hanle and Mauna Kea, while from May to October
they can be made on the South Pole, Chajnnator and
Mauna Kea (Figure 5).
Mentioned alternative locations or complementary
locations (Russian Altay, Rocky Mountains in Colorado,
New Earth in Russia, Greenland, Chines Gobi desert,
Tibetan Chanthang plateau, etc.) were chosen by us for
consideration on the common physical grounds (altitude
above sea level, latitude, climate peculiarities). The com-
parison of result calculations that were carried out for
these new places allowed us to distinguish only three
astroclymatically suitable locations to compete with best
known locations.
These are: Greenland (H = 2,2 km, 80 N, 40 W), Chi-
nese part of Chanthang plateau (H = 5 km, 33 N, 94 E)
and Altay (H = 3 km, 50 N, 88 E) (Figure 6). For exam-
ple, first two locations are not inferior to and even better
than the South Pole and the Hanle from November to
April.
It is noticeable that their monthly-average atmospheric
absorption value and seasonal variability is almost iden-
tical (Figure 5 and Figure 6) between the one in the
Chajnantor (ALMA) and found location on the Green-
land (if corresponding seasons are compared for north-
ern and southern hemispheres). Moreover, calculations
Figure 5. Annual changing for the most known locations of
radiotelescopes of sub-millimetre waves.
N. V. Ruzhentsev et al. / Natural Science 2 (2010) 427-431
Copyright © 2010 SciRes. OPEN ACCESS
431
431
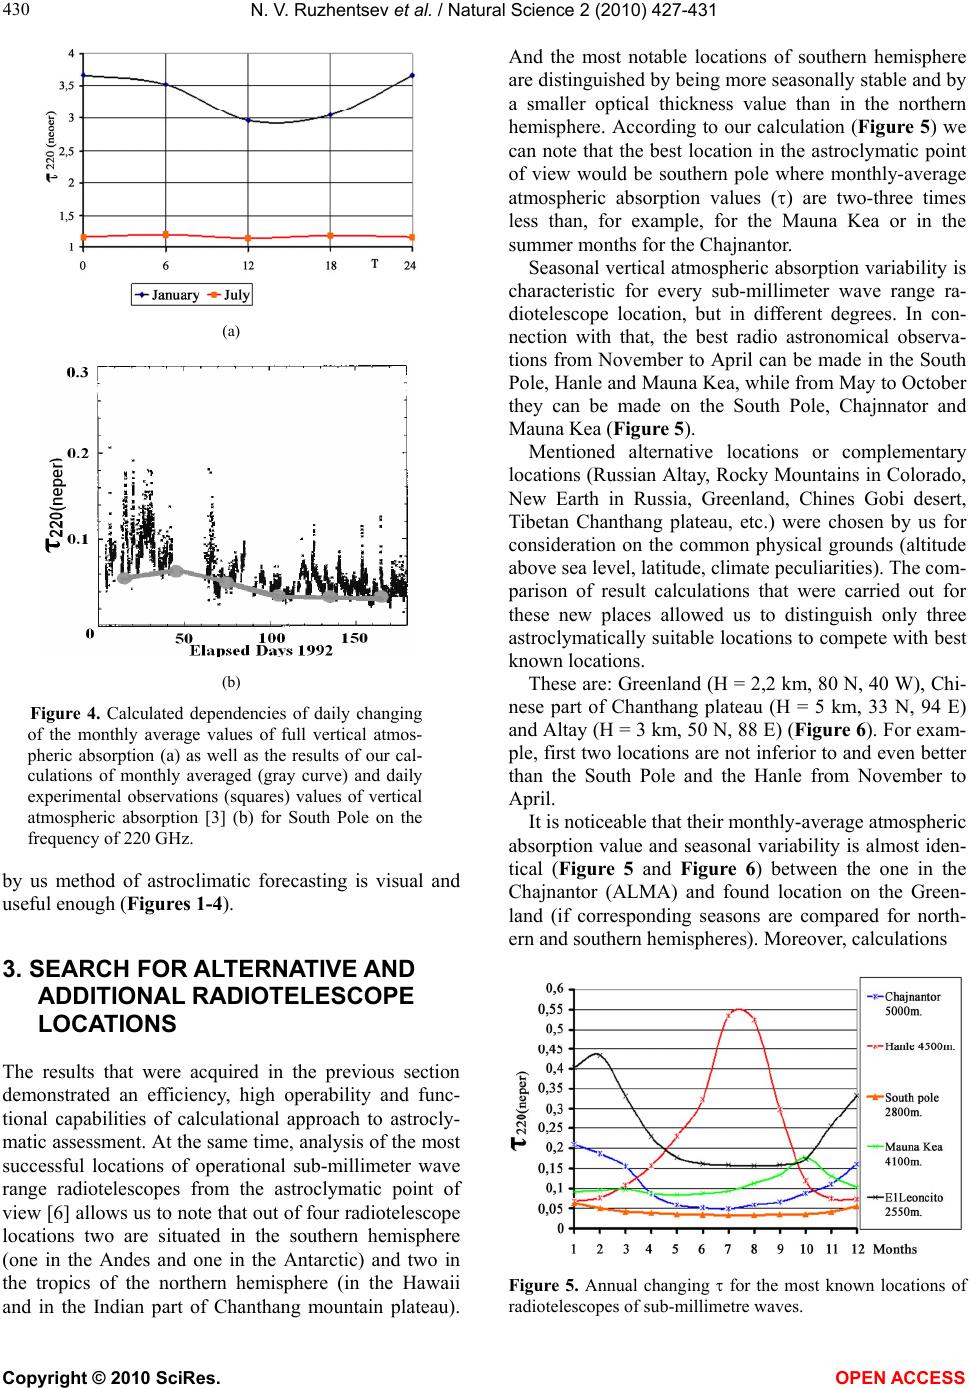
Figure 6. Annual changing for the new found locations
which are suitable for radiotelescopes of sub-millimetre waves.
show that optical atmospheric thickness daily deviation
is almost absent in the Greenland during all year while
this value reaches up to 50% in summer in the Chajnan-
tor (Figure 1(a)).
Comparing data on Figure 5 and Figure 6 allows us
to note noticeable (almost twice) astroclymatic condi-
tions increase while shifting on the Chanthang plateau
from Hanle (India, H = 4.5 km, 32 N, 78 E) to Tibetan
location (H = 5 km, 33 N, 94 E) which is situated on the
same plateau, but on the Chinese part of it. The same
situation is observed while shifting from El Leoncito
(Argentine) in the Atakama to the Chajnantor in Chile.
However, this case is also affected by the altitude dif-
ference of these locations.
4. CONCLUSIONS
Thus, for the first time is shown that usage most of
modern standard of atmosphere (designed by ESA on the
basis of the database ERA-15) in aggregate with МРМ
model of atmospheric attenuation allows to obtain a
seasonal-diurnal statistics of vertical atmospheric ab-
sorption for any item of a world. Such possibility of the
calculated method was shown as by comparison of the
original data of calculation with the experimental data of
other authors, as and by definition new astroclimatically
favourable locations of sub-millimetre radiotelescopes.
This new and previously unavailable ability to obtain
astroclymatic assessments of ensures high operability,
functional abilities increase and minimal expenditures in
comparison with the traditional approach that is based on
long-term experimental observations (which usually uses
to choose the location of the projected radiotelescope or
to specify astroclymatic assessment in the locations of
operated radiotelescopes).
REFERENCES
[1] Simon, J.E. (2003) Radford (NRAO), Conditions for
observing with the ALMA at Chajnantor. http://www. tuc.
nrao.edu/alma/site
[2] Ananthasubramanian, P.G., Yamamoto, S., Prabhu, T.P.
and Angchuk, D. (2004) Measurements of 220 GHz at-
mospheric transparency at IAO, Hanle, during 2000-
2003. Bulletin of Astronomy Society in India, 32(2), 99-
111.
[3] Richard, A., Chamberlin and Bally, J. (1994) 225-GHz
atmospheric opacity of the South Pole sky derived from
continual radiometric measurements of the sky-bright-
ness temperature. Applied Optics, 33(6), 1095-1099.
[4] Melo, A., Kaufmann, P., de Castro, C., Raulin, J., Levato,
H., Marun, A., Giuliani, J. and Pereyra, P. (2005) Sub-
millimetre-wave atmospheric transmission at El Leoncito,
Argentina Andes. IEEE Transactions, AP-53(4), 1528-
1534.
[5] Masson, C. (1990) Atmospheric opacity and water vapor.
Sub-Millimetre Array Technical Memorandum, 12(1), 10-14.
[6] http://en.wikipedia.org/wiki/Submillimetre_astronomy
[7] Mihailov, A.S. and Ruzhentsev, N.V. (2007) Features of
global allocation of atmospheric attenuation in the range
10-1000 GHz. Radiophysics and Radio Astronomy, in
Russian, 12(1), 76-83.
[8] Mihailov, A.S. and Ruzhentsev, N.V. (2009) Research of
spatial distribution of atmospheric attenuation for terri-
tory of Ukraine at millimetre-waves band. Applied Ra-
dioelectronics, in Russian, 2(1), 12-22.
[9] Ruzhentsev, N.V., Mihailov, A.S. and Shirin, A.M. (2007)
Investigations of season-diurnal dependencies of atmos-
pheric absorption with usage of model ERA-15 and its
additional testing. Proceedings of Eeleventh URSI Com-
mission F Open Symposium on Radio Waves Propagation
and Remote Sensing, Rio de Janeiro, RS3.3-1-RS3.3-5.
[10] Liebe, H.J. (1989) MPM-An atmosphere millimeter wave
propagation model. International Journal on Infrared
and Millimeter Waves, 10(6), 631-650.
[11] Martellucci, A., Rastburg, B.A., Poiares Baptista, J.P.V.
and Blarzino, G. (2003) New reference standard atmos-
pheres based on numerical weather products. Abstracts of
International Workshop-ClimDiff’2003, Fortaleza, clim.1.
[12] Riva, C., Martellucci, A., Kubista, E., Chonhuber, M. and
Luini, L. (2005) ERA-15 climatological databases for
propagation modeling. Proceedings of International Con-
ference-ClimDiff, Cleveland, 26-27 September 2005,
clim. 12.1-12.7.
[13] The Large Millimeter Telescope (LMT) site: http:www.
lmtgtm.org/site.html