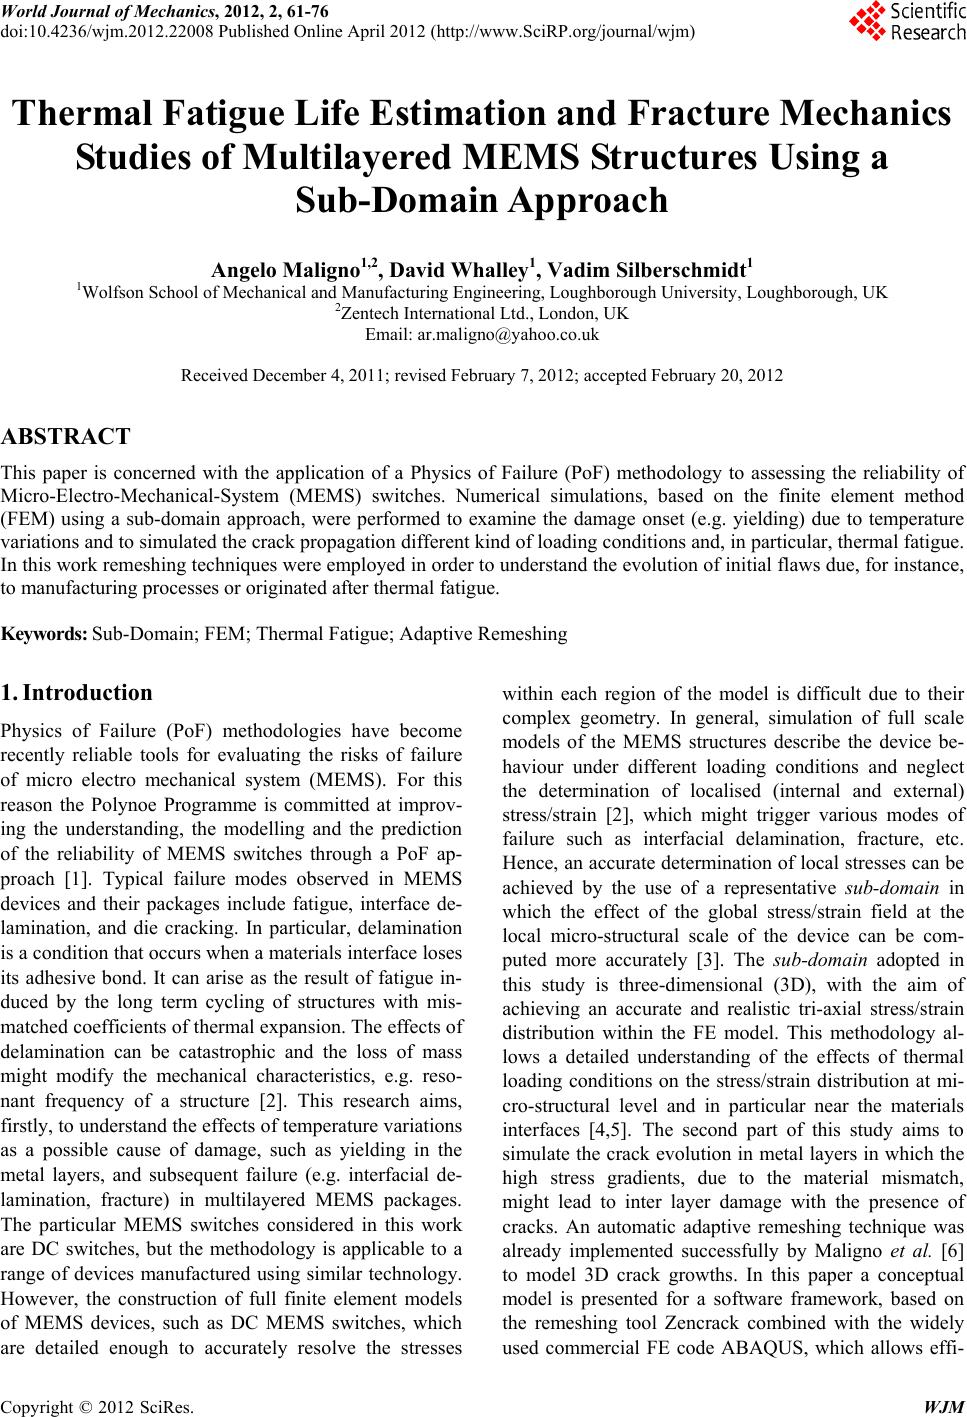
 World Journal of Mechanics, 2012, 2, 61-76 doi:10.4236/wjm.2012.22008 Published Online April 2012 (http://www.SciRP.org/journal/wjm) Thermal Fatigue Life Estimation and Fracture Mechanics Studies of Multilayered MEMS Structures Using a Sub-Domain Approach Angelo Maligno1,2, David Whalley1, Vadim Silberschmidt1 1Wolfson School of Mechanical and Manufacturing Engineering, Loughborough University, Loughborough, UK 2Zentech International Ltd., London, UK Email: ar.maligno@yahoo.co.uk Received December 4, 2011; revised February 7, 2012; accepted February 20, 2012 ABSTRACT This paper is concerned with the application of a Physics of Failure (PoF) methodology to assessing the reliability of Micro-Electro-Mechanical-System (MEMS) switches. Numerical simulations, based on the finite element method (FEM) using a sub-domain approach, were performed to examine the damage onset (e.g. yielding) due to temperature variations and to simulated the crack propagation different kind of loading conditions and, in particular, thermal fatigue. In this work remeshing techniques were employed in order to understand the evolution of initial flaws due, for instance, to manufacturing processes or originated after thermal fatigue. Keywords: Sub-Domain; FEM; Thermal Fatigue; Adaptive Remeshing 1. Introduction Physics of Failure (PoF) methodologies have become recently reliable tools for evaluating the risks of failure of micro electro mechanical system (MEMS). For this reason the Polynoe Programme is committed at improv- ing the understanding, the modelling and the prediction of the reliability of MEMS switches through a PoF ap- proach [1]. Typical failure modes observed in MEMS devices and their packages include fatigue, interface de- lamination, and die cracking. In particular, delamination is a condition that occurs when a materials interface loses its adhesive bond. It can arise as the result of fatigue in- duced by the long term cycling of structures with mis- matched coefficients of thermal expansion. The effects of delamination can be catastrophic and the loss of mass might modify the mechanical characteristics, e.g. reso- nant frequency of a structure [2]. This research aims, firstly, to understand the effects of temperature variations as a possible cause of damage, such as yielding in the metal layers, and subsequent failure (e.g. interfacial de- lamination, fracture) in multilayered MEMS packages. The particular MEMS switches considered in this work are DC switches, but the methodology is applicable to a range of devices manufactured using similar technology. However, the construction of full finite element models of MEMS devices, such as DC MEMS switches, which are detailed enough to accurately resolve the stresses within each region of the model is difficult due to their complex geometry. In general, simulation of full scale models of the MEMS structures describe the device be- haviour under different loading conditions and neglect the determination of localised (internal and external) stress/strain [2], which might trigger various modes of failure such as interfacial delamination, fracture, etc. Hence, an accurate determination of local stresses can be achieved by the use of a representative sub-domain in which the effect of the global stress/strain field at the local micro-structural scale of the device can be com- puted more accurately [3]. The sub-domain adopted in this study is three-dimensional (3D), with the aim of achieving an accurate and realistic tri-axial stress/strain distribution within the FE model. This methodology al- lows a detailed understanding of the effects of thermal loading conditions on the stress/strain distribution at mi- cro-structural level and in particular near the materials interfaces [4,5]. The second part of this study aims to simulate the crack evolution in metal layers in which the high stress gradients, due to the material mismatch, might lead to inter layer damage with the presence of cracks. An automatic adaptive remeshing technique was already implemented successfully by Maligno et al. [6] to model 3D crack growths. In this paper a conceptual model is presented for a software framework, based on the remeshing tool Zencrack combined with the widely used commercial FE code ABAQUS, which allows effi- Copyright © 2012 SciRes. WJM 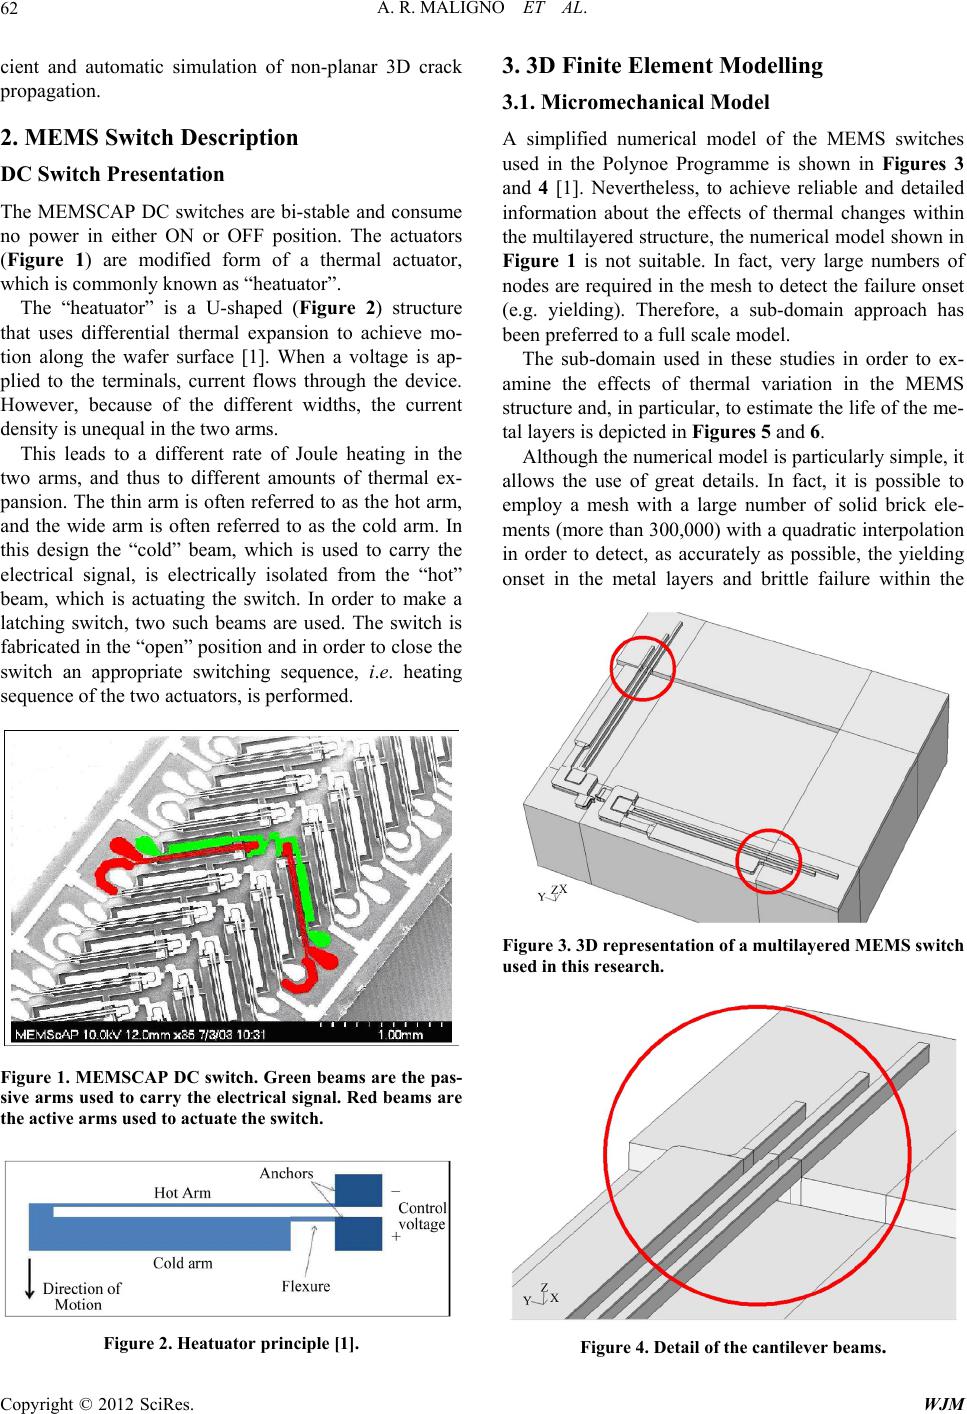 A. R. MALIGNO ET AL. 62 cient and automatic simulation of non-planar 3D crack propagation. 2. MEMS Switch Description DC Switch Presentation The MEMSCAP DC switches are bi-stable and consume no power in either ON or OFF position. The actuators (Figure 1) are modified form of a thermal actuator, which is commonly known as “heatuator”. The “heatuator” is a U-shaped (Figure 2) structure that uses differential thermal expansion to achieve mo- tion along the wafer surface [1]. When a voltage is ap- plied to the terminals, current flows through the device. However, because of the different widths, the current density is unequal in the two arms. This leads to a different rate of Joule heating in the two arms, and thus to different amounts of thermal ex- pansion. The thin arm is often referred to as the hot arm, and the wide arm is often referred to as the cold arm. In this design the “cold” beam, which is used to carry the electrical signal, is electrically isolated from the “hot” beam, which is actuating the switch. In order to make a latching switch, two such beams are used. The switch is fabricated in the “open” position and in order to close the switch an appropriate switching sequence, i.e. heating sequence of the two actuators, is performed. Figure 1. MEMSCAP DC switch. Green beams are the pas- sive arms used to carry the electrical signal. Red beams are the active arms used to actuate the switch. Figure 2. Heatuator principle [1]. 3. 3D Finite Element Modelling 3.1. Micromechanical Model A simplified numerical model of the MEMS switches used in the Polynoe Programme is shown in Figures 3 and 4 [1]. Nevertheless, to achieve reliable and detailed information about the effects of thermal changes within the multilayered structure, the numerical model shown in Figure 1 is not suitable. In fact, very large numbers of nodes are required in the mesh to detect the failure onset (e.g. yielding). Therefore, a sub-domain approach has been preferred to a full scale model. The sub-domain used in these studies in order to ex- amine the effects of thermal variation in the MEMS structure and, in particular, to estimate the life of the me- tal layers is depicted in Figures 5 and 6. Although the numerical model is particularly simple, it allows the use of great details. In fact, it is possible to employ a mesh with a large number of solid brick ele- ments (more than 300,000) with a quadratic interpolation in order to detect, as accurately as possible, the yielding onset in the metal layers and brittle failure within the Figure 3. 3D representation of a multilayered MEMS switch used in this research. Figure 4. Detail of the cantilever beams. Copyright © 2012 SciRes. WJM 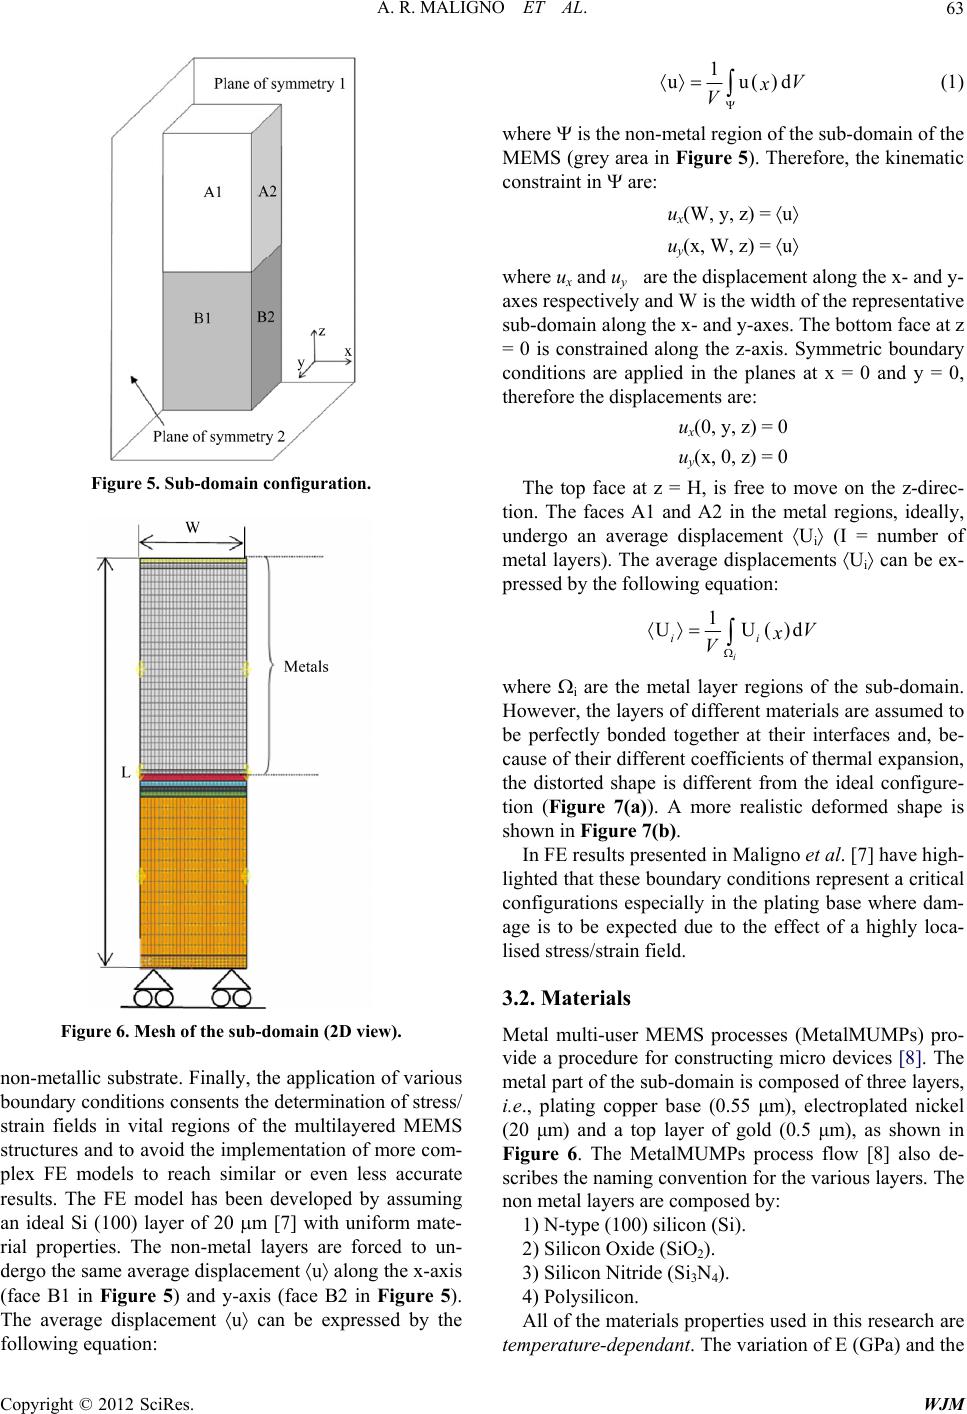 A. R. MALIGNO ET AL. 63 Figure 5. Sub-domain configuration. Figure 6. Mesh of the sub-domain (2D view). non-metallic substrate. Finally, the application of various boundary conditions consents the determination of stress/ strain fields in vital regions of the multilayered MEMS structures and to avoid the implementation of more com- plex FE models to reach similar or even less accurate results. The FE model has been developed by assuming an ideal Si (100) layer of 20 m [7] with uniform mate- rial properties. The non-metal layers are forced to un- dergo the same average displacement u along the x-axis (face B1 in Figure 5) and y-axis (face B2 in Figure 5). The average displacement u can be expressed by the following equation: 1 uud V x V (1) where is the non-metal region of the sub-domain of the MEMS (grey area in Figure 5). Therefore, the kinematic constraint in are: ux(W, y, z) = u uy(x, W, z) = u where ux and uy are the displacement along the x- and y- axes respectively and W is the width of the representative sub-domain along the x- and y-axes. The bottom face at z = 0 is constrained along the z-axis. Symmetric boundary conditions are applied in the planes at x = 0 and y = 0, therefore the displacements are: ux(0, y, z) = 0 uy(x, 0, z) = 0 The top face at z = H, is free to move on the z-direc- tion. The faces A1 and A2 in the metal regions, ideally, undergo an average displacement Ui (I = number of metal layers). The average displacements Ui can be ex- pressed by the following equation: 1 UU i ii V x V d where i are the metal layer regions of the sub-domain. However, the layers of different materials are assumed to be perfectly bonded together at their interfaces and, be- cause of their different coefficients of thermal expansion, the distorted shape is different from the ideal configure- tion (Figure 7(a)). A more realistic deformed shape is shown in Figure 7(b). In FE results presented in Maligno et al. [7] have high- lighted that these boundary conditions represent a critical configurations especially in the plating base where dam- age is to be expected due to the effect of a highly loca- lised stress/strain field. 3.2. Materials Metal multi-user MEMS processes (MetalMUMPs) pro- vide a procedure for constructing micro devices [8]. The metal part of the sub-domain is composed of three layers, i.e., plating copper base (0.55 μm), electroplated nickel (20 μm) and a top layer of gold (0.5 μm), as shown in Figure 6. The MetalMUMPs process flow [8] also de- scribes the naming convention for the various layers. The non metal layers are composed by: 1) N-type (100) silicon (Si). 2) Silicon Oxide (SiO2). 3) Silicon Nitride (Si3N4). 4) Polysilicon. All of the materials properties used in this research are temperature-dependant. The variation of E (GPa) and the Copyright © 2012 SciRes. WJM 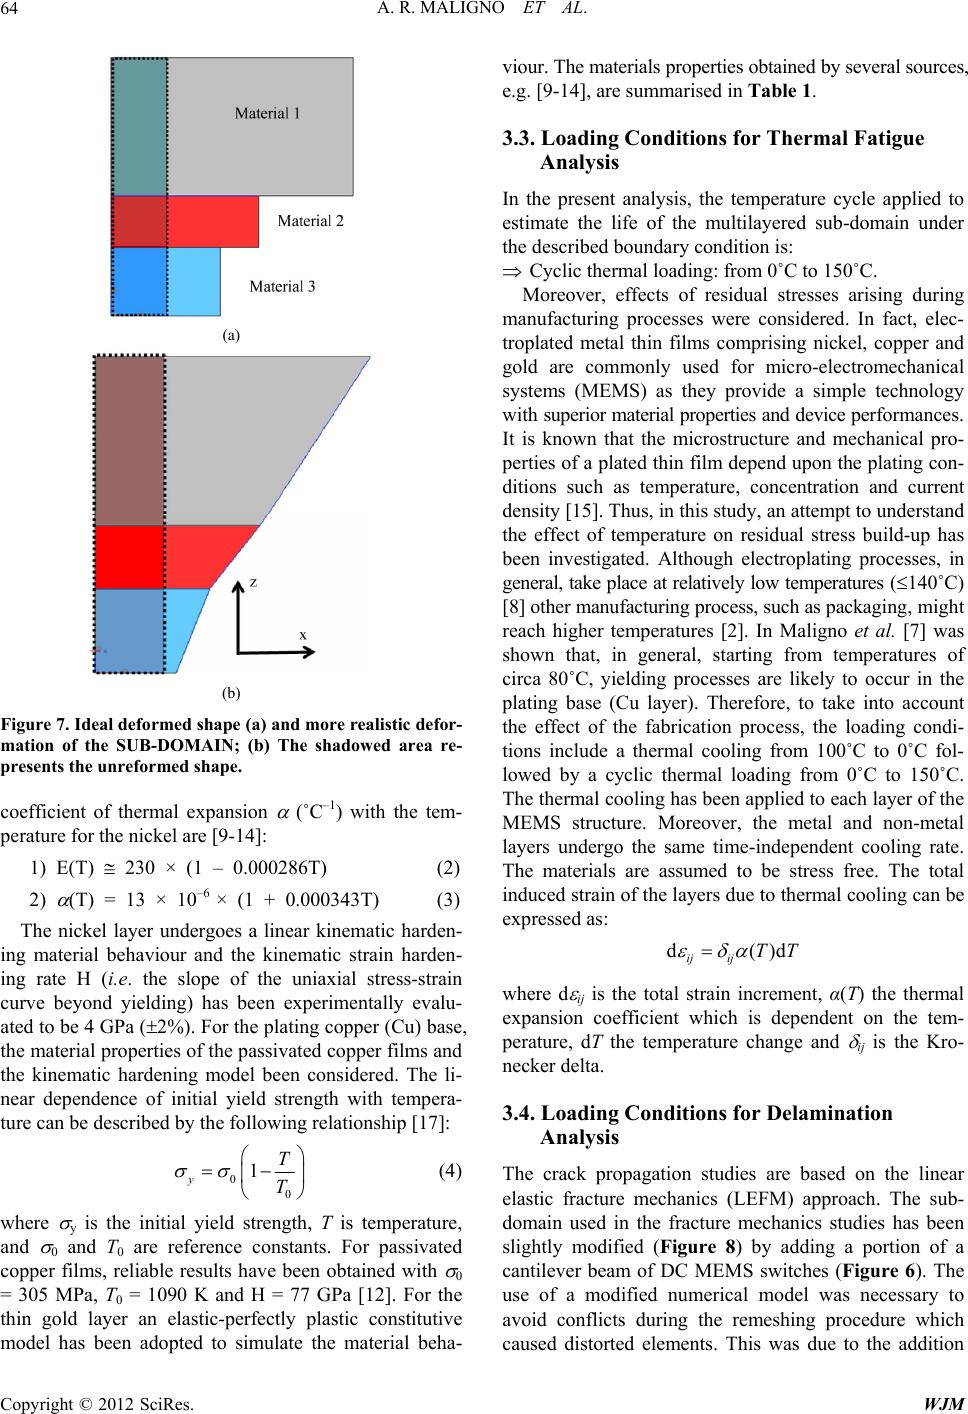 A. R. MALIGNO ET AL. 64 (a) (b) Figure 7. Ideal deformed shape (a) and more realistic defor- mation of the SUB-DOMAIN; (b) The shadowed area re- presents the unreformed shape. coefficient of thermal expansion (˚C–1) with the tem- perature for the nickel are [9-14]: 1) E(T) 230 × (1 – 0.000286T) (2) 2) (T) = 13 × 10–6 × (1 + 0.000343T) (3) The nickel layer undergoes a linear kinematic harden- ing material behaviour and the kinematic strain harden- ing rate H (i.e. the slope of the uniaxial stress-strain curve beyond yielding) has been experimentally evalu- ated to be 4 GPa (2%). For the plating copper (Cu) base, the material properties of the passivated copper films and the kinematic hardening model been considered. The li- near dependence of initial yield strength with tempera- ture can be described by the following relationship [17]: 0 0 1 y T T d (4) where y is the initial yield strength, T is temperature, and 0 and T0 are reference constants. For passivated copper films, reliable results have been obtained with 0 = 305 MPa, T0 = 1090 K and H = 77 GPa [12]. For the thin gold layer an elastic-perfectly plastic constitutive model has been adopted to simulate the material beha- viour. The materials properties obtained by several sources, e.g. [9-14], are summarised in Table 1. 3.3. Loading Conditions for Thermal Fatigue Analysis In the present analysis, the temperature cycle applied to estimate the life of the multilayered sub-domain under the described boundary condition is: Cyclic thermal loading: from 0˚C to 150˚C. Moreover, effects of residual stresses arising during manufacturing processes were considered. In fact, elec- troplated metal thin films comprising nickel, copper and gold are commonly used for micro-electromechanical systems (MEMS) as they provide a simple technology with superior material properties and device performances. It is known that the microstructure and mechanical pro- perties of a plated thin film depend upon the plating con- ditions such as temperature, concentration and current density [15]. Thus, in this study, an attempt to understand the effect of temperature on residual stress build-up has been investigated. Although electroplating processes, in general, take place at relatively low temperatures (140˚C) [8] other manufacturing process, such as packaging, might reach higher temperatures [2]. In Maligno et al. [7] was shown that, in general, starting from temperatures of circa 80˚C, yielding processes are likely to occur in the plating base (Cu layer). Therefore, to take into account the effect of the fabrication process, the loading condi- tions include a thermal cooling from 100˚C to 0˚C fol- lowed by a cyclic thermal loading from 0˚C to 150˚C. The thermal cooling has been applied to each layer of the MEMS structure. Moreover, the metal and non-metal layers undergo the same time-independent cooling rate. The materials are assumed to be stress free. The total induced strain of the layers due to thermal cooling can be expressed as: d() ijij TT where d ij is the total strain increment, α(T) the thermal expansion coefficient which is dependent on the tem- perature, dT the temperature change and ij is the Kro- necker delta. 3.4. Loading Conditions for Delamination Analysis The crack propagation studies are based on the linear elastic fracture mechanics (LEFM) approach. The sub- domain used in the fracture mechanics studies has been slightly modified (Figure 8) by adding a portion of a cantilever beam of DC MEMS switches (Figure 6). The use of a modified numerical model was necessary to avoid conflicts during the remeshing procedure which caused distorted elements. This was due to the addition Copyright © 2012 SciRes. WJM 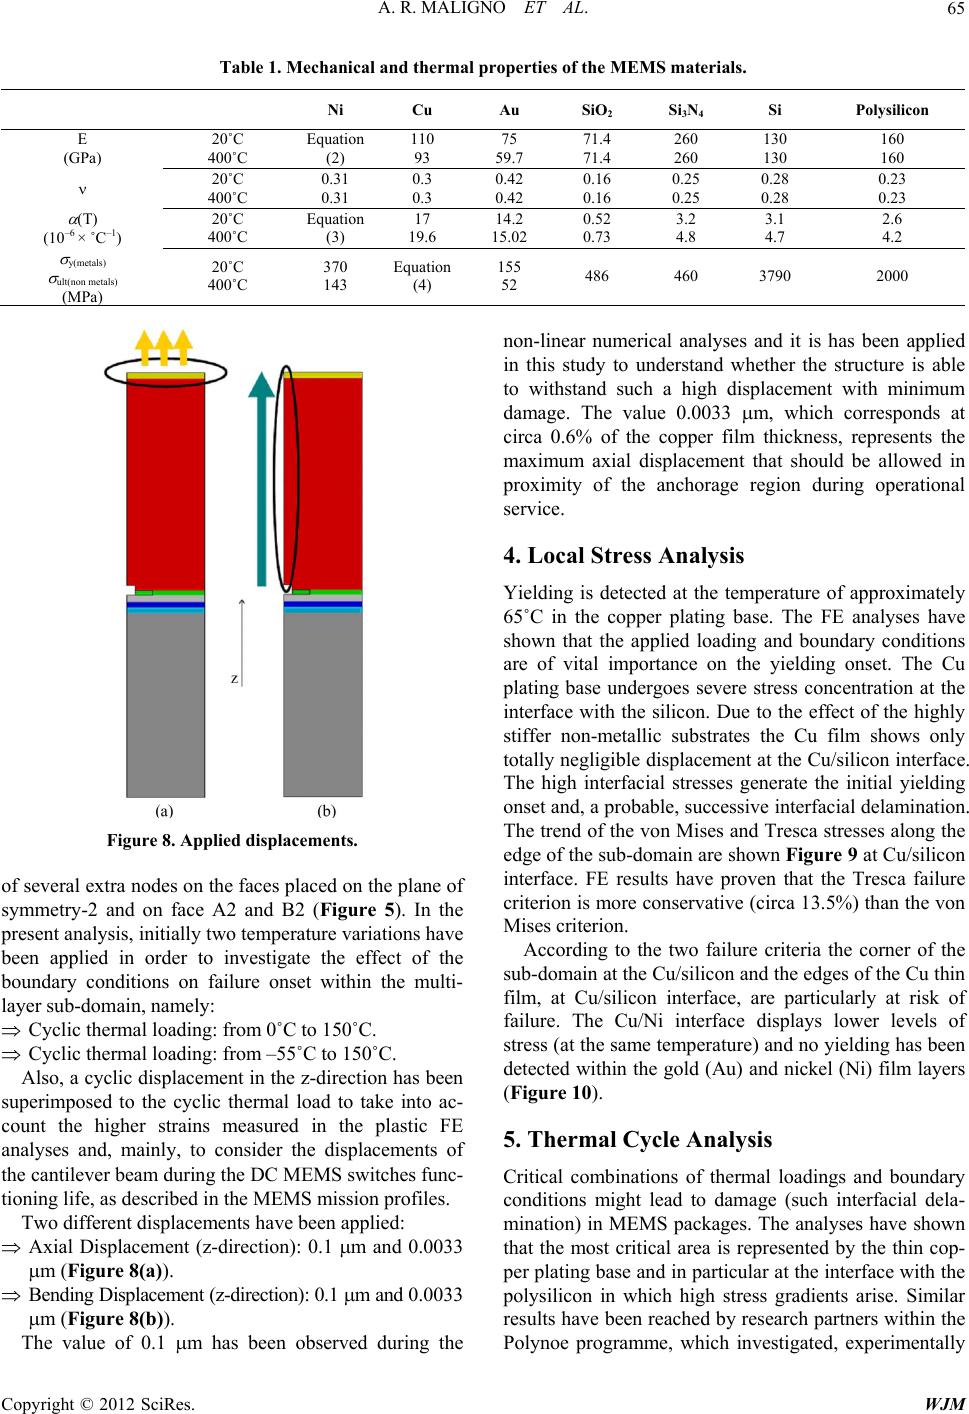 A. R. MALIGNO ET AL. Copyright © 2012 SciRes. WJM 65 Table 1. Mechanical and thermal properties of the MEMS materials. Ni Cu Au SiO2 Si3N4 Si Polysilicon E (GPa) 20˚C 400˚C Equation (2) 110 93 75 59.7 71.4 71.4 260 260 130 130 160 160 20˚C 400˚C 0.31 0.31 0.3 0.3 0.42 0.42 0.16 0.16 0.25 0.25 0.28 0.28 0.23 0.23 (T) (10–6 × ˚C–1) 20˚C 400˚C Equation (3) 17 19.6 14.2 15.02 0.52 0.73 3.2 4.8 3.1 4.7 2.6 4.2 y(metals) ult(non metals) MPa 20˚C 400˚C 370 143 Equation (4) 155 52 486 460 3790 2000 Figure 8. Applied displacements. of several extra nodes on the faces placed on the plane of symmetry-2 and on face A2 and B2 (Figure 5). In the present analysis, initially two temperature variations have been applied in order to investigate the effect of the boundary conditions on failure onset within the multi- layer sub-domain, namely: Cyclic thermal loading: from 0˚C to 150˚C. Cyclic thermal loading: from –55˚C to 150˚C. Also, a cyclic displacement in the z-direction has been superimposed to the cyclic thermal load to take into ac- count the higher strains measured in the plastic FE analyses and, mainly, to consider the displacements of the cantilever beam during the DC MEMS switches func- tioning life, as described in the MEMS mission profiles. Two different displacements have been applied: Axial Displacement (z-direction): 0.1 m and 0.0033 m (Figure 8(a)). Bending Displacement (z-direction): 0.1 m and 0.0033 m (Figure 8(b)). The value of 0.1 m has been observed during the non-linear numerical analyses and it is has been applied in this study to understand whether the structure is able to withstand such a high displacement with minimum damage. The value 0.0033 m, which corresponds at circa 0.6% of the copper film thickness, represents the maximum axial displacement that should be allowed in proximity of the anchorage region during operational service. 4. Local Stress Analysis Yielding is detected at the temperature of approximately 65˚C in the copper plating base. The FE analyses have shown that the applied loading and boundary conditions are of vital importance on the yielding onset. The Cu plating base undergoes severe stress concentration at the interface with the silicon. Due to the effect of the highly stiffer non-metallic substrates the Cu film shows only totally negligible displacement at the Cu/silicon interface. The high interfacial stresses generate the initial yielding onset and, a probable, successive interfacial delamination. The trend of the von Mises and Tresca stresses along the edge of the sub-domain are shown Figure 9 at Cu/silicon interface. FE results have proven that the Tresca failure criterion is more conservative (circa 13.5%) than the von Mises criterion. According to the two failure criteria the corner of the sub-domain at the Cu/silicon and the edges of the Cu thin film, at Cu/silicon interface, are particularly at risk of failure. The Cu/Ni interface displays lower levels of stress (at the same temperature) and no yielding has been detected within the gold (Au) and nickel (Ni) film layers (Figure 10). 5. Thermal Cycle Analysis Critical combinations of thermal loadings and boundary conditions might lead to damage (such interfacial dela- mination) in MEMS packages. The analyses have shown that the most critical area is represented by the thin cop- per plating base and in particular at the interface with the polysilicon in which high stress gradients arise. Similar results have been reached by research partners within the Polynoe programme, which investigated, experimentally 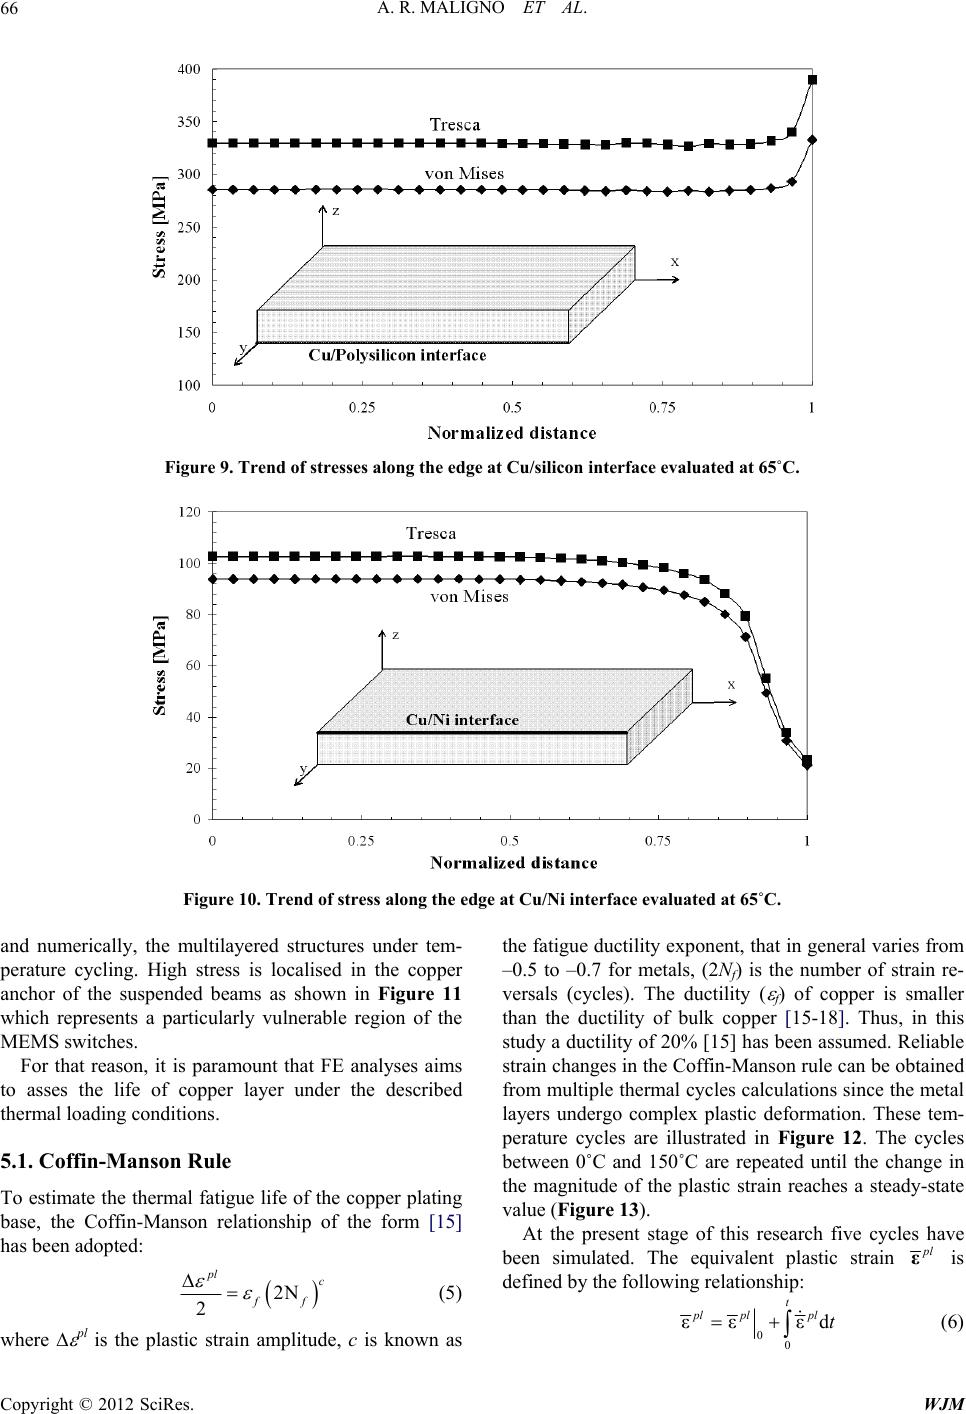 A. R. MALIGNO ET AL. 66 Figure 9. Trend of stresses along the edge at Cu/silicon interface evaluated at 65˚C. Figure 10. Trend of stress along the edge at Cu/Ni interface evaluated at 65˚C. and numerically, the multilayered structures under tem- perature cycling. High stress is localised in the copper anchor of the suspended beams as shown in Figure 11 which represents a particularly vulnerable region of the MEMS switches. For that reason, it is paramount that FE analyses aims to asses the life of copper layer under the described thermal loading conditions. 5.1. Coffin-Manson Rule To estimate the thermal fatigue life of the copper plating base, the Coffin-Manson relationship of the form [15] has been adopted: 2N 2 pl c ff (5) where pl is the plastic strain amplitude, c is known as the fatigue ductility exponent, that in general varies from –0.5 to –0.7 for metals, (2Nf) is the number of strain re- versals (cycles). The ductility ( f) of copper is smaller than the ductility of bulk copper [15-18]. Thus, in this study a ductility of 20% [15] has been assumed. Reliable strain changes in the Coffin-Manson rule can be obtained from multiple thermal cycles calculations since the metal layers undergo complex plastic deformation. These tem- perature cycles are illustrated in Figure 12. The cycles between 0˚C and 150˚C are repeated until the change in the magnitude of the plastic strain reaches a steady-state value (Figure 13). At the present stage of this research five cycles have been simulated. The equivalent plastic strain l ε is defined by the following relationship: 00 εε εd t plplpl t (6) Copyright © 2012 SciRes. WJM 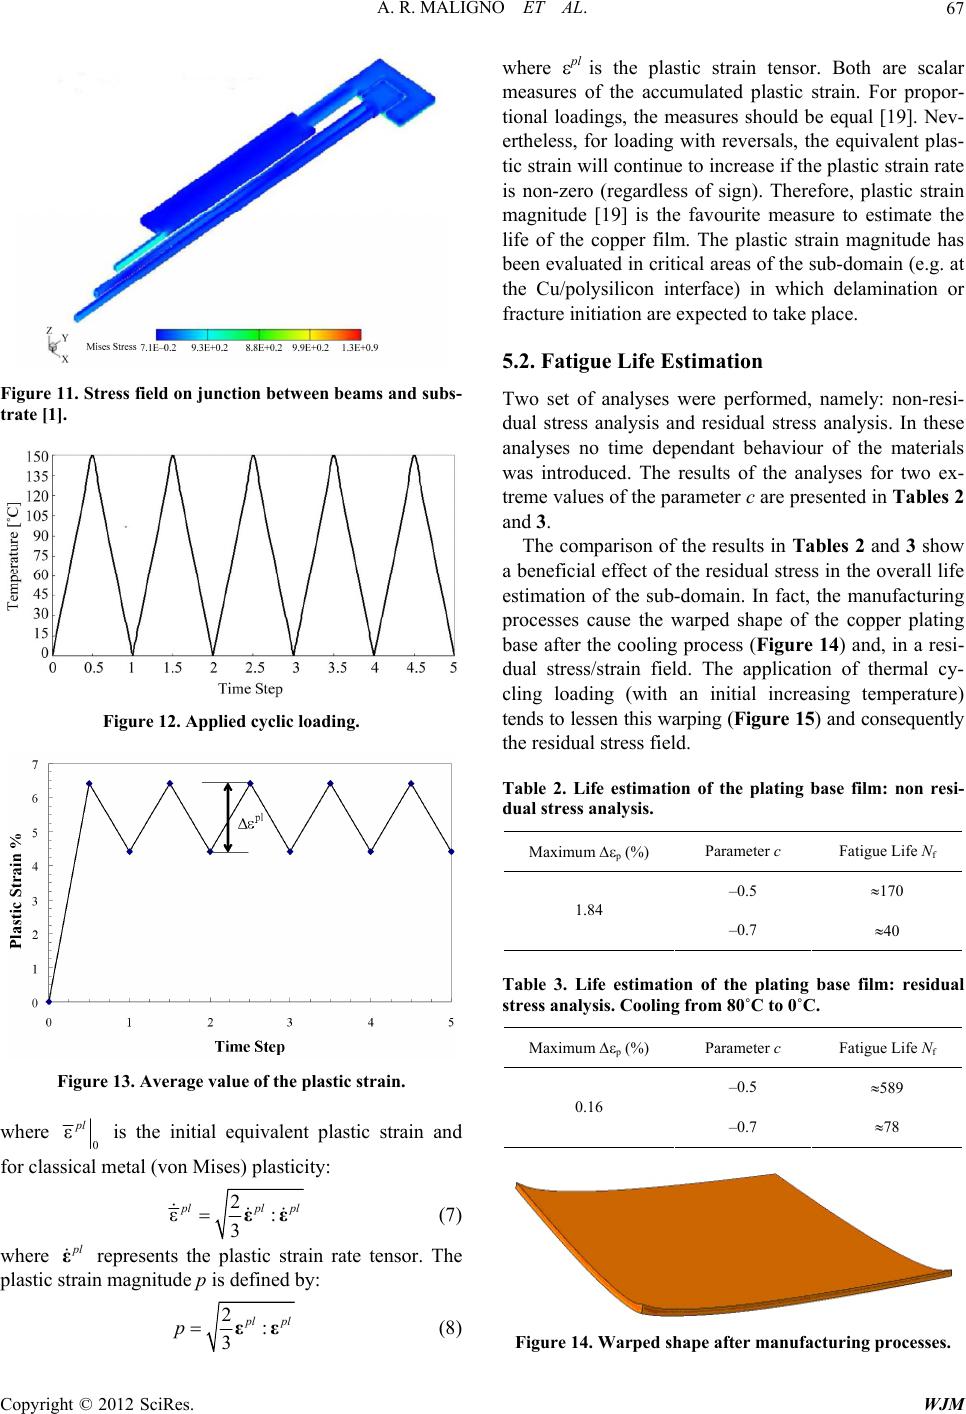 A. R. MALIGNO ET AL. 67 Figure 11. Stress field on junction between beams and subs- trate [1]. Figure 12. Applied cyclic loading. Figure 13. Average value of the plastic strain. where 0 εpl is the initial equivalent plastic strain and for classical metal (von Mises) plasticity: 2 ε: 3 lpl εε pl (7) where l ε represents the plastic strain rate tensor. The plastic strain magnitude p is defined by: 2: 3 lpl pεε (8) where pl is the plastic strain tensor. Both are scalar measures of the accumulated plastic strain. For propor- tional loadings, the measures should be equal [19]. Nev- ertheless, for loading with reversals, the equivalent plas- tic strain will continue to increase if the plastic strain rate is non-zero (regardless of sign). Therefore, plastic strain magnitude [19] is the favourite measure to estimate the life of the copper film. The plastic strain magnitude has been evaluated in critical areas of the sub-domain (e.g. at the Cu/polysilicon interface) in which delamination or fracture initiation are expected to take place. 5.2. Fatigue Life Estimation Two set of analyses were performed, namely: non-resi- dual stress analysis and residual stress analysis. In these analyses no time dependant behaviour of the materials was introduced. The results of the analyses for two ex- treme values of the parameter c are presented in Tables 2 and 3. The comparison of the results in Tables 2 and 3 show a beneficial effect of the residual stress in the overall life estimation of the sub-domain. In fact, the manufacturing processes cause the warped shape of the copper plating base after the cooling process (Figure 14) and, in a resi- dual stress/strain field. The application of thermal cy- cling loading (with an initial increasing temperature) tends to lessen this warping (Figure 15) and consequently the residual stress field. Table 2. Life estimation of the plating base film: non resi- dual stress analysis. Maximum p (%) Parameter c Fatigue Life Nf –0.5 170 1.84 –0.7 40 Table 3. Life estimation of the plating base film: residual stress analysis. Cooling from 80˚C to 0˚C. Maximum p (%) Parameter c Fatigue Life Nf –0.5 589 0.16 –0.7 78 Figure 14. Warped shape after manufacturing processes. Copyright © 2012 SciRes. WJM  A. R. MALIGNO ET AL. 68 Figure 15. Reduced deformed shape at increasing tempera- tures. 6. FE Modelling of Automated Crack Growth In the delamination mechanics theory applied to film and multi-layers, of particular interest are the Mode-I crack- ing in films/layers driven by stress gradients. Therefore, the evaluated high stress gradient present in the copper plating base are likely trigger a Mode-I crack in the thin layer which could propagate within the structure and, eventually, lead to the drastic failure of the MEMS de- vices. The purpose of this research was to understand the crack behaviour in thin films such as the copper plating base and, mainly, to understand the effect of the tem- perature variation on the crack evolution. In order to si- mulate the fatigue crack propagation in multi-layered MEMS structures, the software Zencrack in combination with the FE code ABAQUS was used. In this research the software has been modified by introducing new algo- rithms to describe, as accurately as possible, crack evolu- tion in thin films and to avoid mesh and structural distor- tion during the remeshing. The interfacial fracture tough- ness of the copper has been adopted as the reference pa- rameter to evaluate the catastrophic failure (e.g. delami- nation) of the copper film. The interfacial fracture tough- ness of the copper, used in this study, ranges from 0.4 to 2.61 J/m2 [20]. These values take into account the mate- rial properties of copper at micro-level and, in particular, different grain sizes. 6.1. Crack Growth Criteria In order to predict linear elastic fracture mechanics (LEFM) crack growth using FE method, three basic pa- rameters are required: stress intensity factors (SIF), crack propagation direction (CPD) and crack growth material models, for example, the Paris equation [21]. There are several approaches to calculating SIFs such as: the crack tip opening displacement (CTOD) approach [22], the crack tip stress field approach [23] and the SIF extraction method from J-integral [24]. In the present work the SIFs are extracted from the J-integral using the method of Asaro and Shih [25], based on the following equation: 22 2 11 2 II III JGK KK EG (9) where 2 1 EE for three-dimensional problems. The quarter-point node technique is used by Zencrack to model the crack-tip singularity. Under mixed mode con- ditions it is necessary to introduce an equivalent stress intensity factor, Keq, considering Mode-I, II and III si- multaneously. Several formulae have been proposed for Keq and the most commonly used expression is: 22 2 1 eqI IIIII KK K (10) In order to determine new crack front positions, the CPD must be computed. There are several CPD criteria available: the minimum strain density criterion, the maxi- mum circumferential stress criterion and the maximum energy release criterion. The maximum energy release rate criterion or the G-criterion has been adopted in these investigations. The G-criterion states that a crack will grow in the direction of maximum energy release rate. The CPD, = o, is then determined by: 2 d0, d d0. d o o G G (11) Numerous numerical techniques can be used to com- pute G such as the path independent J-integral [24,25] and the virtual crack extension (VCE) method [26,27]. The VCE method, which was already successfully em- ployed in Maligno et al. [6], was also applied in this re- search. Virtual Crack Extension Directions To determine the crack direction a “normal plane” can be defined at any node on a 3D crack front. This is a plane that is orthogonal to the crack front tangent at the node. A series of virtual crack extensions in the normal plane will produce a distribution of energy release rates. This is shown schematically in Figure 16 as energy release rate values G1 to G7. At some angle to the local crack plane the energy release rate will be a maximum. Gmax denotes this maximum energy release rate. The value of Gmax and the corresponding angle is calculated for use in crack growth prediction. 6.2. Adaptive Remeshing Method A crucial problem in 3D fracture mechanics is related to mesh generation for the FE analysis. The approach that has been adopted in this research is the use of a “sub modeling” strategy which models the details of the crack region. In Figure 17 is presented the use of the “sub modeling” methodology in generating a cracked mesh from a user-supplied intact component. The method works by replacing one or more elements in the un- cracked mesh by “crack-blocks” that contain sections of Copyright © 2012 SciRes. WJM 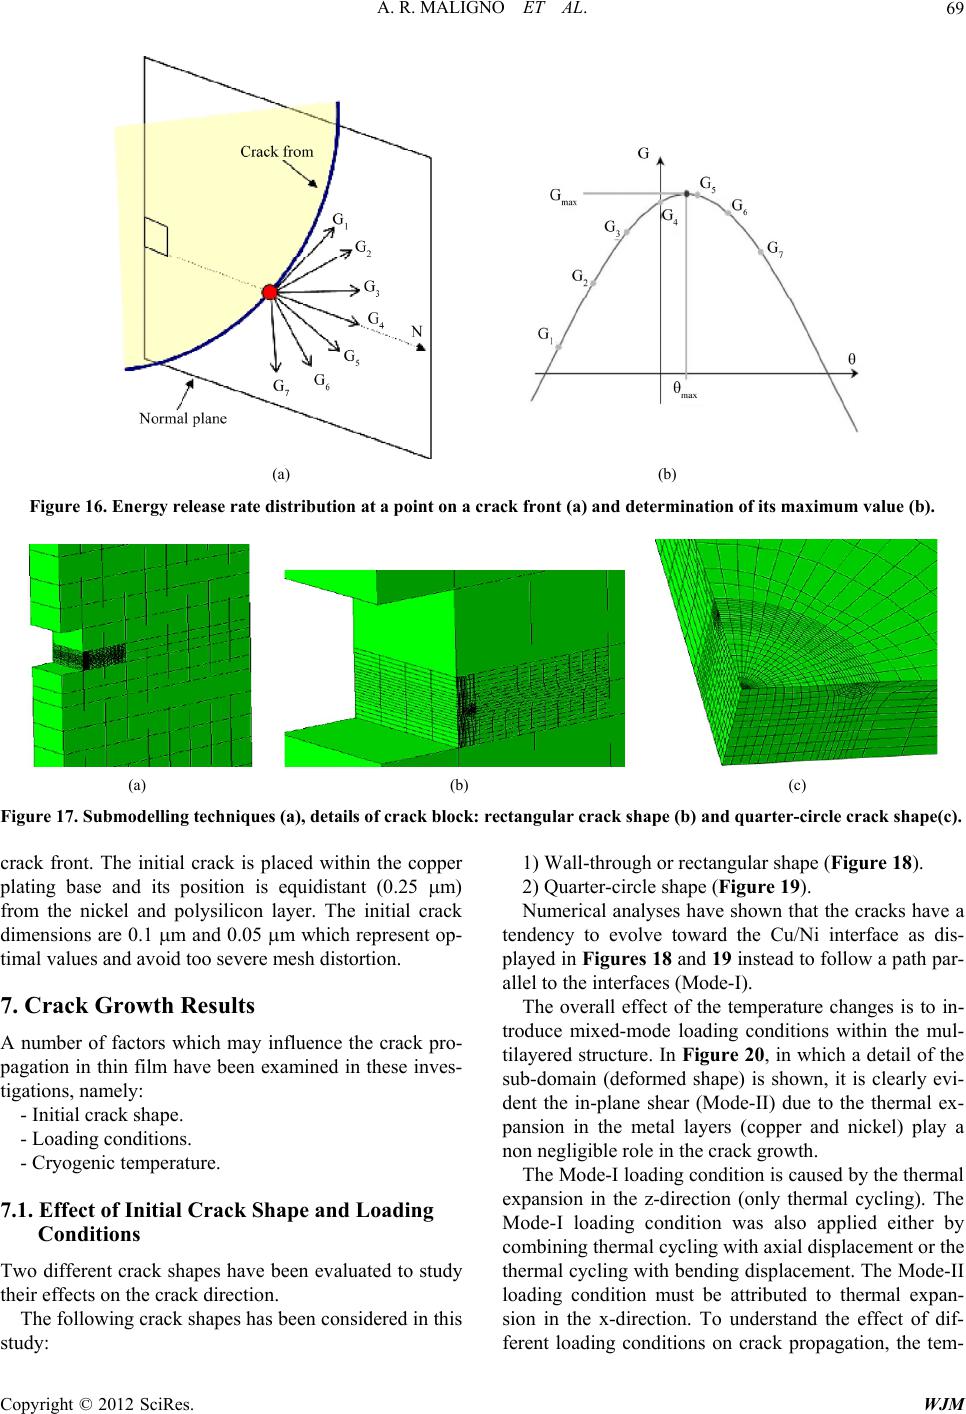 A. R. MALIGNO ET AL. Copyright © 2012 SciRes. WJM 69 (a) (b) Figure 16. Energy release rate distribution at a point on a crack front (a) and determination of its maximum value (b). (a) (b) (c) Figure 17. Submodelling techniques (a), details of crack block: rectangular crack shape (b) and quarter-circle crack shape(c). 1) Wall-through or rectangular shape (Figure 18). crack front. The initial crack is placed within the copper plating base and its position is equidistant (0.25 m) from the nickel and polysilicon layer. The initial crack dimensions are 0.1 m and 0.05 m which represent op- timal values and avoid too severe mesh distortion. 2) Quarter-circle shape (Figure 19). Numerical analyses have shown that the cracks have a tendency to evolve toward the Cu/Ni interface as dis- played in Figures 18 and 19 instead to follow a path par- allel to the interfaces (Mode-I). 7. Crack Growth Results The overall effect of the temperature changes is to in- troduce mixed-mode loading conditions within the mul- tilayered structure. In Figure 20, in which a detail of the sub-domain (deformed shape) is shown, it is clearly evi- dent the in-plane shear (Mode-II) due to the thermal ex- pansion in the metal layers (copper and nickel) play a non negligible role in the crack growth. A number of factors which may influence the crack pro- pagation in thin film have been examined in these inves- tigations, namely: - Initial crack shape. - Loading conditions. - Cryogenic temperature. The Mode-I loading condition is caused by the thermal expansion in the z-direction (only thermal cycling). The Mode-I loading condition was also applied either by combining thermal cycling with axial displacement or the thermal cycling with bending displacement. The Mode-II loading condition must be attributed to thermal expan- sion in the x-direction. To understand the effect of dif- ferent loading conditions on crack propagation, the tem- 7.1. Effect of Initial Crack Shape and Loading Conditions Two different crack shapes have been evaluated to study their effects on the crack direction. The following crack shapes has been considered in this study: 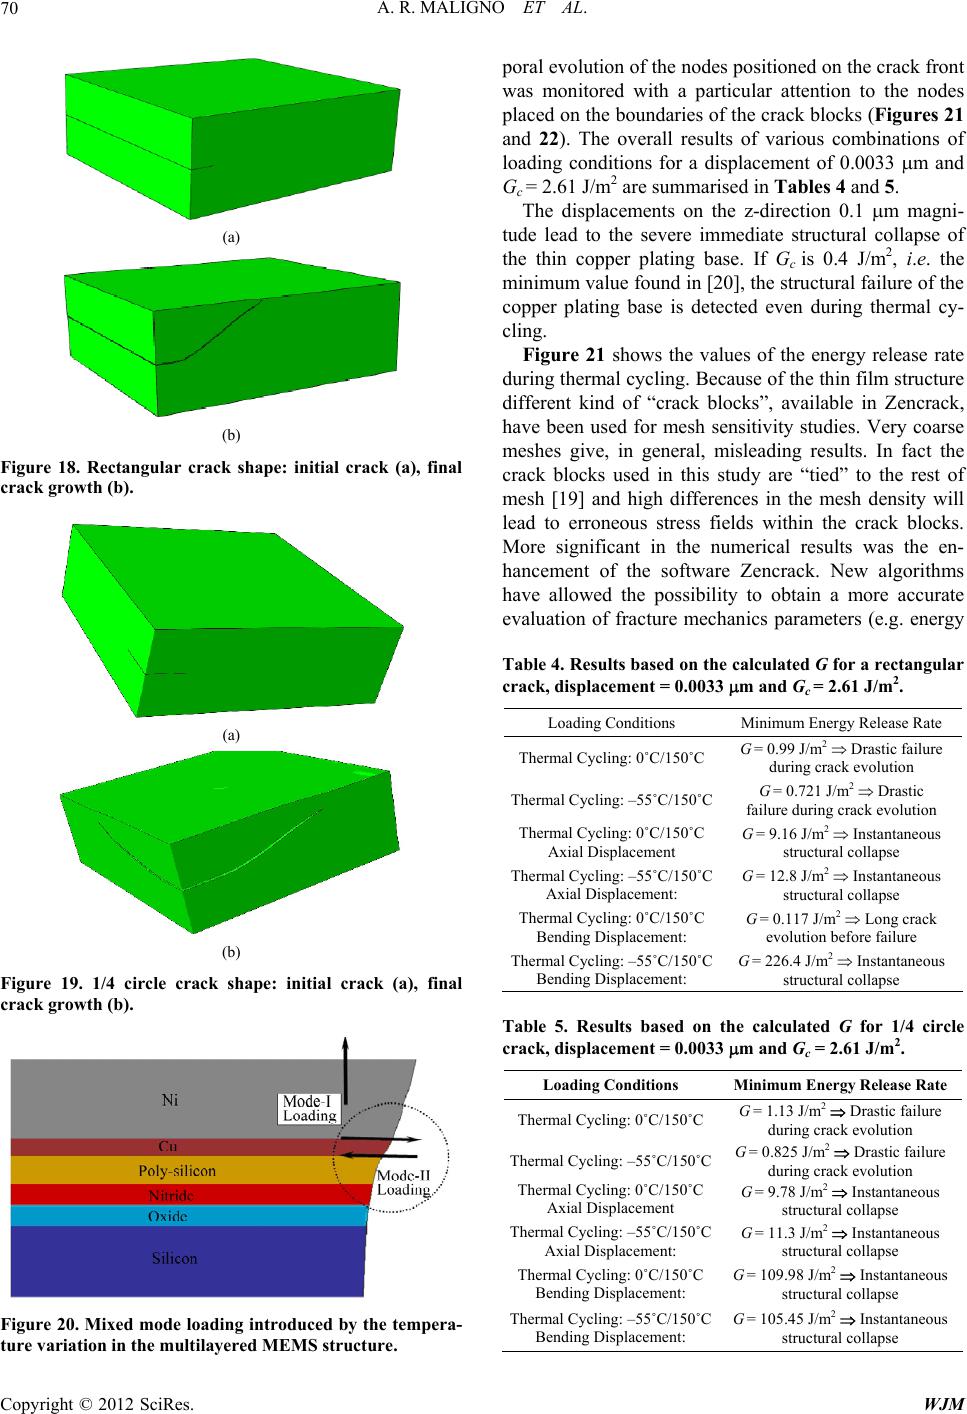 A. R. MALIGNO ET AL. 70 (a) (b) Figure 18. Rectangular crack shape: initial crack (a), final crack growth (b). (a) (b) Figure 19. 1/4 circle crack shape: initial crack (a), final crack growth (b). Figure 20. Mixed mode loading introduced by the tempera- ture variation in the multilayered MEMS structure. poral evolution of the nodes positioned on the crack front was monitored with a particular attention to the nodes placed on the boundaries of the crack blocks (Figures 21 and 22). The overall results of various combinations of loading conditions for a displacement of 0.0033 m and Gc = 2.61 J/m2 are summarised in Tables 4 and 5. The displacements on the z-direction 0.1 m magni- tude lead to the severe immediate structural collapse of the thin copper plating base. If Gc is 0.4 J/m2, i.e. the minimum value found in [20], the structural failure of the copper plating base is detected even during thermal cy- cling. Figure 21 shows the values of the energy release rate during thermal cycling. Because of the thin film structure different kind of “crack blocks”, available in Zencrack, have been used for mesh sensitivity studies. Very coarse meshes give, in general, misleading results. In fact the crack blocks used in this study are “tied” to the rest of mesh [19] and high differences in the mesh density will lead to erroneous stress fields within the crack blocks. More significant in the numerical results was the en- hancement of the software Zencrack. New algorithms have allowed the possibility to obtain a more accurate evaluation of fracture mechanics parameters (e.g. energy Table 4. Results based on the calculated G for a rectangular crack, displacement = 0.0033 m and Gc = 2.61 J/m2. Loading Conditions Minimum Energy Release Rate Thermal Cycling: 0˚C/150˚CG = 0.99 J/m2 Drastic failure during crack evolution Thermal Cycling: –55˚C/150˚CG = 0.721 J/m2 Drastic failure during crack evolution Thermal Cycling: 0˚C/150˚C Axial Displacement G = 9.16 J/m2 Instantaneous structural collapse Thermal Cycling: –55˚C/150˚C Axial Displacement: G = 12.8 J/m2 Instantaneous structural collapse Thermal Cycling: 0˚C/150˚C Bending Displacement: G = 0.117 J/m2 Long crack evolution before failure Thermal Cycling: –55˚C/150˚C Bending Displacement: G = 226.4 J/m2 Instantaneous structural collapse Table 5. Results based on the calculated G for 1/4 circle crack, displacement = 0.0033 m and Gc = 2.61 J/m2. Loading Conditions Minimum Energy Release Rate Thermal Cycling: 0˚C/150˚CG = 1.13 J/m2 Drastic failure during crack evolution Thermal Cycling: –55˚C/150˚CG = 0.825 J/m2 Drastic failure during crack evolution Thermal Cycling: 0˚C/150˚C Axial Displacement G = 9.78 J/m2 Instantaneous structural collapse Thermal Cycling: –55˚C/150˚C Axial Displacement: G = 11.3 J/m2 Instantaneous structural collapse Thermal Cycling: 0˚C/150˚C Bending Displacement: G = 109.98 J/m2 Instantaneous structural collapse Thermal Cycling: –55˚C/150˚C Bending Displacement: G = 105.45 J/m2 Instantaneous structural collapse Copyright © 2012 SciRes. WJM 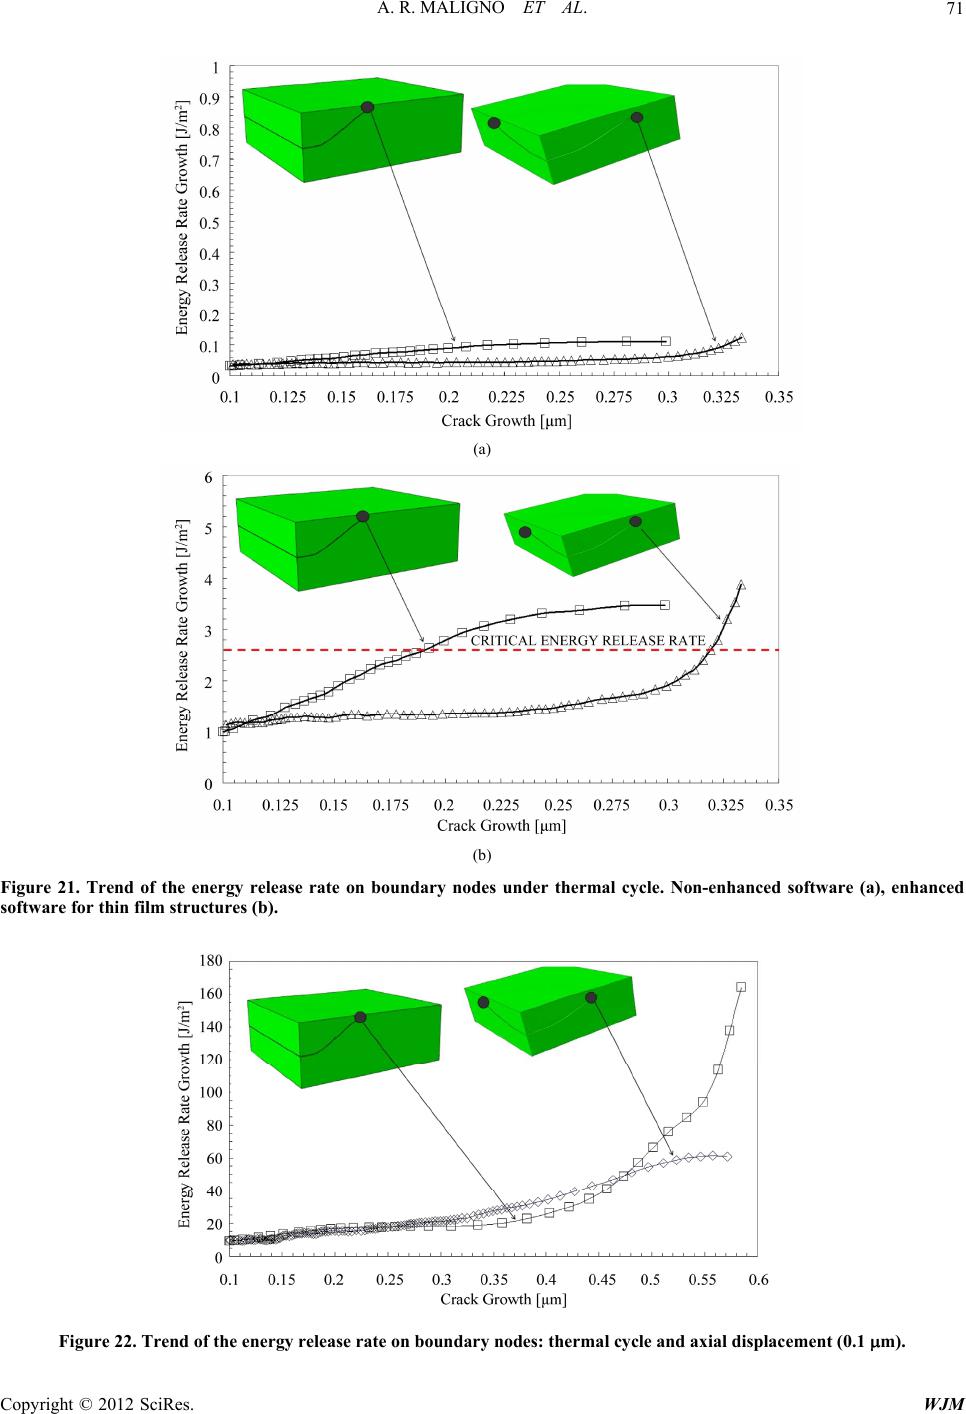 A. R. MALIGNO ET AL. Copyright © 2012 SciRes. WJM 71 (a) (b) Figure 21. Trend of the energy release rate on boundary nodes under thermal cycle. Non-enhanced software (a), enhanced software for thin film structures (b). Figure 22. Trend of the energy release rate on boundary nodes: thermal cycle and axial displacement (0.1 m). 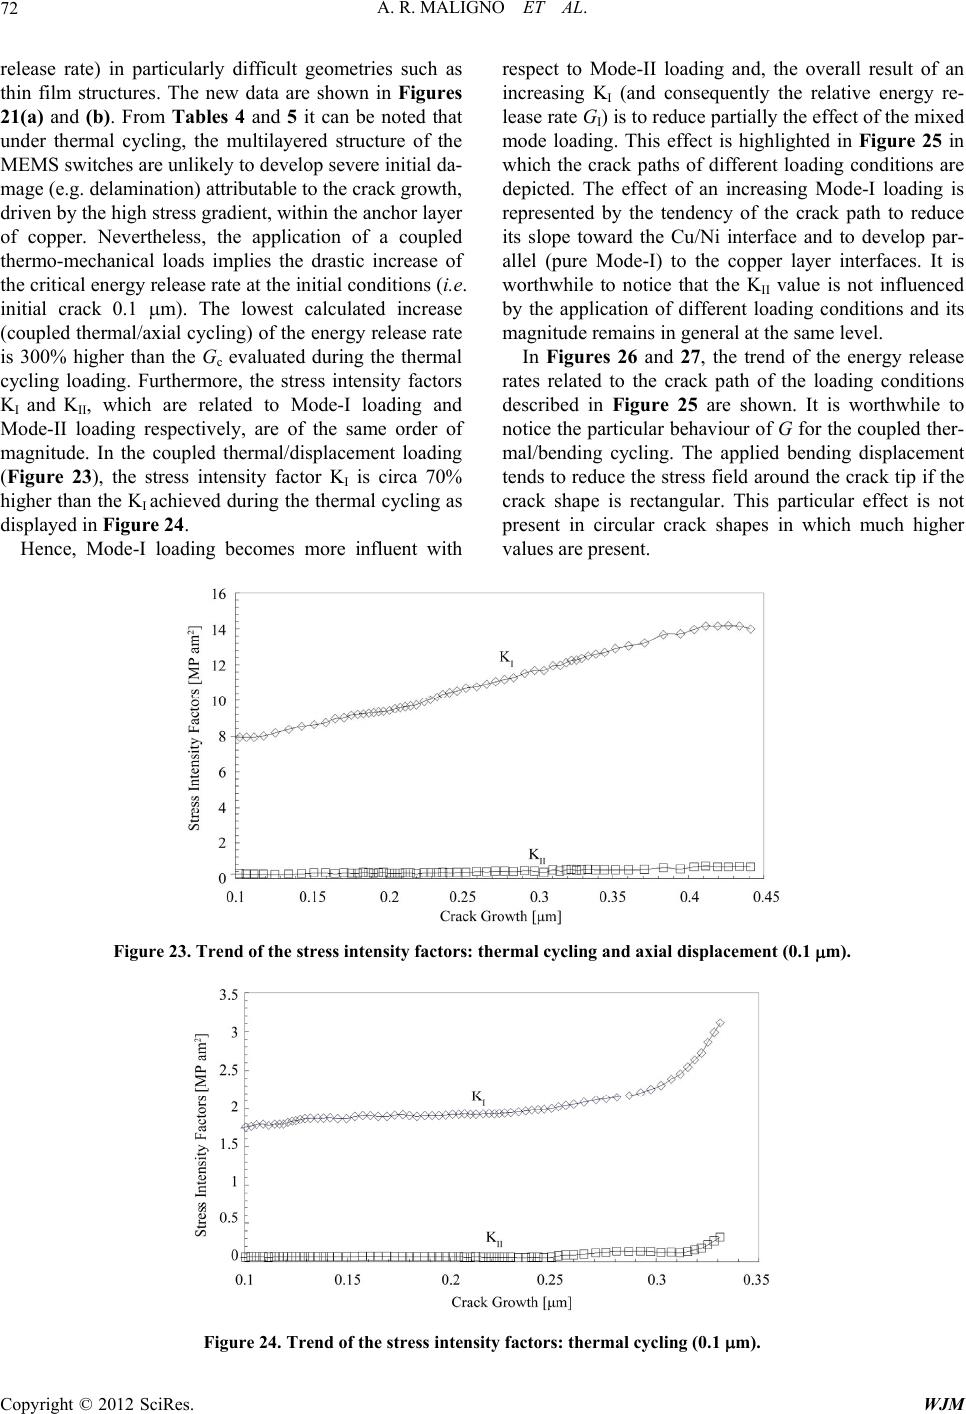 A. R. MALIGNO ET AL. 72 release rate) in particularly difficult geometries such as thin film structures. The new data are shown in Figures 21(a) and (b). From Tables 4 and 5 it can be noted that under thermal cycling, the multilayered structure of the MEMS switches are unlikely to develop severe initial da- mage (e.g. delamination) attributable to the crack growth, driven by the high stress gradient, within the anchor layer of copper. Nevertheless, the application of a coupled thermo-mechanical loads implies the drastic increase of the critical energy release rate at the initial conditions (i.e. initial crack 0.1 m). The lowest calculated increase (coupled thermal/axial cycling) of the energy release rate is 300% higher than the Gc evaluated during the thermal cycling loading. Furthermore, the stress intensity factors KI and KII, which are related to Mode-I loading and Mode-II loading respectively, are of the same order of magnitude. In the coupled thermal/displacement loading (Figure 23), the stress intensity factor KI is circa 70% higher than the KI achieved during the thermal cycling as displayed in Figure 24. Hence, Mode-I loading becomes more influent with respect to Mode-II loading and, the overall result of an increasing KI (and consequently the relative energy re- lease rate GI) is to reduce partially the effect of the mixed mode loading. This effect is highlighted in Figure 25 in which the crack paths of different loading conditions are depicted. The effect of an increasing Mode-I loading is represented by the tendency of the crack path to reduce its slope toward the Cu/Ni interface and to develop par- allel (pure Mode-I) to the copper layer interfaces. It is worthwhile to notice that the KII value is not influenced by the application of different loading conditions and its magnitude remains in general at the same level. In Figures 26 and 27, the trend of the energy release rates related to the crack path of the loading conditions described in Figure 25 are shown. It is worthwhile to notice the particular behaviour of G for the coupled ther- mal/bending cycling. The applied bending displacement tends to reduce the stress field around the crack tip if the crack shape is rectangular. This particular effect is not present in circular crack shapes in which much higher values are present. Figure 23. Trend of the stress intensity factors: thermal cycling and axial displacement (0.1 m). Figure 24. Trend of the stress intensity factors: thermal cycling (0.1 m). Copyright © 2012 SciRes. WJM 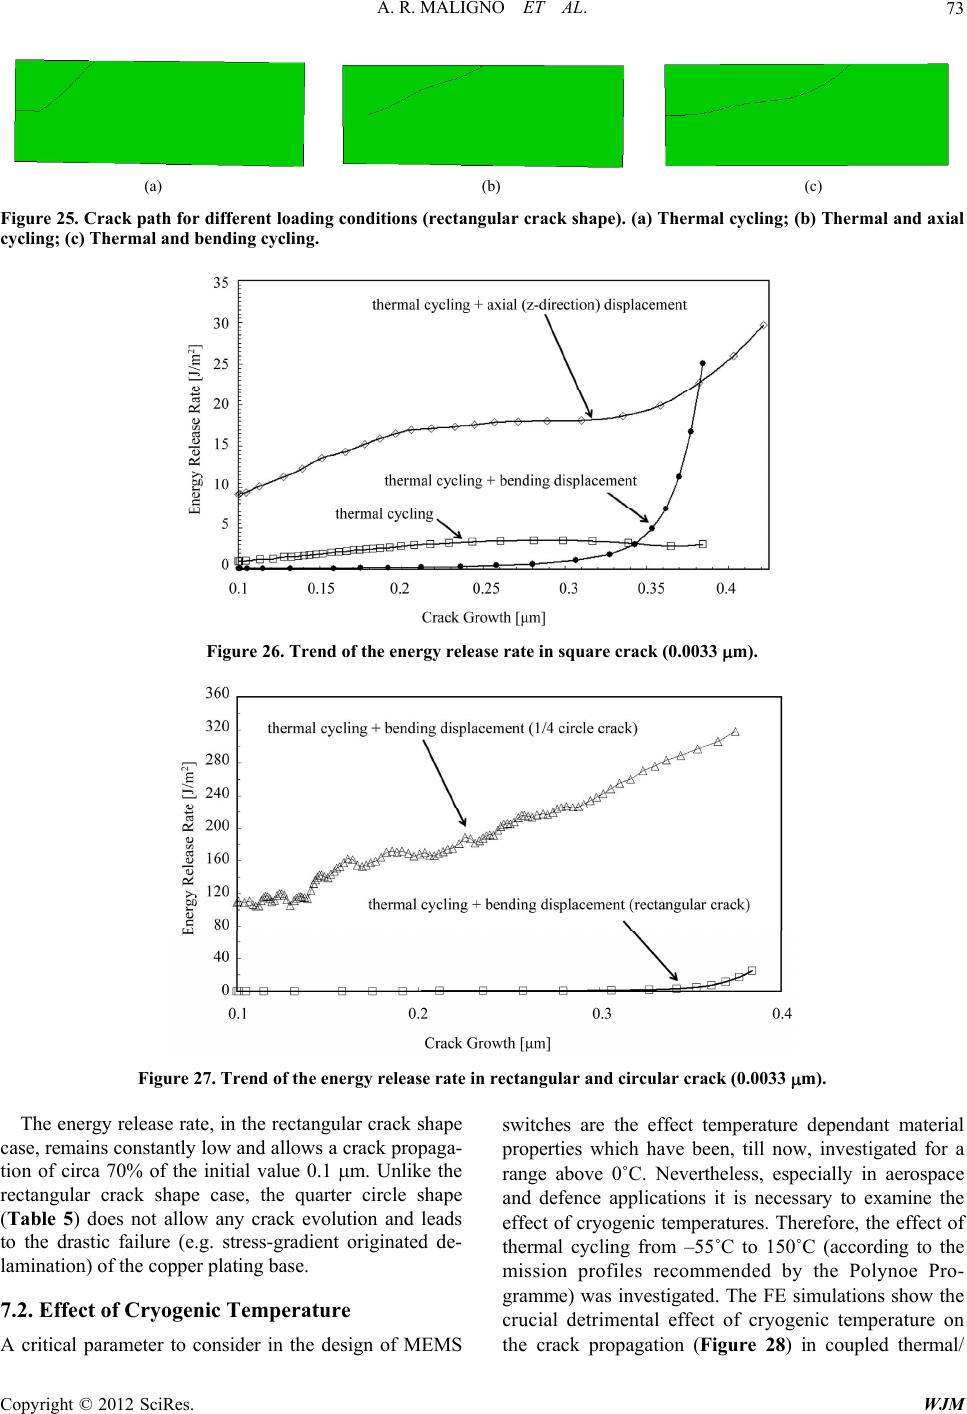 A. R. MALIGNO ET AL. 73 (a) (b) (c) Figure 25. Crack path for different loading conditions (rectangular crack shape). (a) Thermal cycling; (b) Thermal and axial cycling; (c) Thermal and bending cycling. Figure 26. Trend of the energy release rate in square crack (0.0033 m). Figure 27. Trend of the energy release rate in rectangular and circular crack (0.0033 m). The energy release rate, in the rectangular crack shape case, remains constantly low and allows a crack propaga- tion of circa 70% of the initial value 0.1 m. Unlike the rectangular crack shape case, the quarter circle shape (Table 5) does not allow any crack evolution and leads to the drastic failure (e.g. stress-gradient originated de- lamination) of the copper plating base. 7.2. Effect of Cryogenic Temperature A critical parameter to consider in the design of MEMS switches are the effect temperature dependant material properties which have been, till now, investigated for a range above 0˚C. Nevertheless, especially in aerospace and defence applications it is necessary to examine the effect of cryogenic temperatures. Therefore, the effect of thermal cycling from –55˚C to 150˚C (according to the mission profiles recommended by the Polynoe Pro- gramme) was investigated. The FE simulations show the crucial detrimental effect of cryogenic temperature on the crack propagation (Figure 28) in coupled thermal/ Copyright © 2012 SciRes. WJM 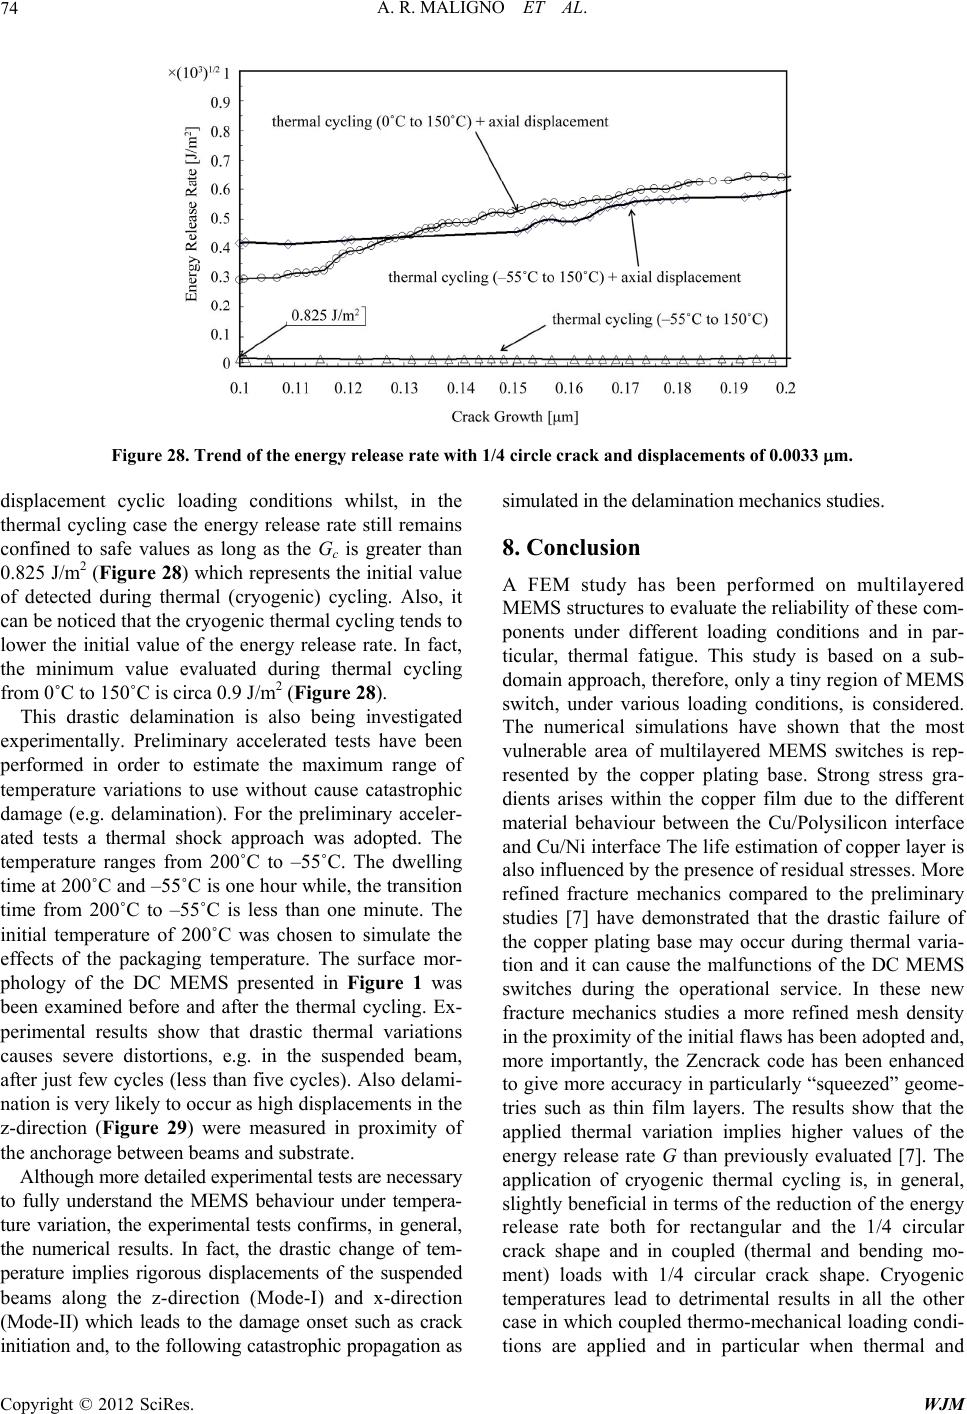 A. R. MALIGNO ET AL. 74 Figure 28. Trend of the energy release rate with 1/4 circle crack and displacements of 0.0033 m. displacement cyclic loading conditions whilst, in the thermal cycling case the energy release rate still remains confined to safe values as long as the Gc is greater than 0.825 J/m2 (Figure 28) which represents the initial value of detected during thermal (cryogenic) cycling. Also, it can be noticed that the cryogenic thermal cycling tends to lower the initial value of the energy release rate. In fact, the minimum value evaluated during thermal cycling from 0˚C to 150˚C is circa 0.9 J/m2 (Figure 28). This drastic delamination is also being investigated experimentally. Preliminary accelerated tests have been performed in order to estimate the maximum range of temperature variations to use without cause catastrophic damage (e.g. delamination). For the preliminary acceler- ated tests a thermal shock approach was adopted. The temperature ranges from 200˚C to –55˚C. The dwelling time at 200˚C and –55˚C is one hour while, the transition time from 200˚C to –55˚C is less than one minute. The initial temperature of 200˚C was chosen to simulate the effects of the packaging temperature. The surface mor- phology of the DC MEMS presented in Figure 1 was been examined before and after the thermal cycling. Ex- perimental results show that drastic thermal variations causes severe distortions, e.g. in the suspended beam, after just few cycles (less than five cycles). Also delami- nation is very likely to occur as high displacements in the z-direction (Figure 29) were measured in proximity of the anchorage between beams and substrate. Although more detailed experimental tests are necessary to fully understand the MEMS behaviour under tempera- ture variation, the experimental tests confirms, in general, the numerical results. In fact, the drastic change of tem- perature implies rigorous displacements of the suspended beams along the z-direction (Mode-I) and x-direction (Mode-II) which leads to the damage onset such as crack initiation and, to the following catastrophic propagation as simulated in the delamination mechanics studies. 8. Conclusion A FEM study has been performed on multilayered MEMS structures to evaluate the reliability of these com- ponents under different loading conditions and in par- ticular, thermal fatigue. This study is based on a sub- domain approach, therefore, only a tiny region of MEMS switch, under various loading conditions, is considered. The numerical simulations have shown that the most vulnerable area of multilayered MEMS switches is rep- resented by the copper plating base. Strong stress gra- dients arises within the copper film due to the different material behaviour between the Cu/Polysilicon interface and Cu/Ni interface The life estimation of copper layer is also influenced by the presence of residual stresses. More refined fracture mechanics compared to the preliminary studies [7] have demonstrated that the drastic failure of the copper plating base may occur during thermal varia- tion and it can cause the malfunctions of the DC MEMS switches during the operational service. In these new fracture mechanics studies a more refined mesh density in the proximity of the initial flaws has been adopted and, more importantly, the Zencrack code has been enhanced to give more accuracy in particularly “squeezed” geome- tries such as thin film layers. The results show that the applied thermal variation implies higher values of the energy release rate G than previously evaluated [7]. The application of cryogenic thermal cycling is, in general, slightly beneficial in terms of the reduction of the energy release rate both for rectangular and the 1/4 circular crack shape and in coupled (thermal and bending mo- ment) loads with 1/4 circular crack shape. Cryogenic temperatures lead to detrimental results in all the other case in which coupled thermo-mechanical loading condi- tions are applied and in particular when thermal and Copyright © 2012 SciRes. WJM 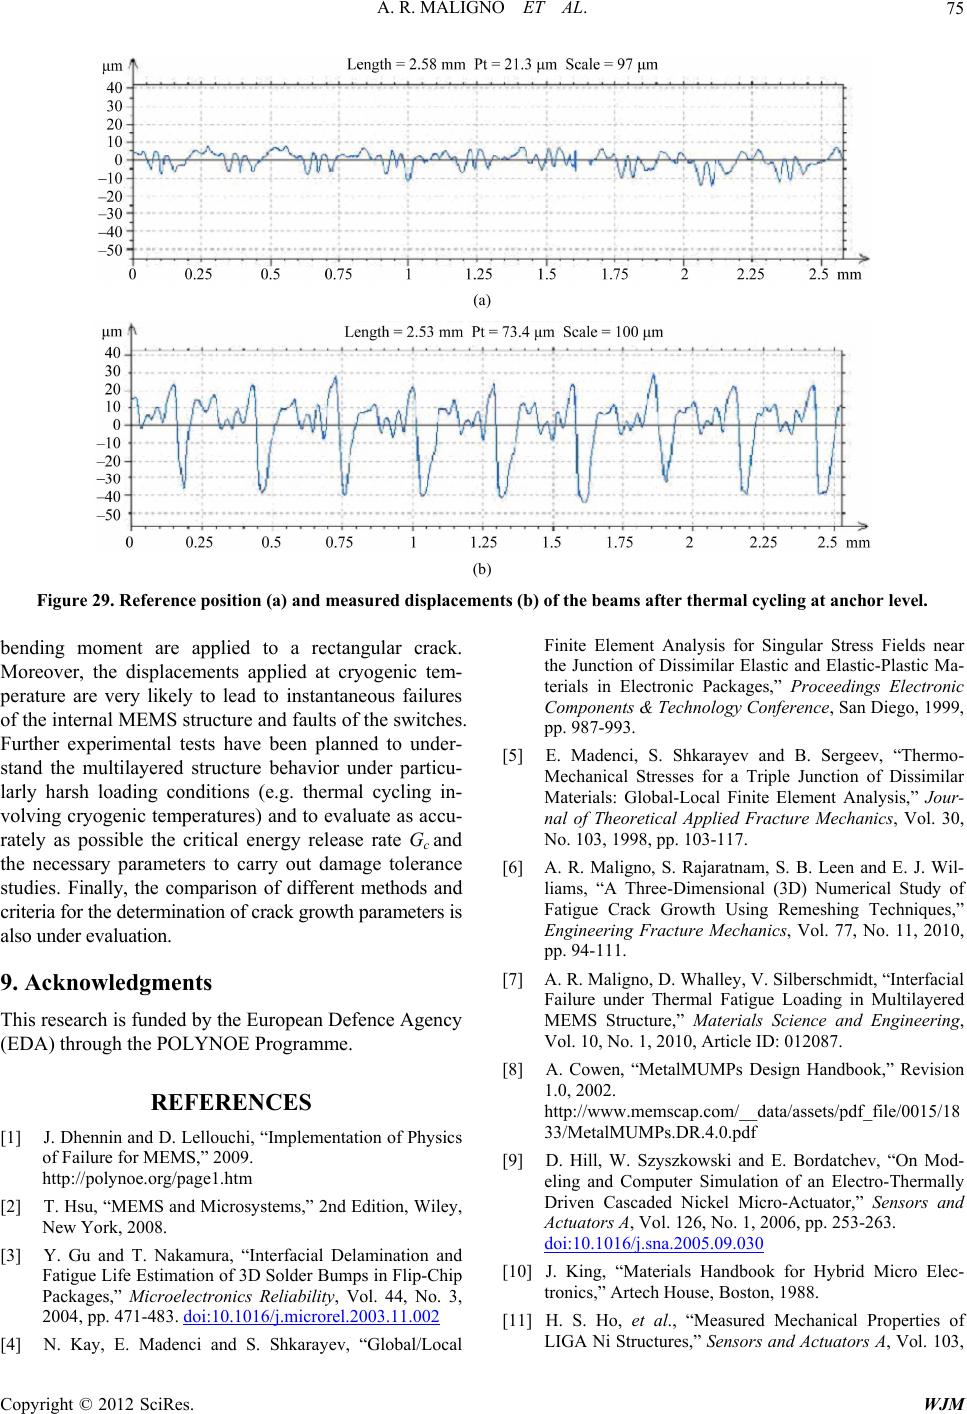 A. R. MALIGNO ET AL. 75 (a) (b) Figure 29. Reference position (a) and measured displacements (b) of the beams after thermal cycling at anchor level. bending moment are applied to a rectangular crack. Moreover, the displacements applied at cryogenic tem- perature are very likely to lead to instantaneous failures of the internal MEMS structure and faults of the switches. Further experimental tests have been planned to under- stand the multilayered structure behavior under particu- larly harsh loading conditions (e.g. thermal cycling in- volving cryogenic temperatures) and to evaluate as accu- rately as possible the critical energy release rate Gc and the necessary parameters to carry out damage tolerance studies. Finally, the comparison of different methods and criteria for the determination of crack growth parameters is also under evaluation. 9. Acknowledgments This research is funded by the European Defence Agency (EDA) through the POLYNOE Programme. REFERENCES [1] J. Dhennin and D. Lellouchi, “Implementation of Physics of Failure for MEMS,” 2009. http://polynoe.org/page1.htm [2] T. Hsu, “MEMS and Microsystems,” 2nd Edition, Wiley, New York, 2008. [3] Y. Gu and T. Nakamura, “Interfacial Delamination and Fatigue Life Estimation of 3D Solder Bumps in Flip-Chip Packages,” Microelectronics Reliability, Vol. 44, No. 3, 2004, pp. 471-483. doi:10.1016/j.microrel.2003.11.002 [4] N. Kay, E. Madenci and S. Shkarayev, “Global/Local Finite Element Analysis for Singular Stress Fields near the Junction of Dissimilar Elastic and Elastic-Plastic Ma- terials in Electronic Packages,” Proceedings Electronic Components & Technology Conference, San Diego, 1999, pp. 987-993. [5] E. Madenci, S. Shkarayev and B. Sergeev, “Thermo- Mechanical Stresses for a Triple Junction of Dissimilar Materials: Global-Local Finite Element Analysis,” Jour- nal of Theoretical Applied Fracture Mechanics, Vol. 30, No. 103, 1998, pp. 103-117. [6] A. R. Maligno, S. Rajaratnam, S. B. Leen and E. J. Wil- liams, “A Three-Dimensional (3D) Numerical Study of Fatigue Crack Growth Using Remeshing Techniques,” Engineering Fracture Mechanics, Vol. 77, No. 11, 2010, pp. 94-111. [7] A. R. Maligno, D. Whalley, V. Silberschmidt, “Interfacial Failure under Thermal Fatigue Loading in Multilayered MEMS Structure,” Materials Science and Engineering, Vol. 10, No. 1, 2010, Article ID: 012087. [8] A. Cowen, “MetalMUMPs Design Handbook,” Revision 1.0, 2002. http://www.memscap.com/__data/assets/pdf_file/0015/18 33/MetalMUMPs.DR.4.0.pdf [9] D. Hill, W. Szyszkowski and E. Bordatchev, “On Mod- eling and Computer Simulation of an Electro-Thermally Driven Cascaded Nickel Micro-Actuator,” Sensors and Actuators A, Vol. 126, No. 1, 2006, pp. 253-263. doi:10.1016/j.sna.2005.09.030 [10] J. King, “Materials Handbook for Hybrid Micro Elec- tronics,” Artech House, Boston, 1988. [11] H. S. Ho, et al., “Measured Mechanical Properties of LIGA Ni Structures,” Sensors and Actuators A, Vol. 103, Copyright © 2012 SciRes. WJM 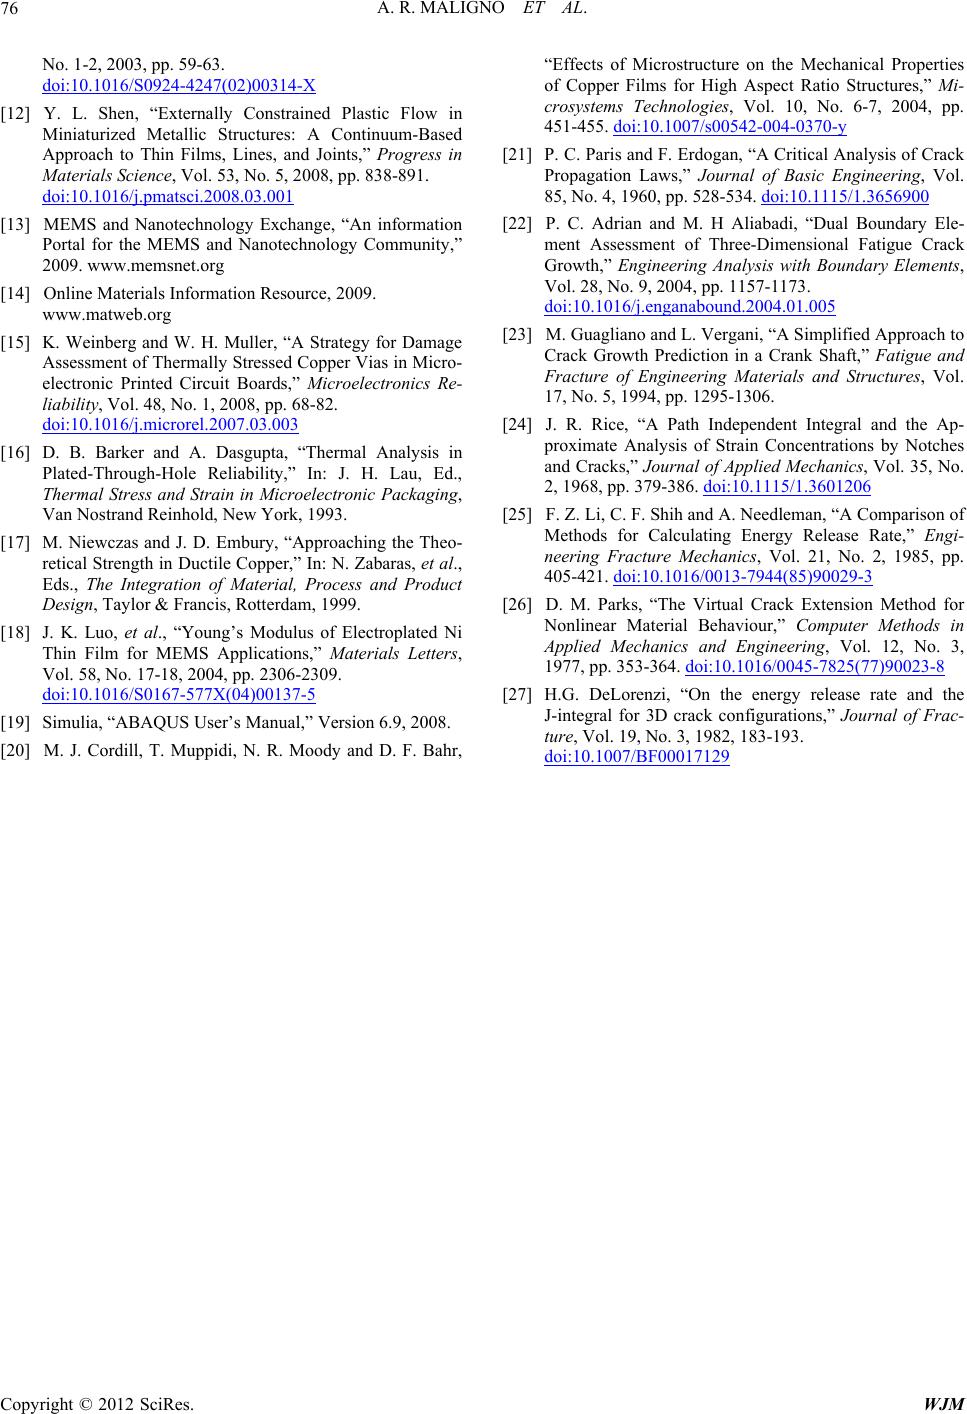 A. R. MALIGNO ET AL. 76 No. 1-2, 2003, pp. 59-63. doi:10.1016/S0924-4247(02)00314-X [12] Y. L. Shen, “Externally Constrained Plastic Flow in Miniaturized Metallic Structures: A Continuum-Based Approach to Thin Films, Lines, and Joints,” Progress in Materials Science, Vol. 53, No. 5, 2008, pp. 838-891. doi:10.1016/j.pmatsci.2008.03.001 [13] MEMS and Nanotechnology Exchange, “An information Portal for the MEMS and Nanotechnology Community,” 2009. www.memsnet.org [14] Online Materials Information Resource, 2009. www.matweb.org [15] K. Weinberg and W. H. Muller, “A Strategy for Damage Assessment of Thermally Stressed Copper Vias in Micro- electronic Printed Circuit Boards,” Microelectronics Re- liability, Vol. 48, No. 1, 2008, pp. 68-82. doi:10.1016/j.microrel.2007.03.003 [16] D. B. Barker and A. Dasgupta, “Thermal Analysis in Plated-Through-Hole Reliability,” In: J. H. Lau, Ed., Thermal Stress and Strain in Microelectronic Packaging, Van Nostrand Reinhold, New York, 1993. [17] M. Niewczas and J. D. Embury, “Approaching the Theo- retical Strength in Ductile Copper,” In: N. Zabaras, et al., Eds., The Integration of Material, Process and Product Design, Taylor & Francis, Rotterdam, 1999. [18] J. K. Luo, et al., “Young’s Modulus of Electroplated Ni Thin Film for MEMS Applications,” Materials Letters, Vol. 58, No. 17-18, 2004, pp. 2306-2309. doi:10.1016/S0167-577X(04)00137-5 [19] Simulia, “ABAQUS User’s Manual,” Version 6.9, 2008. [20] M. J. Cordill, T. Muppidi, N. R. Moody and D. F. Bahr, “Effects of Microstructure on the Mechanical Properties of Copper Films for High Aspect Ratio Structures,” Mi- crosystems Technologies, Vol. 10, No. 6-7, 2004, pp. 451-455. doi:10.1007/s00542-004-0370-y [21] P. C. Paris and F. Erdogan, “A Critical Analysis of Crack Propagation Laws,” Journal of Basic Engineering, Vol. 85, No. 4, 1960, pp. 528-534. doi:10.1115/1.3656900 [22] P. C. Adrian and M. H Aliabadi, “Dual Boundary Ele- ment Assessment of Three-Dimensional Fatigue Crack Growth,” Engineering Analysis with Boundary Elements, Vol. 28, No. 9, 2004, pp. 1157-1173. doi:10.1016/j.enganabound.2004.01.005 [23] M. Guagliano and L. Vergani, “A Simplified Approach to Crack Growth Prediction in a Crank Shaft,” Fatigue and Fracture of Engineering Materials and Structures, Vol. 17, No. 5, 1994, pp. 1295-1306. [24] J. R. Rice, “A Path Independent Integral and the Ap- proximate Analysis of Strain Concentrations by Notches and Cracks,” Journal of Applied Mechanics, Vol. 35, No. 2, 1968, pp. 379-386. doi:10.1115/1.3601206 [25] F. Z. Li, C. F. Shih and A. Needleman, “A Comparison of Methods for Calculating Energy Release Rate,” Engi- neering Fracture Mechanics, Vol. 21, No. 2, 1985, pp. 405-421. doi:10.1016/0013-7944(85)90029-3 [26] D. M. Parks, “The Virtual Crack Extension Method for Nonlinear Material Behaviour,” Computer Methods in Applied Mechanics and Engineering, Vol. 12, No. 3, 1977, pp. 353-364. doi:10.1016/0045-7825(77)90023-8 [27] H.G. DeLorenzi, “On the energy release rate and the J-integral for 3D crack configurations,” Journal of Frac- ture, Vol. 19, No. 3, 1982, 183-193. doi:10.1007/BF00017129 Copyright © 2012 SciRes. WJM
|