Paper Menu >>
Journal Menu >>
 Open Journal of Statistics, 2012, 2, 172-176 http://dx.doi.org/10.4236/ojs.2012.22019 Published Online April 2012 (http://www.SciRP.org/journal/ojs) Modified W ilcoxon Signed-Rank Test Ikewelugo Cyprian Anaene Oyeka, Godday Uwawunkonye Ebuh* Department of Statistics, Faculty of Physical Sciences, Nnamdi Azikiwe University, Awka, Nigeria Email: *ablegod007@yahoo.com Received January 6, 2012; revised February 10, 2012; accepted February 19, 2012 ABSTRACT This paper briefly reviews the Wilcoxon signed rank sum test and proposes a modification. Unlike the Wilcoxon method, the proposed approach does not require that the populations being studied be continuous. Also unlike the Wil- coxon signed rank test the proposed method, does not require the absence of zero differences or tied absolute values of differences. Rather the proposed method structurally makes provisions for these possibilities. The proposed test statistic also enables the estimation of the probabilities of positive, zero or tied and negative differences within the data. This was illustrated with an example and the proposed method was generally more efficient and hence more powerful than the Wilcoxon test statistic with the power increasing as the number of tied observations or zero differences increases. Keywords: Proposed Method; Probabilities; Positive; Zero; Tied; Negative; Frequencies 1. Introduction Wilcoxon signed rank test is a rank based alternative to the parametric t test that assumes only that the distribu- tion of differences within pairs be symmetric without requiring normality [1]. Let Xi be the ith observation, in a random sample of size n drawn from population X with unknown median M; or let (Xi, Yi) be the ith pair in a paired random sample of size n drawn from population X and Y with unknown M1 and M2 respectively. For the moment, we assume that X and Y are continuous. In the one sample case, interest may be in testing that the unknown population median M is equal to some specified value, M0. In the paired sample case interest may be in testing that the unknown popula- tion medians are equal that is M1 = M2 or that one popu- lation median is equal to at least some multiple of other population median, that is M1= c·M2 + k say, where c (c > 0) and k are real numbers versus appropriate two-sided or one sided alternative hypotheses. If the assumption of parametric test are satisfied, the first hypothesis may be tested using the one sample t-test while the second hy- pothesis may be tested using the paired sample t test. The third hypothesis may however be readily tested using the parametric method because of problems of non-homo- geneity. If the necessary assumptions of the parametric t- test cannot be reasonably made, use of a non-parametric method that often readily suggests itself in these situa- tions is the Wilcoxon signed rank sum test [2]. 1, 2,,in 1, 2,,in 1, 2,,in In this paper, we briefly discuss the Wilcoxon method and then proceed to present a modified version of the method that may be appropriate for testing the above hypotheses. 2. The Wilcoxon Signed Rank Sum Test According to [3,4], the Wilcoxon signed rank test is used to test the null hypothesis that the median of a distribu- tion is equal to some value and can be used in place of a one sample t-test, a paired t-test or for ordered categori- cal data where a numerical scale is inappropriate but where it is possible to rank the observations. To use the Wilcoxon signed rank sum test, we first find the difference between the observation and the hy- pothesized median in the one sample problem or the dif- ference between the paired observations in the paired sample problems. That is, in the one sample case, we find di = xi or in the two sample case (di = xi – cyi – k) for . We then take the absolute values of these differences and rank them either from the smallest to the largest or from the largest to the smallest, always taking note of the ranks of the absolute values with positive differences and those with negative differences. The re- quirement that the populations from which the samples are drawn are continuous makes it possible to state at least theoretically that the probability of obtaining zero differences or tied absolute values of the differences is zero. Now, let rd i be the rank assigned to i d i d1, 2,,in , the absolute value of the ith difference ; for 1,if 0; 0,if 0. i i i d Zd . Let (1) 1 i PZ (2) Let *Corresponding author. C opyright © 2012 SciRes. OJS  I. C. A. OYEKA, G. U. EBUH 173 1 n ii i TZrd (3) That is T is the sum of the ranks of the absolute values with positive differences. Now for simplicity but without loss of generality, we let i rd i 1 n i i TiZ [2]. Then, (4) Now i Z and 1 i Var Z (5) Hence 11 E nn ii ii TiZiZ That is 1 2 nn T ˆ (6) Note that an estimate of θ namely may be obtained from the expression 1ˆ 2 nn T 2Var ii iZ (7) 11 Var Var nn ii TiZ Cov ,0ZZ ij Since , for ij That is 12 1 Var 1 6 nn n T (8) The null hypothesis that is usually tested in the Wil- coxon signed rank sum approach is [2]. 00 2 1 : H versus either a two sided or an appropriate one sided al- ternative hypothesis. For the paired sample case, this null hypothesis is equivalent to 012 1 2 M M : HP . Similarly for the one sample case this null hypothesis is equivalent to 00 : H MM. A large sample test statistic for any hypothesized value of 0, θ0 say (0 < θ < 1) is given by 0 00 1 2 11 12 6 nn T Z nn n (9) This has approximately a standard normal distribution under the desired null hypothesis. But under the null hy- pothesis usually tested using the Wilcoxon signed rank test, that is, 00 1 :2 H , then Equation (6) becomes 0 1 4 nn T H (10) and 0 12 1 Var 24 nn n T H (11) Hence the test statistics of Equation (9) becomes 1 4 12 1 24 nn T Z nn n (12) which under H0 has a standard normal distribution for fairly large sample size n and may be used to test the null hypothesis of equal population medians. When all non zero values are of the same sign, the Wilcoxon signed rank test reduces to the sign test and the two tailed P- value is 1 1 2 n 1, 2, ,in , where n is the number of non zero val- ues [5]. 3. The Proposed Modified Method We here drop the requirement that the populations from which the samples are drawn are continuous. We now only require that the populations be quantitative data measured on at most the ordinal scale. The populations could be continuous or discrete. The requirements of no zero differences or tied absolute values are also no longer necessary; since these problems are taken care of struc- turally by following model specifications. We here con- tinue to use di to represent the difference between xi and the hypothesized population median M0, in the one-sam- ple case and the differences xi – yi (or xi – yi – k) in the paired sample case for . We also continue to use again without loss of generality rd i i to rep- resent the rank assigned to the absolute value of the ith difference, di. 1, if 0; 0, if 0; and 1, if 0 for 1,2,, ii i i dd Zdi n (13) Also let π1 i PZ 0 π0 i PZ , , π1 i PZ 0 πππ1 (14) where 1 n i i TiZ (15) Finally define (16) Copyright © 2012 SciRes. OJS  I. C. A. OYEKA, G. U. EBUH 174 That is, T is the difference between the sum of ranks assigned to absolute values with positive differences and the sum of the ranks assigned to absolute values with negative differences. 0 π1π ππ 1π0 i Z That is i Z 2 ππ Z (17) and 2 2 2 200 Var 1π1π1 ii i ZZ Z 2 ππ π That is Var ππ i Z (18) Furthermore 11 nn ii ii TiZ i That is 1ππ ππ ˆˆ ππ 2 nn T (19) Note that may be estimated as from 1 ˆˆ ππ 2Var ii iZ v 2 nn T (20) Also 11 Var Var nn ii TiZ Since , for , ij ZZ 0ijCo Therefore 2 12 1 Var ππ ππ 6 nn n T (21) Note that in the case of one sample , and π0 π π are respectively on the average the probabilities that the population median is greater than, equal to, or less than the hypothesized median Mo while in the paired sample case, they are on the average the probabilities that one population median is greater than, equal to or less than the other population median. They are estimated respec- tively as the relative frequencies of occurrence of 1, 0 and –1 in the frequency distribution of the n elements of i Z . That is ˆ π f n ; 0 0 ˆ π f n ; ˆ π f n (22) where f 0 , f and f i are respectively the frequen- cies of occurrence of 1, 0 and –1 in the frequency distri- bution of Z . Often the null hypothesis required to be tested is 0010 0 :ππ versus :ππ , say, 11 HH (23) or versus a two tailed or an appropriate one tailed alter- native hypothesis. For the paired sample case, this null hypothesis is equivalent to 012 120 :HPM MPM M 00 which for is the same as 12 H 01 2 :MM M cM k or For the one sample case, the null hypothesis is equiva- lent to 00 00 :HPMM PMM 0 H which for 0 implies 00 :MM The test statistic 0 2 1 2 12 1ππππ 6 nn T Z nn n (24) which under 0 H has a standard normal distribution for fairly large n. In practical application and ππ of Equation (24) are usually replaced with their sample es- timates of Equation (22). Note that as defined by Wilcoxon is the sum of the ranks of the absolute values of positive differences and that θ is the probability of the occurrence of only positive differences. Thus the speci- fication of Wilcoxon’s statistic does not explicitly pro- vide for the possible occurrence of negative differences. So the T π in our proposed modification in Equation (14) is automatically set equal to zero in the Wilcoxon’s ap- proach and under 0 H the probability of the occurrence of positive differences is hypothesized as 00 1 :2 H . Hence if we automatically set π0 and under the null hypothesis we set 000 1 ππ 2 in Equation (24), then the pro- posed test statistic is seen to coincide with Wilcoxon signed rank test statistic could be rewritten as 2 41 2121 ππ ππ 3 Tnn Z nn n (25) while the test statistic for the proposed method could be rewritten as 0 2 21 2121 ππ ππ 3 Tnn Z nn n (26) Copyright © 2012 SciRes. OJS 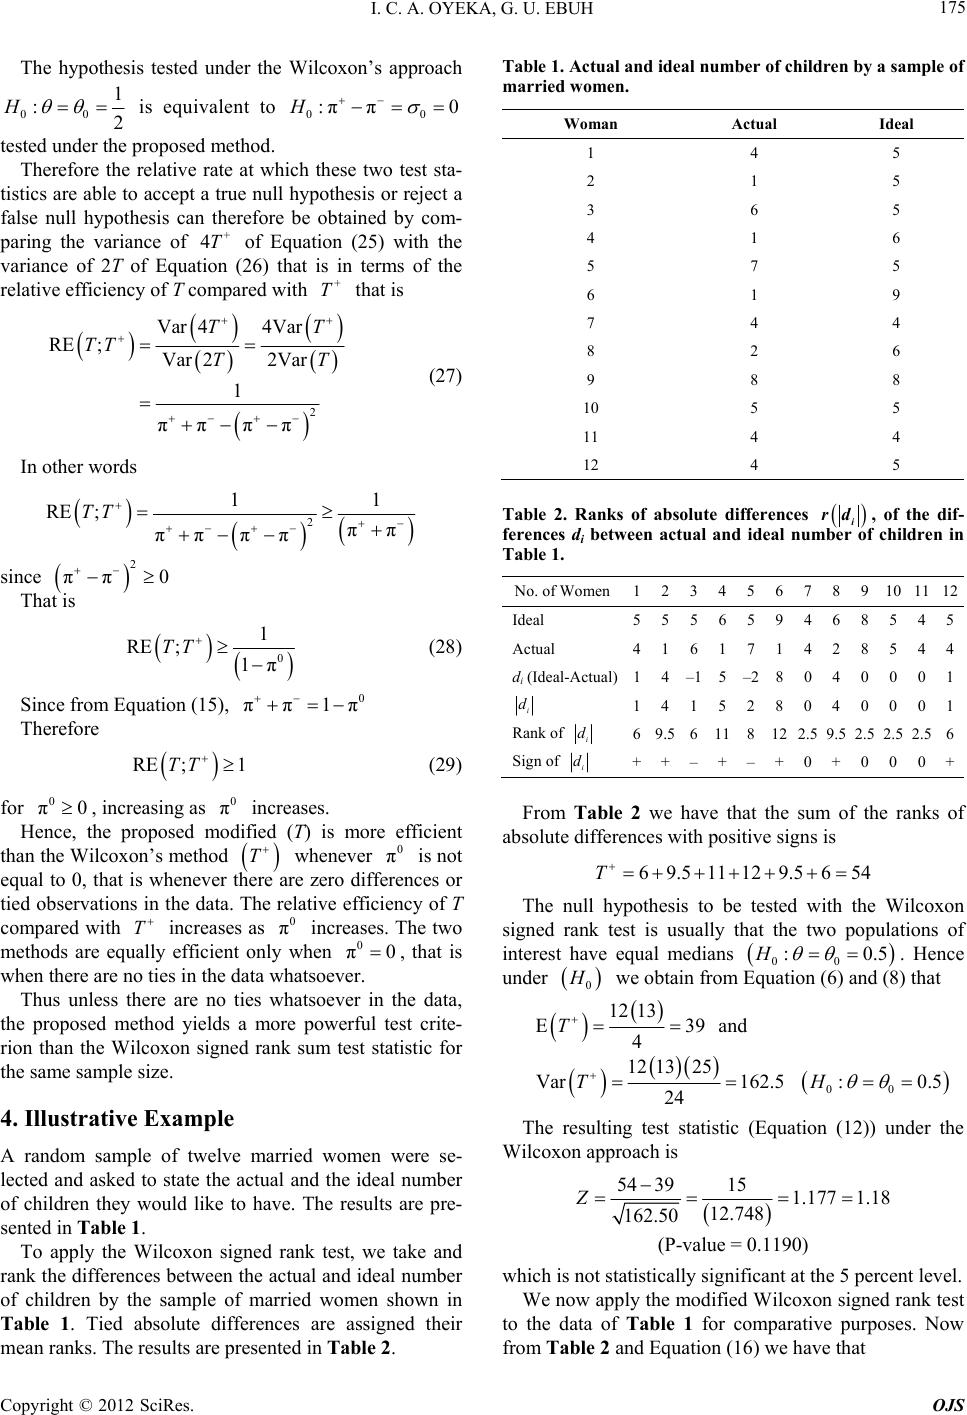 I. C. A. OYEKA, G. U. EBUH 175 The hypothesis tested under the Wilcoxon’s app roach 00 :2 1 is 00 ππ 0 e proposed method. tistics are able hypothesis or reject a false null hypobe obtained by com uation (25) with the va Hequivalent to :H tested under th Therefore the relative rate at which these two test sta- to accept a true null thesis can therefore - paring the variance of + 4T of Eq riance of 2T of Equation (26) that is in terms of the relative efficiency of T compared with + T that is 2 Var 44Var RE ;Var 22Var 1 TT TT TT (27) ππ ππ In other words 2 11 RE ; ππ ππ ππ TT sin That is ce 2 ππ 0 0 1 1π (28) om Therefore 1 (29) fo increases. roposed modified (T) is more efficient than the Wilcoethod RE ; TT Since fr Equation (15), 0 ππ1π RE ;TT r 0 π0, increasing as 0 π Hence, the p xon’s m T whenever 0 π is not ere are zero differences or equal to 0, thatver th servta. fficiency of T c 0, eth re te the actual and the ideal number have. The results are pre- olute differences are assigned their mean ranks. The results are presented in Table 2. Ta is whene tied obations in the daThe relative e ompared with T increases as 0 π increases. The two methods are equally efficient when 0 π that is when there are no ties in the data whatsoever. Thus unless there are no ties whatsoever in the data, the proposed mod yields a mo powerful test crite- rion than the Wilcoxon signed rank sum test statistic for the same sample size. only 4. Illustrative Example A random sample of twelve married women were se- lected and asked to sta of children they would like to sented in Table 1. To apply the Wilcoxon signed rank test, we take and rank the differences between the actual and ideal number of children by the sample of married women shown in Table 1. Tied abs ble 1. Actual and ideal number of childre n by a sample of married women. Woman Actual Ideal 1 4 5 2 1 5 3 6 5 4 1 6 5 7 5 6 1 9 7 4 4 8 2 6 9 8 8 10 5 5 11 4 4 12 4 5 Table 2. Ranks of absolute diffces eren i rd , ofe dif- ferences ditween actual and ideal number of cdren in Table 1. No. of Wo12346 7 8 9 1112 th hil be men5 10 Ideal 5 5 5 6 5 9 4 5 4 56 8 Actual 4 1 6 1 7 1 4 2 8 5 44 di (Ideal-Actual)14–15–2 8 0 4 0 0 01 i d 1 4 1 5 2 8 0 4 0 0 0 1 Rank of i d 69.56 11 8 12 2.5 9.5 2.52.52.56 Sign of i d ++ – + – + 0 + 0 00+ we hahhe rans absote differe pii .5 1565 From Table 2ve tat t tive e sum sig of t s hk of lunces withosns 691129.4T The null hypothesis to be tested with the Wilcoxon si 0.5. Hence under gned rank test is usually that the two populations of interest have equal medians 00 :H 0 H we obtain from Equation (6) and (8) that 12 1339 4 T and 12 1325 Var 162.5 24 T 00 :0.5H The resulting test statistation (12)) under the Wilcoxon approach is ic (Equ 54 3915177 1.18 12.748 162.50 Z significant at the 5 percent level. We now apply the modified Wilcoxon signed rk test to the data of Table 1 for comparative purposes. Now from Table 2 and Equation (16) we have that 1. (P-value = 0.1190) which is not statistically an Copyright © 2012 SciRes. OJS 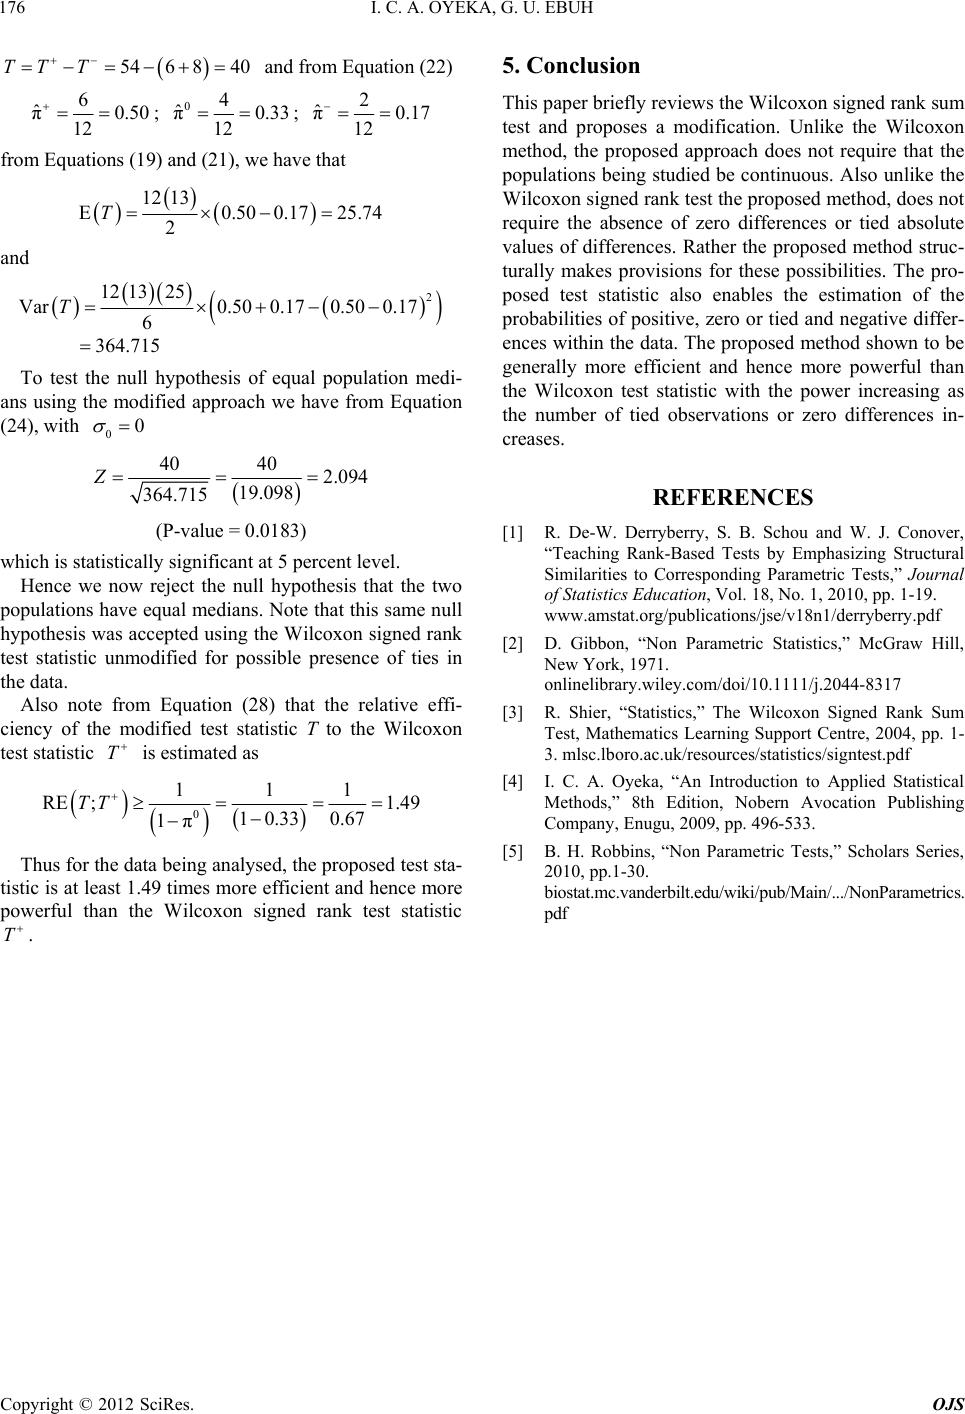 I. C. A. OYEKA, G. U. EBUH Copyright © 2012 SciRes. OJS 176 6 840 and from54TT T Equation (22) 6 ˆ π0.50 12 ; 0 ˆ π0.33 12 ; 4 2 ˆ π0.17 12 from Equations (19) and (21), we have that 0.17 25.74 and 12 130.50 2 T 2 Var0.500.170.50 0.17 6 364.715 T test the null hypothesis of equal population medi- ng the modified approach we have from Equation 0 12 1325 To ans usi (24), with 0 4040 2.094 Z e two populations have equal medians. Note that th hypothesis was accepted using the Wilcoxon signed rank test statistic unmoresence of ties in 19.098 364.715 (P-value = 0.0183) which is stalytistical significant at 5 percent level. Hence we now reject the null hypothesis that th is same null dified for possible p the data. Also note from Equation (28) that the relative effi- ciency of the modified test statistic T to the Wilcoxon test statistic T is estimated as 010 .33 0.67 1π Thus for the data being analysed, the proposed test sta- tistic is at least 1.49 times more e 111 RE ; 1.49TT fficient and hence more powerful than the Wilcoxon signed rank test statistic T. Thipaper briefly reviews the Wilcoxon signed rank sum a modification. Unlike the Wilcoxon sed approach does not require that the [1] R. De-W. Derryberry, S. B. Schou and W. J. Conover, “Teaching Raizing Structural Similarities toric Tests,” Journal earning Support Centre, 2004, pp. 1- /.../NonParametrics. 5. Conclusion s test and proposes method, the propo populations being studied be continuous. Also unlike the Wilcoxon signed rank test the proposed method, does not require the absence of zero differences or tied absolute values of differences. Rather the proposed method struc- turally makes provisions for these possibilities. The pro- posed test statistic also enables the estimation of the probabilities of positive, zero or tied and negative differ- ences within the data. The proposed method shown to be generally more efficient and hence more powerful than the Wilcoxon test statistic with the power increasing as the number of tied observations or zero differences in- creases. REFERENCES nk-Based Tests by Emphas Corresponding Paramet of Statistics Education, Vol. 18, No. 1, 2010, pp. 1-19. www.amstat.org/publications/jse/v18n1/derryberry.pdf [2] D. Gibbon, “Non Parametric Statistics,” McGraw Hill, New York, 1971. onlinelibrary.wiley.com/doi/10.1111/j.2044-8317 [3] R. Shier, “Statistics,” The Wilcoxon Signed Rank Sum Test, Mathematics L 3. mlsc.lboro.ac.uk/resources/statistics/signtest.pdf [4] I. C. A. Oyeka, “An Introduction to Applied Statistical Methods,” 8th Edition, Nobern Avocation Publishing Company, Enugu, 2009, pp. 496-533. [5] pdf B. H. Robbins, “Non Parametric Tests,” Scholars Series, 2010, pp.1-30. biostat.mc.vanderbilt.edu/wiki/pub/Main |