 Journal of Transportation Technologies, 2012, 2, 85-101 http://dx.doi.org/10.4236/jtts.2012.22011 Published Online April 2012 (http://www.SciRP.org/journal/jtts) A Decision-Support System for the Car Pooling Problem Riccardo Manzini, Arrigo Pareschi Department of Industrial Engineering, Bologna University, Bologna, Italy Email: riccardo.manzini@unibo.it Received January 29, 2012; revised March 1, 2012; accepted March 16, 2012 ABSTRACT The continuous increase of human mobility combined with a relevant use of private vehicles contributes to increase the ill effects of vehicle externalities on the environment, e.g. high levels of air pollution, toxic emissions, noise pollution, and on the quality of life, e.g. parking problem, traffic congestion, and increase in the number of crashes and accidents. Transport demand management plays a very critical role in achieving greenhouse gas emission reduction targets. This study demonstrates that car pooling (CP) is an effective strategy to reduce transport volumes, transportation costs and related hill externalities in agreement with EU programs of emissions reduction targets. This paper presents an original approach to solve the CP problem. It is based on hierarchical clustering models, which have been adopted by an original decision support system (DSS). The DSS helps mobility managers to generate the pools and to design feasible paths for shared vehicles. A significant case studies and obtained results by the application of the proposed models are illustrated. They demonstrate the effectiveness of the approach and the supporting decisions tool. Keywords: Car Pooling; Clustering Analysis (CA); Passenger Transportation Modes; Vehicle Efficiency; Sustainability Transport; Transport Demand Management 1. Introduction In last decade, international environment agencies, e.g. the European Environment Agency (EEA), are searching for effective challenges to reduce the environmental im- pacts of transport and to improve the environmental per- formance of the transport system as a whole. In particular, several studies and reports demonstrate that current de- velopments in the transport sector are not compatible with the need to reduce harmful air pollutant emissions (e.g. NOx, SO2, particulates, PM10) and overall green- house gas emissions responsible of climate change. Technology can deliver some of the reductions needed, but needs to be significantly supported by behavioural changes. This is true especially in countries such as Italy, where the passenger transport demand by private cars was 79.1% in 2004 [1]. Even if between 2007 and 2008 passenger transport demand in the EEA-32 declined, most likely due to the impacts of the global economic recession, overall passenger transport demand has grown by over a fifth since 1995. Italy counts a very high per- centage (about 30%) of the EEA members’ fleet of mo- torbikes and mopeds, and does not yet widely adopt transportation modes, e.g. vehicle sharing, able to reduce vehicle usage and ownership if compared to countries such as UK or Switzerland. This paper deals with the car-pooling problem (CPP). Car pooling (CP) can be categorized into two different forms: Daily Car Pooling Problem (DCPP) and Long- term Car Pooling Problem (LTCPP). For DCPP, on each day a number of users are available for picking up or bringing back their colleagues in that particular day [2]. For LTCPP, each user has to act as both a server and a client; the objective is to define user pools where each user will pick up the remaining pool members in turn, on different days. The aim is the minimization of the amount of used vehicles and the total distance travelled by all users when acting as servers, subject to car capac- ity and time window constraints. The problem discussed in this paper deals with LTCPP. CP is an effective strategy to guarantee and support sustainable transport and sustainable mobility. It is “the ability to meet the needs of society to move freely, gain access, communicate, trade, and establish relationships without sacrificing other essential human or ecological values today or in the future” (World Business Council for Sustainable Development [3]). CP is a special typology of the basic strategy of shar- ing vehicles to directly reduce the use of private cars, the requirement of parking space, and indirectly contribute to reduce vehicle externalities including emissions of greenhouse, crash costs, roadway congestion, space con- sumption, etc. CP is a service organized by companies that encourage their employees to travel to/from a spe- cific location, e.g. the work location, in groups. The ge- neric group of employees, called pool or cluster, shares C opyright © 2012 SciRes. JTTs  R. MANZINI ET AL. 86 vehicles and paths in order to minimize the global cost of the system, as the sum of vehicles fixed costs and vari- able travelling costs. Other significant strategies and solutions, the so-called sustainable passenger transportation modes, to manage mobility and traffic due to people and workers moving are: car/van/bike sharing, ride-sharing, lift-sharing, pub- lic vehicles (e.g. buses, electric cars, metro), hybrid cars, bikebus and walkbus for students going to school, per- sonal automated transport (PAT) or podcar, tool roads for which a driver pays a fee for use, restricted urban entry zones, high-occupancy vehicle (HOV) lanes. In particu- lar, the HOV lanes are also known as carpool lanes, commuter lanes, diamond lanes, express lanes, and tran- sit lanes, and regularly carry more people than adjacent regular lanes of travel. Unfortunately, CP is not yet a solution adopted by many companies and institutions as the car sharing is. In Italy there are a very high number of cars for each family and person (690 vehicles per 1000 people) because many Italian families are used to be owner of at least one car and prefer to go to the location of work by themselves using one of their own vehicles [4]. A wide diffusion of CP by the large number of medium-large companies would significantly contribute to reduce the ill effects of an unconditional and selfish use of private vehicles. Literatures presents a few contributions on models and tools, i.e. rules, procedures and issues, usable by mobility managers to best define and organize poolers matching and vehicle routing. They are very complex and not di- rectly comprehensible to mobility managers [5,6]. More- over, discussions on significant case studies are not fre- quently presented. To further support the diffusion of CP, this paper pre- sents the development of an effective approach to solve the CPP, and an original DSS to help mobility manager to daily generate pools of users and identify the best routing of vehicles. This paper also presents a what-if multi-scenario analysis conducted on a significant case study. The rest of the paper is organized as follows: Section 2 presents the literature review on CPP and a set of sig- nificant statistics encouraging and justifying the adoption of effective strategies and tools to reduce gas emissions and externalities. Section 3 presents the proposed hierar- chical approach to the clustering analysis, the formation of groups and the routing of vehicles within each ob- tained cluster. Section 4 illustrates the DSS developed for the automation of the proposed models and procedures. Section 5 presents the results of the group formation and vehicle routing process by the application of the pro- posed cluster-first route-second approach to a case study of about 1900 potential participants to a CP program. Finally, Section 6 presents conclusion and further re- search. 2. Literature Review Literature presents several studies monitoring the envi- ronmental performance of different transportation modes in different countries and in accordance to the growing of transportation demand. The authors, as citizens of EU member States, reports statistics, analyses, strategies and policies, and targets which refers to the European trans- portation system and issues. In particular, the European Environmental Agency (EEA) and the Environmental Reporting Mechanism (EEA TERM) introduce a framework to integrate indi- cators useful to monitor both transport and environment issues and identifying rules and tools to improve the per- formance of a transport system. The analysis, control and optimization of transporta- tion modes and usage in accordance with climate change and environmental issues, are based on several focuses: focus on road transport, rail transport, air transport, wa- terborne transport, non motorised transport (e.g. cycling and walking), land use and planning, etc. [7] presents an interesting investigation on what car-use reduction meas- ures are perceived by households to be feasible to reduce car driving. The study proposed in this paper deals with road trans- port, whose main two topics are: 1) Transport for the trading sectors and moving of materials, known as freight transport, i.e. logistics & dis- tribution; 2) Transport for non trading sectors and moving of passengers. Literature presents several studies on the minimization of travelling costs and indirectly gas emissions and ex- ternalities in logistics and distribution. A few significant examples are proposed by [8] and [9] presenting original models and tools for the design, management and control of a freight transportation system. They also present a survey on literature studies on supply chain management and distribution network optimization with particular attention to the minimization of distances travelled by vehicles in presence of different transportation modes (road, rail, air). Several studies deal with sustainable transport and mobility of passengers but a few of them present effective tools usable by mobility managers to implement planning decisions regarding commuting. Commuting is the basic philosophy of car sharing and CP issues and rules. [10] presents heuristic algorithms based on saving functions for the CPP. The computational complexity of the CPP is NP-hard. A set of significant statistics on the attitudes of EU members towards different passenger transportation modes, the related effects and the environmental exter- Copyright © 2012 SciRes. JTTs  R. MANZINI ET AL. 87 nalities, follow [11-13]. CO2 emissions. During 1990-2004 the emissions of CO2 increased by 27%, 26.079 million tonnes (Mt CO2) in 2004, while the energy demand from the transport sector increased by 37%. In particular, USA and China respectively increased by 19% and 108% in term of CO2 emissions, and by 28% and 168% in term of energy demand. For the 27 EU Member States (EU-27) the green- house gas emission 2020 projections are 1091 Mt CO2—eq. (767 Mt CO2—eq. reported in 1990), as- suming a 15% growth in transport volume between 2010 and 2020 and no further reduction measures, and excluding air and maritime transport. Passenger car use. It grew by 18% between 1995 and 2004, and it was responsible for 74% of all passenger transport in 2004. In 2005 the average car ownership level is 777 in the USA per 1000 inhabitants, while it is 460 in the 32 EEA members, including 27 EU states, Turkey, Norway, Iceland, Liechtenstein and Switzerland. The increase of car ownership rates re- duces the average number of passenger per car and does not contribute to cut greenhouse gas emissions. High levels of ownership rate do not improve vehicle efficiency. In 2003 the road network, including motorways, rep- resented about 95% of the total, including also rail- way lines, oil pipelines and inland waterways. In par- ticular, Italy presents the following key indicators re- lated to railways in 2003: 28 km per 100,000 inhabi- tants and 54 km per 1000 squared km. Responding to a questionnaire, only 22% of EU citi- zens stated that they would not consider reducing car usage under any circumstances [14]. In UK there was a total membership of car sharing clubs of 23,000 in 2006 [15]. Strategies and policies to ensure better capacity utili- sation within each transportation mode may result in sub- stantial additional reductions of CO2 emissions and other externalities [11]. Moreover, the increase of transport demand and car usage, and the reduction of the number of passengers per car negate the improvements gained from the improvements in vehicle efficiency, such as 120 g CO2/km target for passenger cars by 2012 as stated by the European Council—EC [11]. In particular, assuming this target met in 2012 and the cars are replaced at the same rate as today there will be an efficiency gain of 30 g CO2 per km which corresponds to –125 Mt CO2—eq. [11]. Different targets, e.g. that band in the Bali roadmap in 2020, can guarantee additional emission reductions. Consequently the main keyword as the way forward to a sustainability development is: integra tion. Integration of transport and environmental strategies; integration of vehicle efficiency targets, technologies, energy efficient transportation modes, construction and maintenance in- frastructures, behavioural changes, reduction of transport demand. In particular, all EEA reports state “it will not be possible to achieve ambitious targets without limiting transport demand” [11]: modal shift and influence on user behaviours may reduce the need for demand that is the so-called transport volume. This paper presents a set of original cost-based models and a DSS to solve the CPP. The proposed models and methods mainly refer to the clustering analysis (CA), which can be efficiently supported by commercial statis- tical tools. Therefore, these supporting decision models can be quickly adopted by mobility managers of indus- trial and service production systems implementing CP and other transportation modes to reduce traffic and emissions or by expertise offering and supplying mobil- ity services. Literature studies on CA as a way to group items, e.g. car poolers, is presented by [16] and [9] for respectively cellular manufacturing and group technology, by [17] for the analysis of enterprises network and by [8] for freight transportation and vehicle routing adopting the groupage strategy. There are not recent studies on CP. Previous signifi- cant contributions are: [18] on daily CPP, [19] and fi- nally [20]. [20] presents a case study in Strasbourg (France). [2] presents an exact and a heuristic method for the CPP, based on two integer programming formulations. This manuscript is not an Operations Research contribu- tion focused on the mathematical formulation of the problem and the development of optimal approaches to solve it, but it is focused on effective models and meth- ods to face the generic problem instance and support the decision making efficiently. To this, a DSS is proposed and applied to a set of real instances. 3. Cluster Based Approach to the CPP The adopted approach to solve the CPP is 2-phases: cluster first and route second. Nevertheless, it is based on three main activities, called steps, as illustrated in Figure 1. 3.1. Step 1 The first step deals with data collection about: Users, e.g. geographical locations, availability/non availability of a car to be shared, capacity of the car (i.e. maximum admissible number of passengers) and eventually maximum admissible extra time to reach the destination point, etc.; Destination point, i.e. geographical location; Transportation network by the availability of a geo- graphical map, routes and related performance, e.g. Copyright © 2012 SciRes. JTTs  R. MANZINI ET AL. 88 average travelling velocity, as a result of route typol- ogy, e.g. HOV lanes, and traffic congestions. 3.2. Step 2 The second step is the first phase of the adopted 2-phases heuristic approach for the CPP. It is based on CA and on the use of similarity indices as introduced by statistics and widely applied to several disciplines, e.g. medicine, biology, engineering, economics ([8] and [9]). In par- ticular, the level of similarity between two generic users who want to participate to a CP service is a measure of saving which encourages them to commuting, i.e. to be- long to a shared group of people. Figure 1 presents the main tasks to execute a CA and obtain the groups of users as a partition of the whole set of participants to a CP program. The second task of step 2 deals with the determination of the similarity matrix, as the result of the adoption of a similarity or dissimilarity index, also called “distance” (see task 1, called “saving analysis: similarity/distance evaluation” in Figure 1). An example of a similarity index between two locations A and B is the Pearson correlation coefficient defined as: ,, 1 , 2 ,, 11 Pearson n Ai ABi B i AB nn Ai ABi B ii xxxx xx xx 2 (1) where ,,iI n locations n: number of users (participants) Xi,j: distance between location i and location j 1. Data collection 2.Cluster first – users’ groups formation saving analysis: similarity/distance evaluation; similarity matrix construction; clustering heuristic algorithms 3.Route second - vehicle routing Identification of the “current provider”, owner of the shared car; Identification of the best solution to the Travelling Salesman Problem – TSP, including all users (clients and current provider) for each group Figure 1. Three steps—2-phases approach to the CPP . i mean distance of n – 1 users from the i location. This index does not consider the location of the desti- nation point, but the distance between two addresses as CP users’ locations. Nevertheless, the aim of a CA is to support the grouping of users, i.e. the hierarchical parti- tioning of the whole set of participants. Other similar indices are reported, applied and discussed by [16] which deals with cellular manufacturing, and by [8] and [9] discussing freight transportation. These problem-oriented similarity indices are not the object of this manuscript. The third task of this step (“cluster first” phase) deals with the process of grouping the participants in homoge- neous clusters, called car pools. The basic hypothesis is that given a generic group, the driver of the shared car turns among the participants: in case the pool is made of five participants and the number of working days is five, the single user shares and drives his/her own car one day each week. Nevertheless, the proposed approach, models and DSS can be also applied in case the grouping process is executed daily in accordance to a continuous changing of the set of participants, eventually owner of cars of different capacities. The clustering process is executed by the application of a heuristic algorithm, e.g. the Com- plete Linkage (CLINK) clustering also known as Nearest Neighbour algorithm, the Single Linkage (SLINK) clus- tering, also available in commercial statistical tools, e.g. Minitab® statistical software and Statgraphics®. Conse- quently, a rough execution of these decisional tasks for the group formation can be also executed both by not expert mobility managers of companies encouraging CP and by transportation agencies or CP service suppliers. Next section illustrates a DSS developed by the author for the sequential and automatic execution of these steps. 3.3. Step 3 The third step is the second phase of the adopted 2-phase approach to the CPP. Aim of this step is the identification of best set of daily routes to reach the destination loca- tion by the adoption of the groups of travellers previously defined. The generic route depends on the selection of a user, named “current provider” of the group. The current provider is the owner and driver of the vehicle. He/she visits his/her colleagues’ members of the same group and travels to the destination point. This is the well-known travelling salesman problem (TSP) given the starting and ending locations to visit in a single trip. 4. A Decision Support System for the CPP This section illustrates an original DSS, named “The Carpooler”, developed by the author to support the mo- bility manager in the CP activity. Figure 2 presents the main graphical user interface (GUI), which introduces the user to the data entry activity, the parameterization of Copyright © 2012 SciRes. JTTs 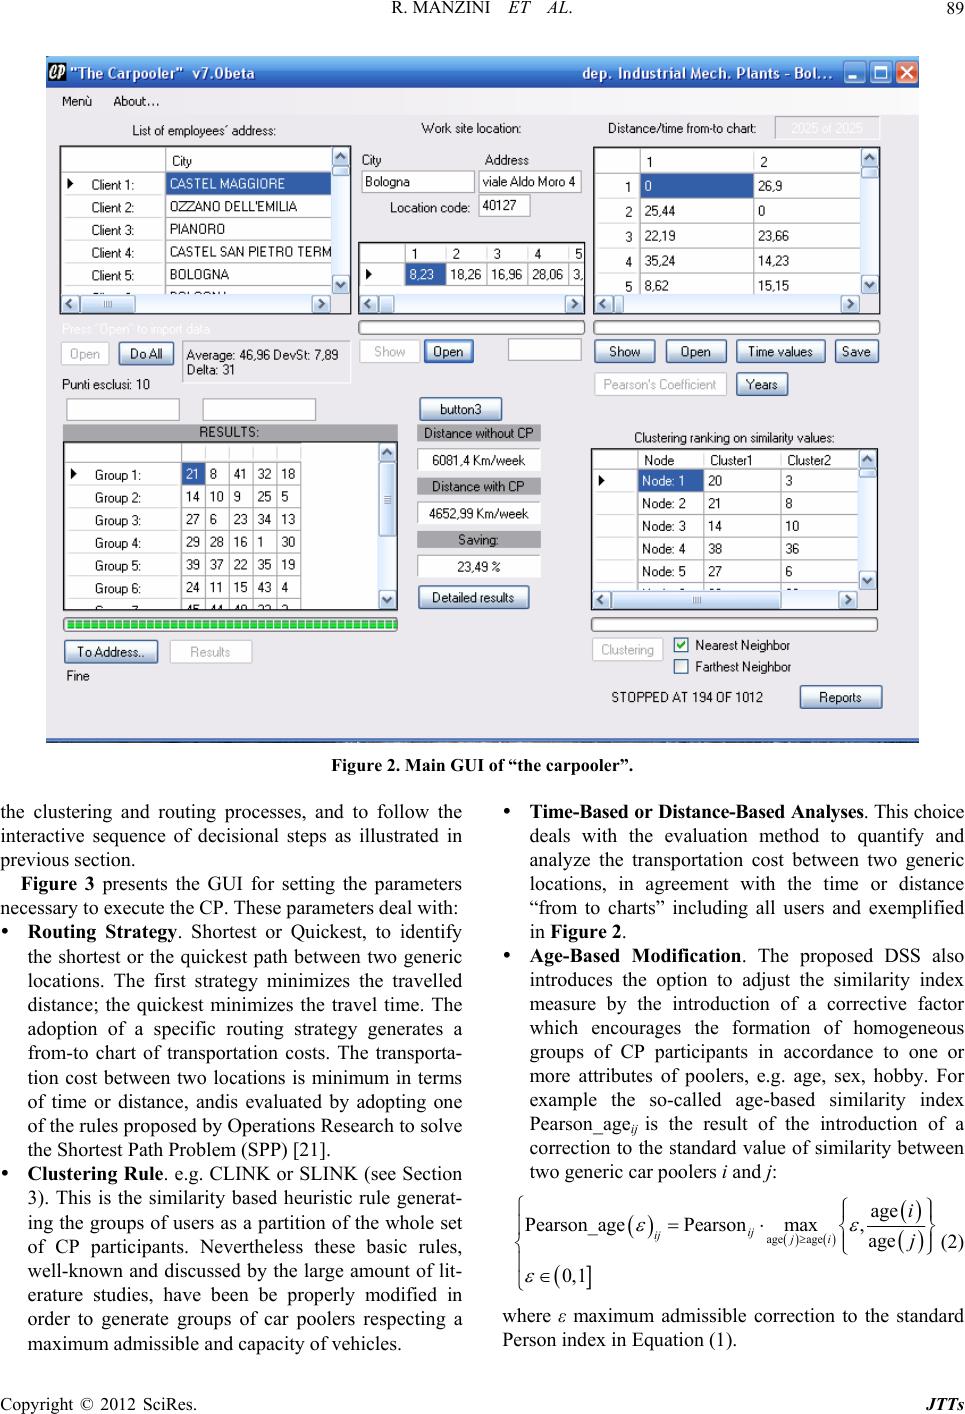 R. MANZINI ET AL. Copyright © 2012 SciRes. JTTs 89 Figure 2. Main GUI of “the carpooler”. Time-Based or Distance-Based Analyses. This choice deals with the evaluation method to quantify and analyze the transportation cost between two generic locations, in agreement with the time or distance “from to charts” including all users and exemplified in Figure 2. the clustering and routing processes, and to follow the interactive sequence of decisional steps as illustrated in previous section. Figure 3 presents the GUI for setting the parameters necessary to execute the CP. These parameters deal with: Routing Strategy. Shortest or Quickest, to identify the shortest or the quickest path between two generic locations. The first strategy minimizes the travelled distance; the quickest minimizes the travel time. The adoption of a specific routing strategy generates a from-to chart of transportation costs. The transporta- tion cost between two locations is minimum in terms of time or distance, andis evaluated by adopting one of the rules proposed by Operations Research to solve the Shortest Path Problem (SPP) [21]. Age-Based Modification. The proposed DSS also introduces the option to adjust the similarity index measure by the introduction of a corrective factor which encourages the formation of homogeneous groups of CP participants in accordance to one or more attributes of poolers, e.g. age, sex, hobby. For example the so-called age-based similarity index Pearson_ageij is the result of the introduction of a correction to the standard value of similarity between two generic car poolers i and j: Clustering Rule. e.g. CLINK or SLINK (see Section 3). This is the similarity based heuristic rule generat- ing the groups of users as a partition of the whole set of CP participants. Nevertheless these basic rules, well-known and discussed by the large amount of lit- erature studies, have been be properly modified in order to generate groups of car poolers respecting a maximum admissible and capacity of vehicles. age age age Pearson_agePearsonmax, age 0, 1 ij ij ji i j (2) where ε maximum admissible correction to the standard Person index in Equation (1). 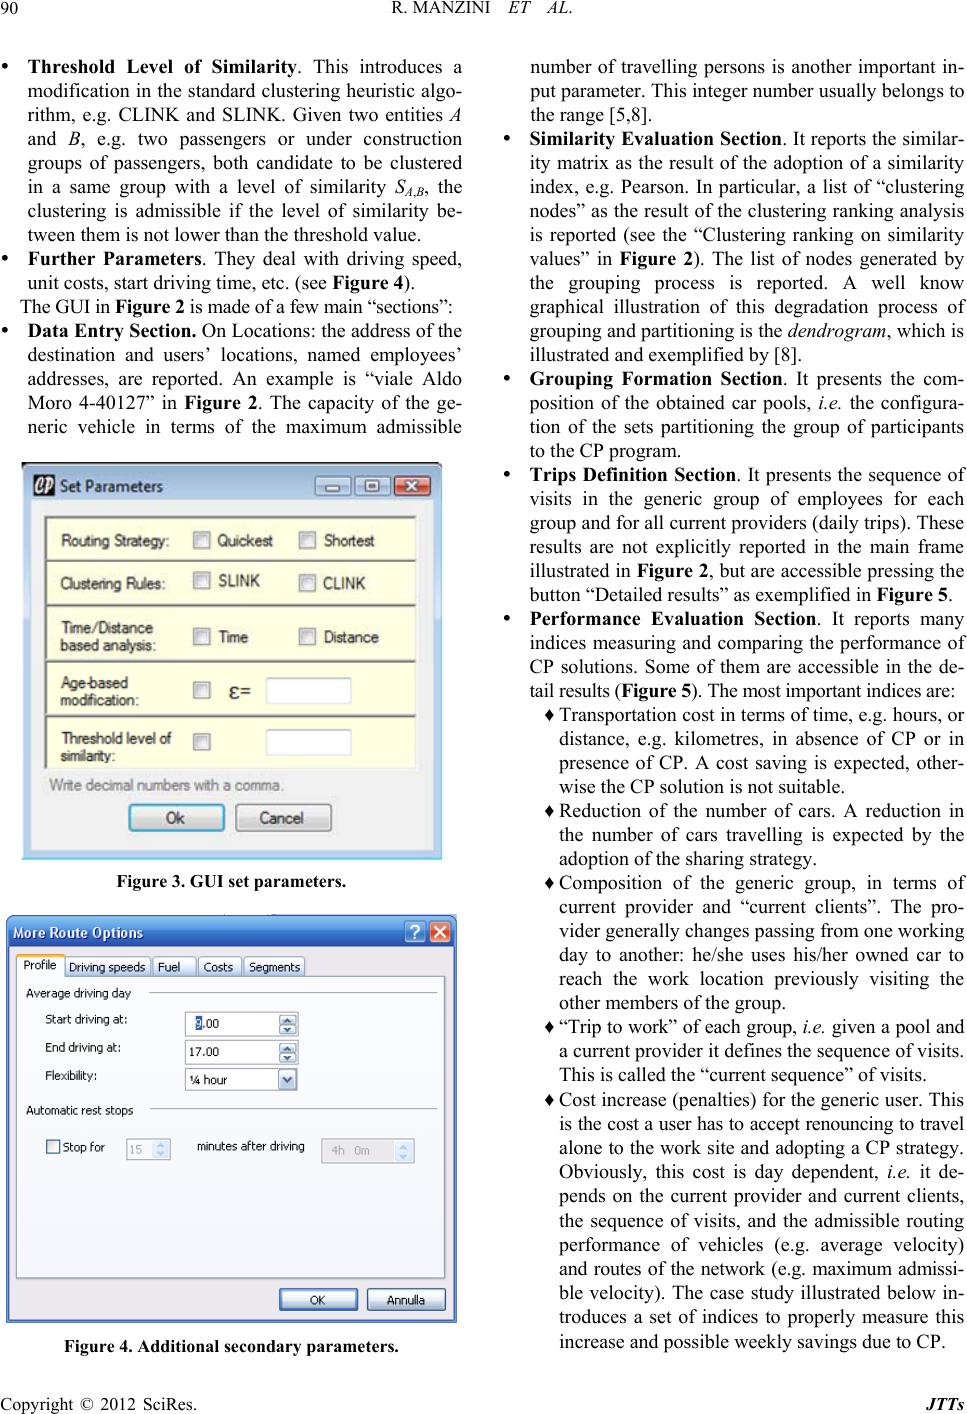 R. MANZINI ET AL. 90 Threshold Level of Similarity. This introduces a modification in the standard clustering heuristic algo- rithm, e.g. CLINK and SLINK. Given two entities A and B, e.g. two passengers or under construction groups of passengers, both candidate to be clustered in a same group with a level of similarity SA,B, the clustering is admissible if the level of similarity be- tween them is not lower than the threshold value. Further Parameters. They deal with driving speed, unit costs, start driving time, etc. (see Figure 4). The GUI in Figure 2 is made of a few main “sections”: Data Entry Section. On Locations: the address of the destination and users’ locations, named employees’ addresses, are reported. An example is “viale Aldo Moro 4-40127” in Figure 2. The capacity of the ge- neric vehicle in terms of the maximum admissible Figure 3. GUI set parameters. Figure 4. Additional secondary parameters. number of travelling persons is another important in- put parameter. This integer number usually belongs to the range [5,8]. Similarity Evaluation Section. It reports the similar- ity matrix as the result of the adoption of a similarity index, e.g. Pearson. In particular, a list of “clustering nodes” as the result of the clustering ranking analysis is reported (see the “Clustering ranking on similarity values” in Figure 2). The list of nodes generated by the grouping process is reported. A well know graphical illustration of this degradation process of grouping and partitioning is the dendrogram, which is illustrated and exemplified by [8]. Grouping Formation Section. It presents the com- position of the obtained car pools, i.e. the configura- tion of the sets partitioning the group of participants to the CP program. Trips Definition Section. It presents the sequence of visits in the generic group of employees for each group and for all current providers (daily trips). These results are not explicitly reported in the main frame illustrated in Figure 2, but are accessible pressing the button “Detailed results” as exemplified in Figure 5. Performance Evaluation Section. It reports many indices measuring and comparing the performance of CP solutions. Some of them are accessible in the de- tail results (Figure 5). The most important indices are: ♦ Transportation cost in terms of time, e.g. hours, or distance, e.g. kilometres, in absence of CP or in presence of CP. A cost saving is expected, other- wise the CP solution is not suitable. ♦ Reduction of the number of cars. A reduction in the number of cars travelling is expected by the adoption of the sharing strategy. ♦ Composition of the generic group, in terms of current provider and “current clients”. The pro- vider generally changes passing from one working day to another: he/she uses his/her owned car to reach the work location previously visiting the other members of the group. ♦ “Trip to work” of each group, i.e. given a pool and a current provider it defines the sequence of visits. This is called the “current sequence” of visits. ♦ Cost increase (penalties) for the generic user. This is the cost a user has to accept renouncing to travel alone to the work site and adopting a CP strategy. Obviously, this cost is day dependent, i.e. it de- pends on the current provider and current clients, the sequence of visits, and the admissible routing performance of vehicles (e.g. average velocity) and routes of the network (e.g. maximum admissi- ble velocity). The case study illustrated below in- troduces a set of indices to properly measure this increase and possible weekly savings due to CP. Copyright © 2012 SciRes. JTTs 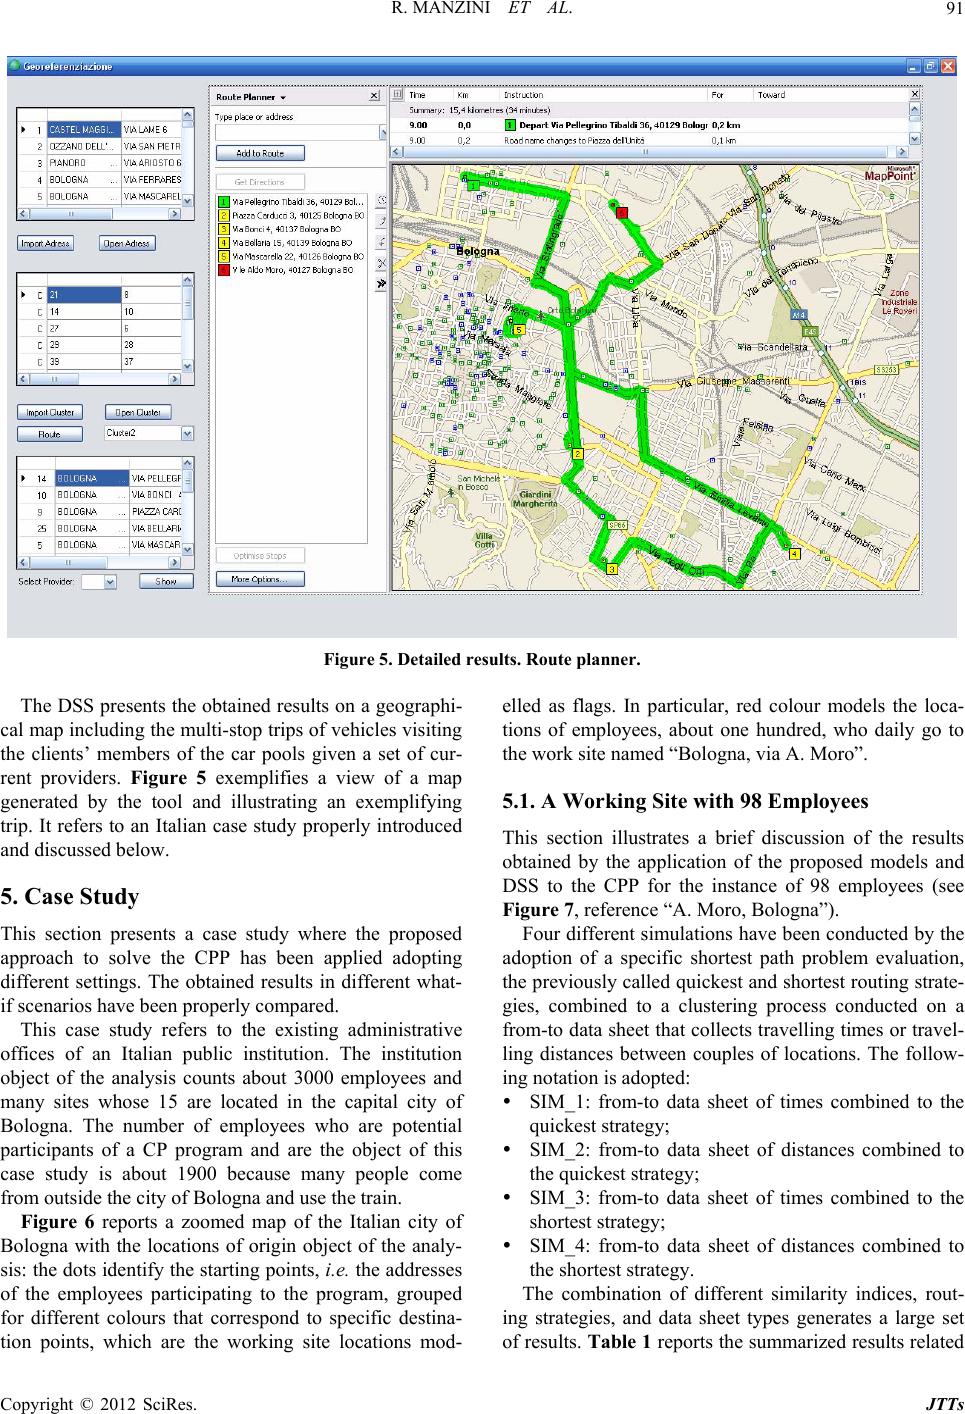 R. MANZINI ET AL. Copyright © 2012 SciRes. JTTs 91 Figure 5. Detailed results. Route planner. The DSS presents the obtained results on a geographi- cal map including the multi-stop trips of vehicles visiting the clients’ members of the car pools given a set of cur- rent providers. Figure 5 exemplifies a view of a map generated by the tool and illustrating an exemplifying trip. It refers to an Italian case study properly introduced and discussed below. 5. Case Study This section presents a case study where the proposed approach to solve the CPP has been applied adopting different settings. The obtained results in different what- if scenarios have been properly compared. This case study refers to the existing administrative offices of an Italian public institution. The institution object of the analysis counts about 3000 employees and many sites whose 15 are located in the capital city of Bologna. The number of employees who are potential participants of a CP program and are the object of this case study is about 1900 because many people come from outside the city of Bologna and use the train. Figure 6 reports a zoomed map of the Italian city of Bologna with the locations of origin object of the analy- sis: the dots identify the starting points, i.e. the addresses of the employees participating to the program, grouped for different colours that correspond to specific destina- tion points, which are the working site locations mod- elled as flags. In particular, red colour models the loca- tions of employees, about one hundred, who daily go to the work site named “Bologna, via A. Moro”. 5.1. A Working Site with 98 Employees This section illustrates a brief discussion of the results obtained by the application of the proposed models and DSS to the CPP for the instance of 98 employees (see Figure 7, reference “A. Moro, Bologna”). Four different simulations have been conducted by the adoption of a specific shortest path problem evaluation, the previously called quickest and shortest routing strate- gies, combined to a clustering process conducted on a from-to data sheet that collects travelling times or travel- ling distances between couples of locations. The follow- ing notation is adopted: SIM_1: from-to data sheet of times combined to the quickest strategy; SIM_2: from-to data sheet of distances combined to the quickest strategy; SIM_3: from-to data sheet of times combined to the shortest strategy; SIM_4: from-to data sheet of distances combined to the shortest strategy. The combination of different similarity indices, rout- ing strategies, and data sheet types generates a large set f results. Table 1 reports the summarized results related o 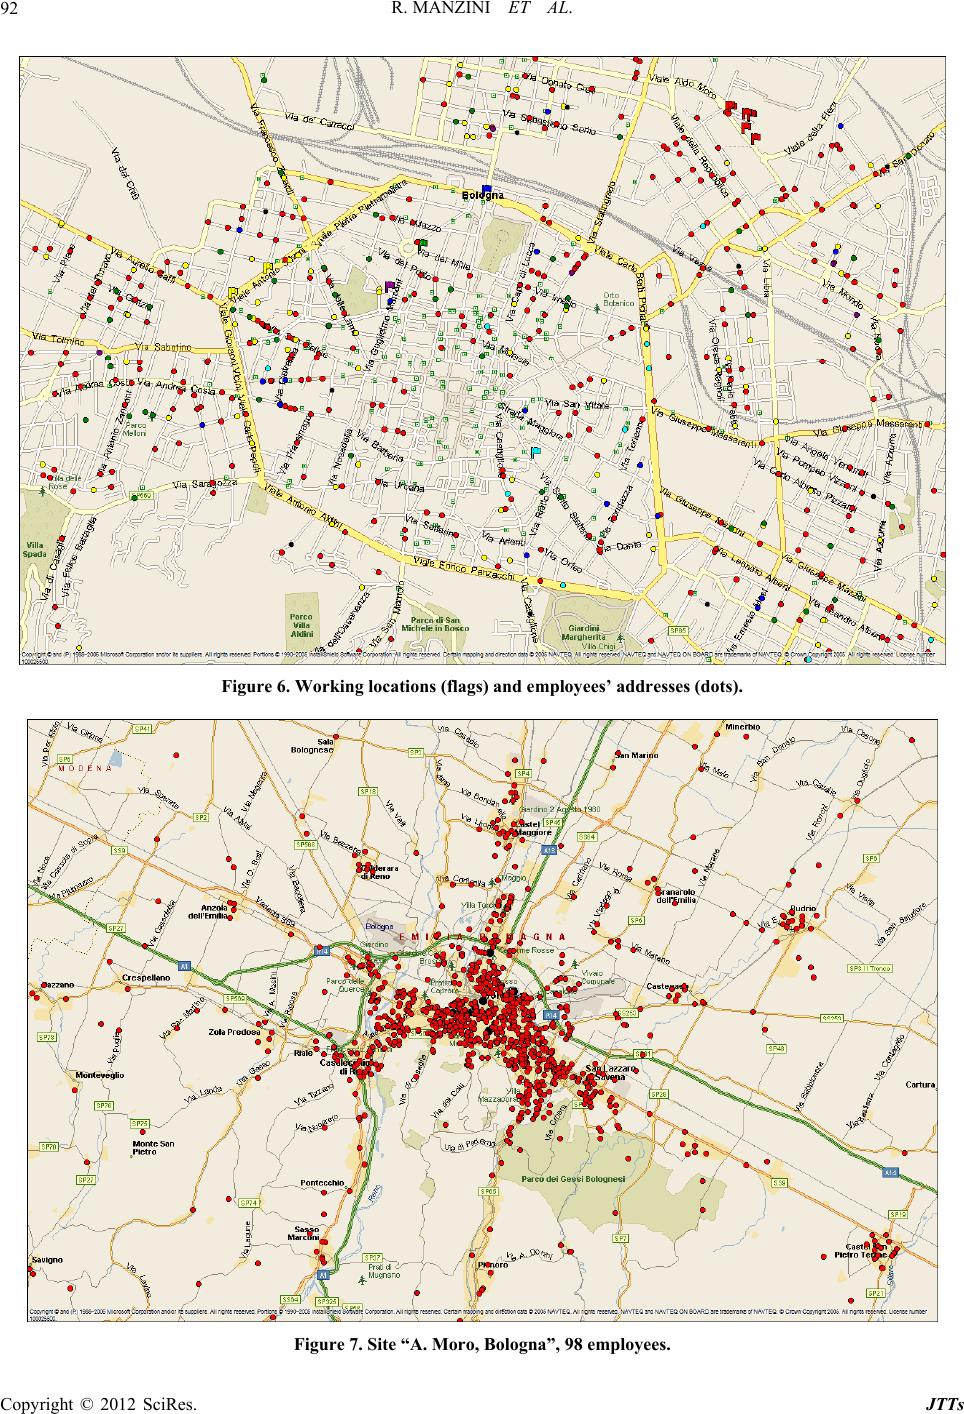 R. MANZINI ET AL. 92 Figure 6. Working locations (flags) and employees’ addresses (dots). Figure 7. Site “A. Moro, Bologna”, 98 employees. Copyright © 2012 SciRes. JTTs 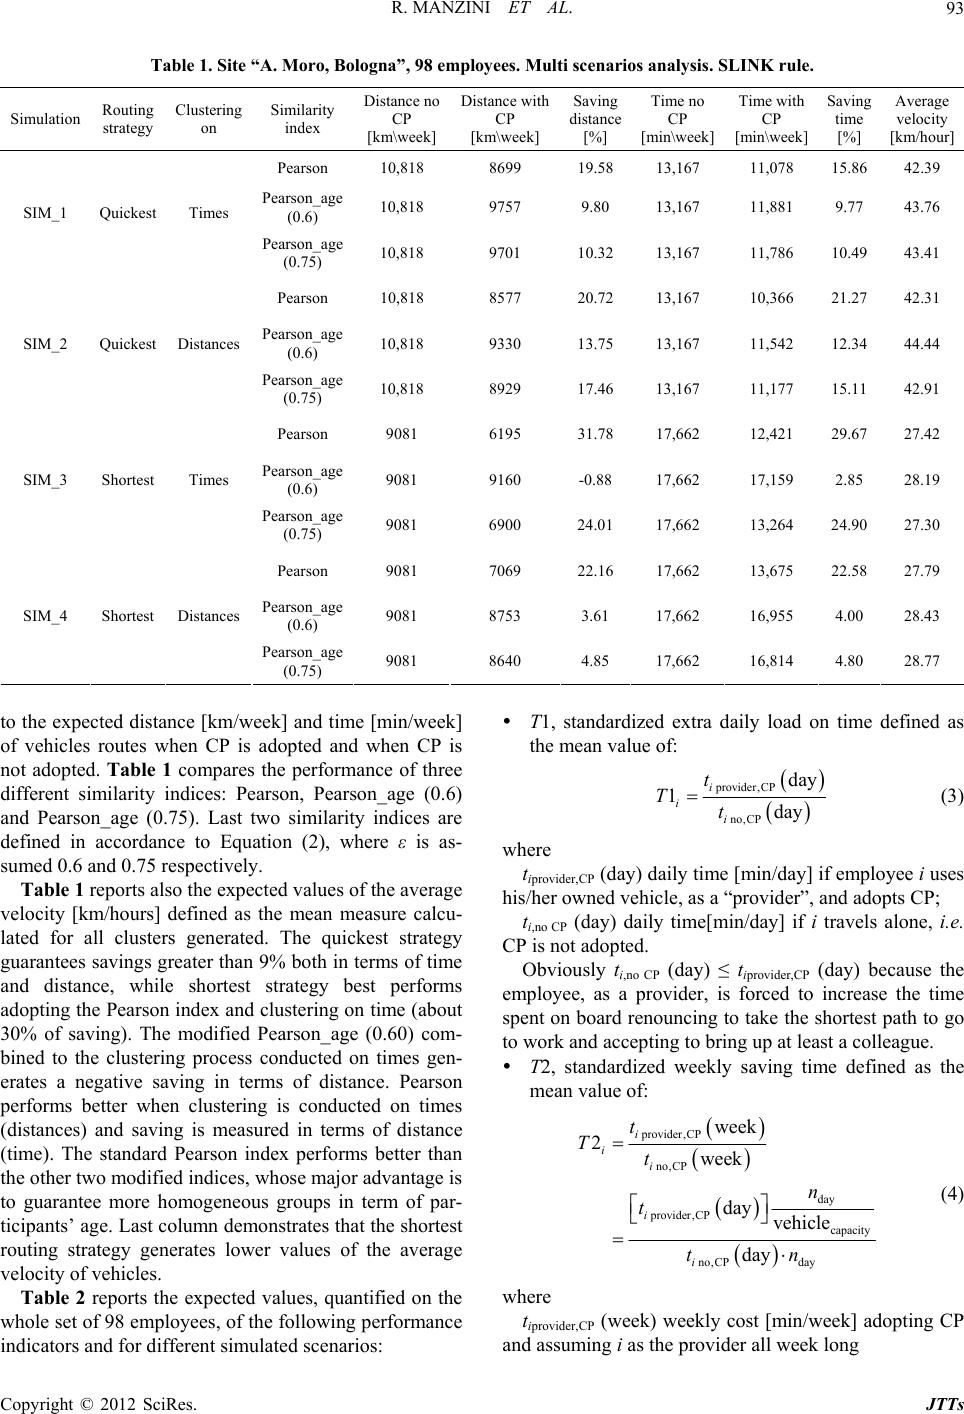 R. MANZINI ET AL. 93 Table 1. Site “A. Moro, Bologna”, 98 employees. Multi scenarios analysis. SLINK rule. Simulation Routing strategy Clustering on Similarity index Distance no CP [km\week] Distance with CP [km\week] Saving distance [%] Time no CP [min\week] Time with CP [min\week] Saving time [%] Average velocity [km/hour] Pearson 10,818 8699 19.58 13,167 11,078 15.86 42.39 Pearson_age (0.6) 10,818 9757 9.80 13,167 11,881 9.77 43.76 SIM_1 Quickest Times Pearson_age (0.75) 10,818 9701 10.32 13,167 11,786 10.49 43.41 Pearson 10,818 8577 20.72 13,167 10,366 21.27 42.31 Pearson_age (0.6) 10,818 9330 13.75 13,167 11,542 12.34 44.44 SIM_2 Quickest Distances Pearson_age (0.75) 10,818 8929 17.46 13,167 11,177 15.11 42.91 Pearson 9081 6195 31.78 17,662 12,421 29.67 27.42 Pearson_age (0.6) 9081 9160 -0.88 17,662 17,159 2.85 28.19 SIM_3 Shortest Times Pearson_age (0.75) 9081 6900 24.01 17,662 13,264 24.90 27.30 Pearson 9081 7069 22.16 17,662 13,675 22.58 27.79 Pearson_age (0.6) 9081 8753 3.61 17,662 16,955 4.00 28.43 SIM_4 Shortest Distances Pearson_age (0.75) 9081 8640 4.85 17,662 16,814 4.80 28.77 to the expected distance [km/week] and time [min/week] of vehicles routes when CP is adopted and when CP is not adopted. Table 1 compares the performance of three different similarity indices: Pearson, Pearson_age (0.6) and Pearson_age (0.75). Last two similarity indices are defined in accordance to Equation (2), where ε is as- sumed 0.6 and 0.75 respectively. Table 1 reports also the expected values of the average velocity [km/hours] defined as the mean measure calcu- lated for all clusters generated. The quickest strategy guarantees savings greater than 9% both in terms of time and distance, while shortest strategy best performs adopting the Pearson index and clustering on time (about 30% of saving). The modified Pearson_age (0.60) com- bined to the clustering process conducted on times gen- erates a negative saving in terms of distance. Pearson performs better when clustering is conducted on times (distances) and saving is measured in terms of distance (time). The standard Pearson index performs better than the other two modified indices, whose major advantage is to guarantee more homogeneous groups in term of par- ticipants’ age. Last column demonstrates that the shortest routing strategy generates lower values of the average velocity of vehicles. Table 2 reports the expected values, quantified on the whole set of 98 employees, of the following performance indicators and for different simulated scenarios: T1, standardized extra daily load on time defined as the mean value of: provider,CP no,CP day 1day i i i t Tt (3) where tiprovider,CP (day) daily time [min/day] if employee i uses his/her owned vehicle, as a “provider”, and adopts CP; ti,no CP (day) daily time[min/day] if i travels alone, i.e. CP is not adopted. Obviously ti,no CP (day) ≤ tiprovider,CP (day) because the employee, as a provider, is forced to increase the time spent on board renouncing to take the shortest path to go to work and accepting to bring up at least a colleague. T2, standardized weekly saving time defined as the mean value of: provider,CP no,CP day provider,CP capacity no,CP day week 2week day vehicl e day i i i i i t Tt n t tn (4) where tiprovider,CP (week) weekly cost [min/week] adopting CP nd assuming i as the provider all week long a Copyright © 2012 SciRes. JTTs 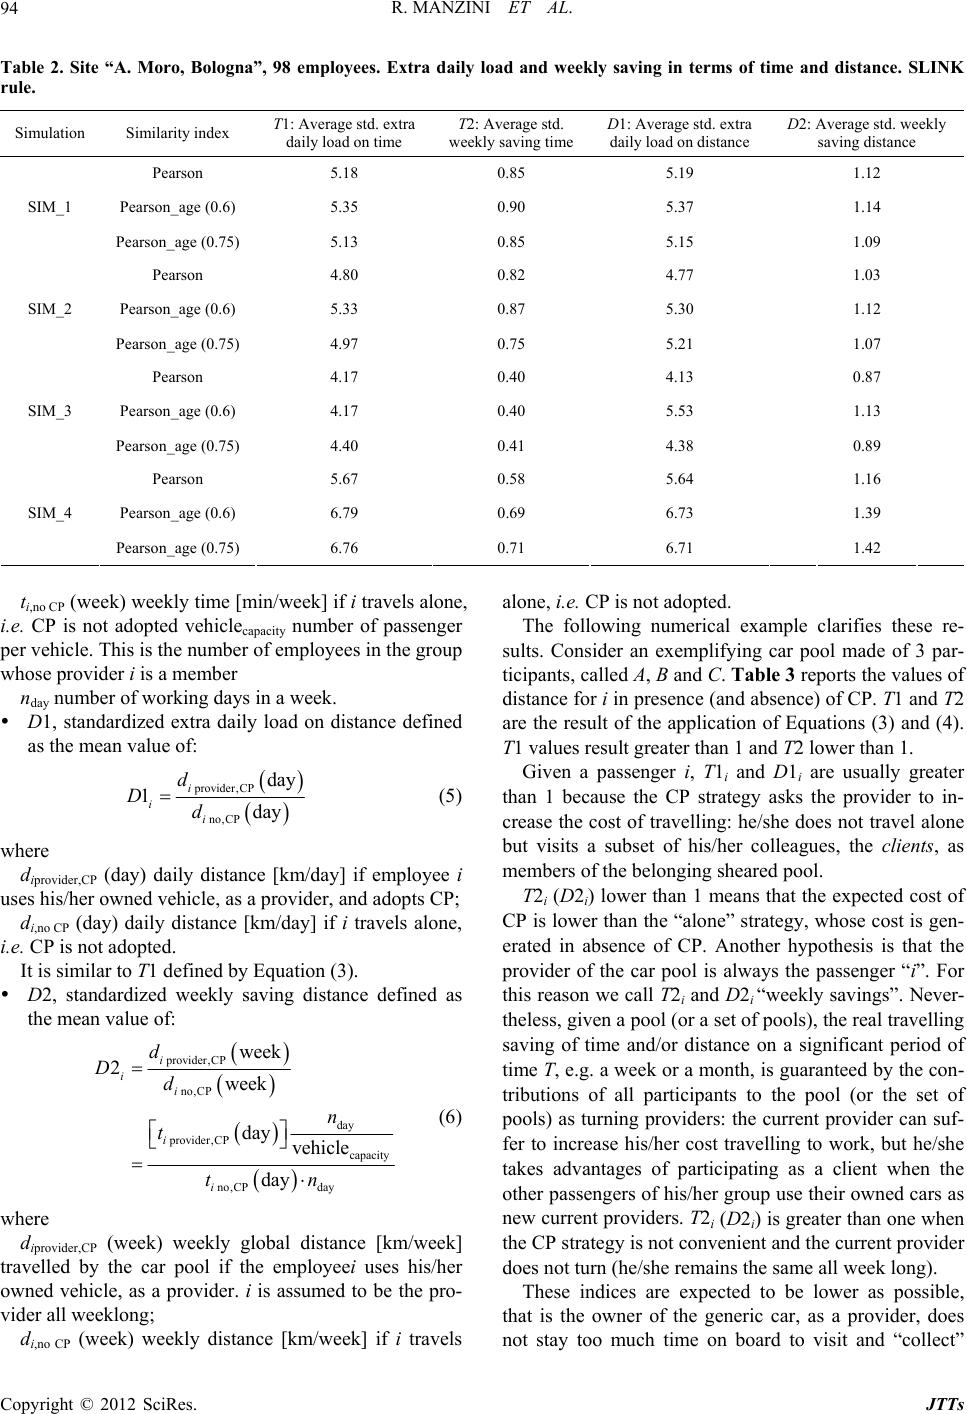 R. MANZINI ET AL. 94 Table 2. Site “A. Moro, Bologna”, 98 employees. Extra daily load and weekly saving in terms of time and distance. SLINK rule. Simulation Similarity index T1: Average std. extra daily load on time T2: Average std. weekly saving time D1: Average std. extra daily load on distance D2: Average std. weekly saving distance Pearson 5.18 0.85 5.19 1.12 Pearson_age (0.6) 5.35 0.90 5.37 1.14 SIM_1 Pearson_age (0.75) 5.13 0.85 5.15 1.09 Pearson 4.80 0.82 4.77 1.03 Pearson_age (0.6) 5.33 0.87 5.30 1.12 SIM_2 Pearson_age (0.75) 4.97 0.75 5.21 1.07 Pearson 4.17 0.40 4.13 0.87 Pearson_age (0.6) 4.17 0.40 5.53 1.13 SIM_3 Pearson_age (0.75) 4.40 0.41 4.38 0.89 Pearson 5.67 0.58 5.64 1.16 Pearson_age (0.6) 6.79 0.69 6.73 1.39 SIM_4 Pearson_age (0.75) 6.76 0.71 6.71 1.42 ti,no CP (week) weekly time [min/week] if i travels alone, i.e. CP is not adopted vehiclecapacity number of passenger per vehicle. This is the number of employees in the group whose provider i is a member nday number of working days in a week. D1, standardized extra daily load on distance defined as the mean value of: provider,CP no,CP day 1day i i i d Dd (5) where diprovider,CP (day) daily distance [km/day] if employee i uses his/her owned vehicle, as a provider, and adopts CP; di,no CP (day) daily distance [km/day] if i travels alone, i.e. CP is not adopted. It is similar to T1 defined by Equation (3). D2, standardized weekly saving distance defined as the mean value of: provider,CP no,CP day provider,CP capacity no,CP day week 2week day vehicle day i i i i i d Dd n t tn (6) where diprovider,CP (week) weekly global distance [km/week] travelled by the car pool if the employeei uses his/her owned vehicle, as a provider. i is assumed to be the pro- vider all weeklong; di,no CP (week) weekly distance [km/week] if i travels alone, i.e. CP is not adopted. The following numerical example clarifies these re- sults. Consider an exemplifying car pool made of 3 par- ticipants, called A, B and C. Table 3 reports the values of distance for i in presence (and absence) of CP. T1 and T2 are the result of the application of Equations (3) and (4). T1 values result greater than 1 and T2 lower than 1. Given a passenger i, T1i and D1i are usually greater than 1 because the CP strategy asks the provider to in- crease the cost of travelling: he/she does not travel alone but visits a subset of his/her colleagues, the clients, as members of the belonging sheared pool. T2i (D2i) lower than 1 means that the expected cost of CP is lower than the “alone” strategy, whose cost is gen- erated in absence of CP. Another hypothesis is that the provider of the car pool is always the passenger “i”. For this reason we call T2i and D2i “weekly savings”. Never- theless, given a pool (or a set of pools), the real travelling saving of time and/or distance on a significant period of time T, e.g. a week or a month, is guaranteed by the con- tributions of all participants to the pool (or the set of pools) as turning providers: the current provider can suf- fer to increase his/her cost travelling to work, but he/she takes advantages of participating as a client when the other passengers of his/her group use their owned cars as new current providers. T2i (D2i) is greater than one when the CP strategy is not convenient and the current provider does not turn (he/she remains the same all week long). These indices are expected to be lower as possible, that is the owner of the generic car, as a provider, does not stay too much time on board to visit and “collect” Copyright © 2012 SciRes. JTTs 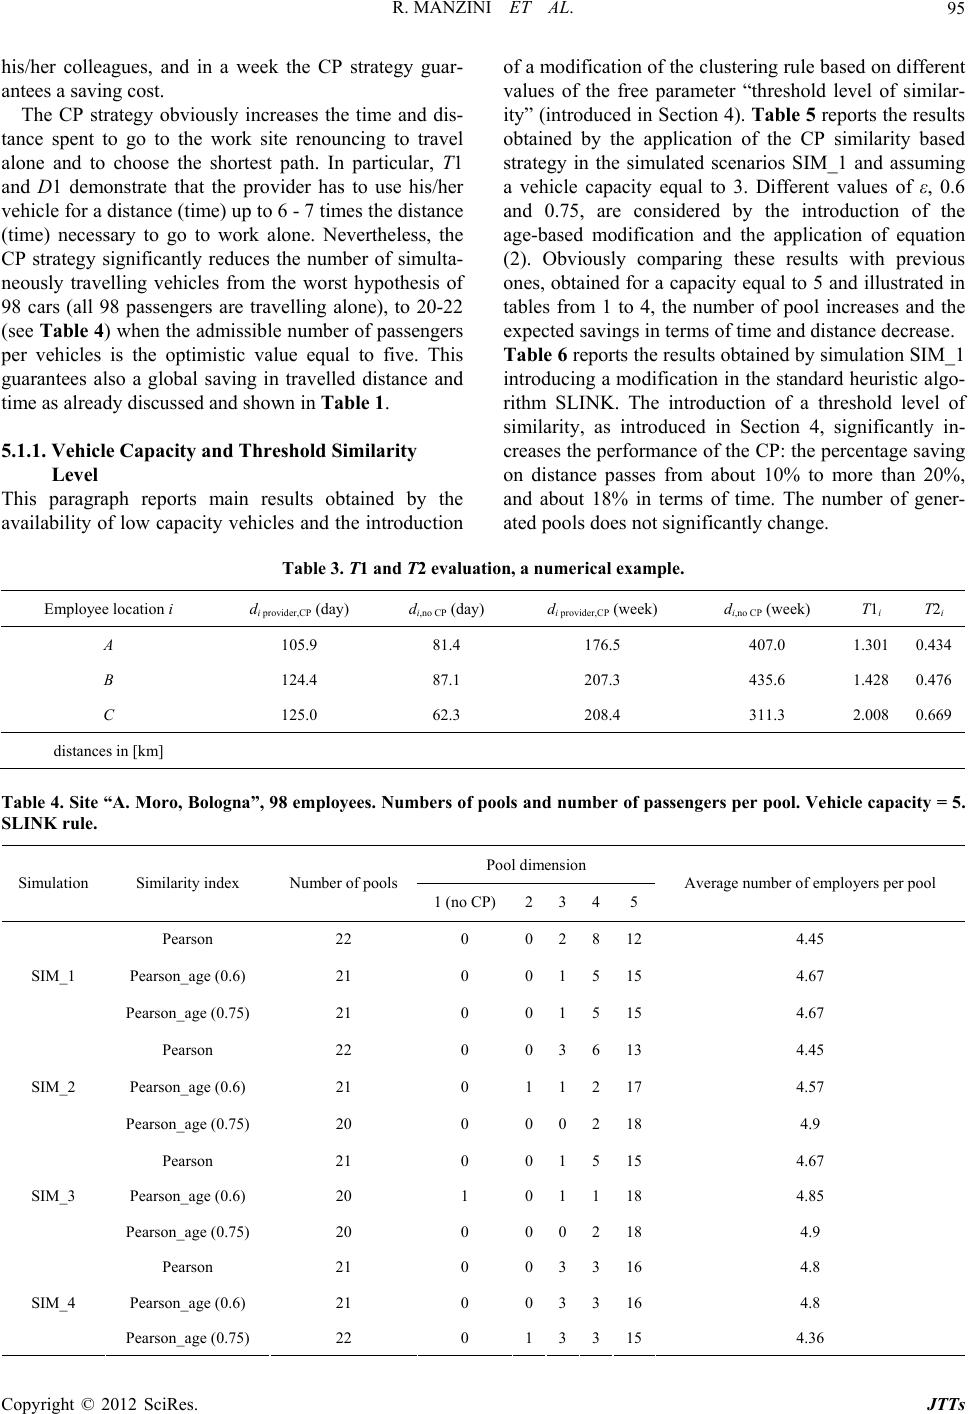 R. MANZINI ET AL. 95 his/her colleagues, and in a week the CP strategy guar- antees a saving cost. The CP strategy obviously increases the time and dis- tance spent to go to the work site renouncing to travel alone and to choose the shortest path. In particular, T1 and D1 demonstrate that the provider has to use his/her vehicle for a distance (time) up to 6 - 7 times the distance (time) necessary to go to work alone. Nevertheless, the CP strategy significantly reduces the number of simulta- neously travelling vehicles from the worst hypothesis of 98 cars (all 98 passengers are travelling alone), to 20-22 (see Tab le 4) when the admissible number of passengers per vehicles is the optimistic value equal to five. This guarantees also a global saving in travelled distance and time as already discussed and shown in Table 1. 5.1.1. Vehicl e Ca pacity and Threshold Similarity Level This paragraph reports main results obtained by the availability of low capacity vehicles and the introduction of a modification of the clustering rule based on different values of the free parameter “threshold level of similar- ity” (introduced in Section 4). Table 5 reports the results obtained by the application of the CP similarity based strategy in the simulated scenarios SIM_1 and assuming a vehicle capacity equal to 3. Different values of ε, 0.6 and 0.75, are considered by the introduction of the age-based modification and the application of equation (2). Obviously comparing these results with previous ones, obtained for a capacity equal to 5 and illustrated in tables from 1 to 4, the number of pool increases and the expected savings in terms of time and distance decrease. Table 6 reports the results obtained by simulation SIM_1 introducing a modification in the standard heuristic algo- rithm SLINK. The introduction of a threshold level of similarity, as introduced in Section 4, significantly in- creases the performance of the CP: the percentage saving on distance passes from about 10% to more than 20%, and about 18% in terms of time. The number of gener- ated pools does not significantly change. Table 3. T1 and T2 evaluation, a nu m erical example. Employee location i di provider,CP (day) d i,no CP (day) d i provider,CP (week) d i,no CP (week) T1i T2i A 105.9 81.4 176.5 407.0 1.3010.434 B 124.4 87.1 207.3 435.6 1.4280.476 C 125.0 62.3 208.4 311.3 2.0080.669 distances in [km] Table 4. Site “A. Moro, Bologna”, 98 employees. Numbers of pools and number of passengers per pool. Vehicle capacity = 5. SLINK rule. Pool dimension Simulation Similarity index Number of pools 1 (no CP)2345 Average number of employers per pool Pearson 22 0 028124.45 Pearson_age (0.6) 21 0 015154.67 SIM_1 Pearson_age (0.75) 21 0 015154.67 Pearson 22 0 036134.45 Pearson_age (0.6) 21 0 112174.57 SIM_2 Pearson_age (0.75) 20 0 002184.9 Pearson 21 0 015154.67 Pearson_age (0.6) 20 1 011184.85 SIM_3 Pearson_age (0.75) 20 0 002184.9 Pearson 21 0 033164.8 Pearson_age (0.6) 21 0 033164.8 SIM_4 Pearson_age (0.75) 22 0 133154.36 Copyright © 2012 SciRes. JTTs 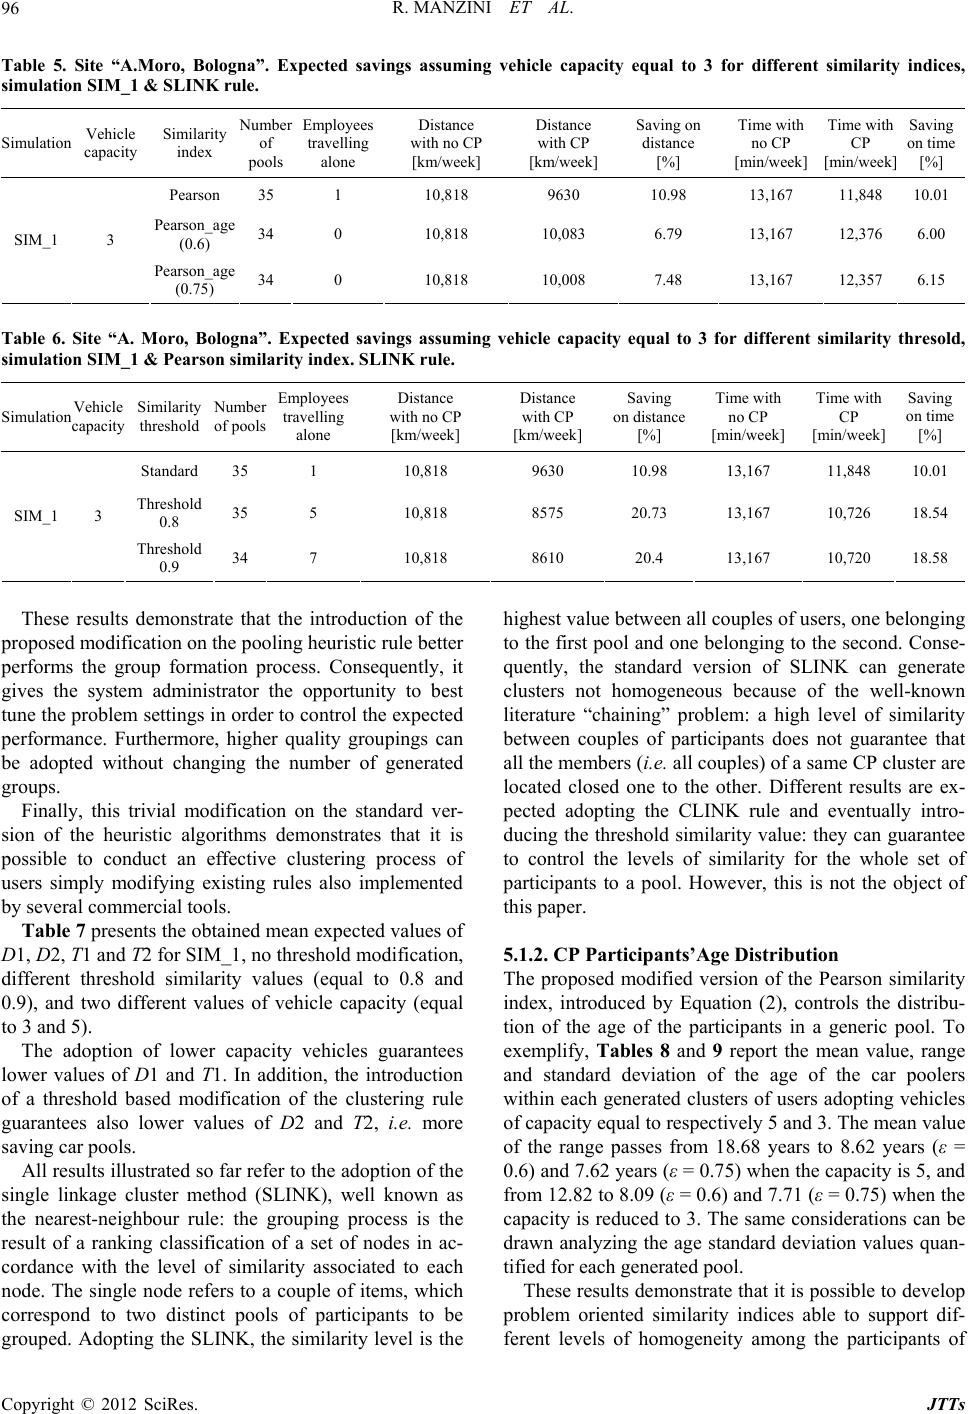 R. MANZINI ET AL. 96 Table 5. Site “A.Moro, Bologna”. Expected savings assuming vehicle capacity equal to 3 for different similarity indices, simulation SIM_1 & SLINK rule. Simulation Vehicle capacity Similarity index Numbe of pools Employees travelling alone Distance with no CP [km/week] Distance with CP [km/week] Saving on distance [%] Time with no CP [min/week] Time with CP [min/week] Saving on time [%] Pearson 35 1 10,818 9630 10.98 13,167 11,84810.01 Pearson_age (0.6) 34 0 10,818 10,083 6.79 13,167 12,3766.00 SIM_1 3 Pearson_age (0.75) 34 0 10,818 10,008 7.48 13,167 12,3576.15 Table 6. Site “A. Moro, Bologna”. Expected savings assuming vehicle capacity equal to 3 for different similarity thresold, simulation SIM_1 & Pearson similarity index. SLINK rule. Simulation Vehicle capacity Similarity threshold Number of pools Employees travelling alone Distance with no CP [km/week] Distance with CP [km/week] Saving on distance [%] Time with no CP [min/week] Time with CP [min/week] Saving on time [%] Standard 35 1 10,818 9630 10.98 13,167 11,848 10.01 Threshold 0.8 35 5 10,818 8575 20.73 13,167 10,726 18.54 SIM_1 3 Threshold 0.9 34 7 10,818 8610 20.4 13,167 10,720 18.58 These results demonstrate that the introduction of the proposed modification on the pooling heuristic rule better performs the group formation process. Consequently, it gives the system administrator the opportunity to best tune the problem settings in order to control the expected performance. Furthermore, higher quality groupings can be adopted without changing the number of generated groups. Finally, this trivial modification on the standard ver- sion of the heuristic algorithms demonstrates that it is possible to conduct an effective clustering process of users simply modifying existing rules also implemented by several commercial tools. Table 7 presents the obtained mean expected values of D1, D2, T1 and T2 for SIM_1, no threshold modification, different threshold similarity values (equal to 0.8 and 0.9), and two different values of vehicle capacity (equal to 3 and 5). The adoption of lower capacity vehicles guarantees lower values of D1 and T1. In addition, the introduction of a threshold based modification of the clustering rule guarantees also lower values of D2 and T2, i.e. more saving car pools. All results illustrated so far refer to the adoption of the single linkage cluster method (SLINK), well known as the nearest-neighbour rule: the grouping process is the result of a ranking classification of a set of nodes in ac- cordance with the level of similarity associated to each node. The single node refers to a couple of items, which correspond to two distinct pools of participants to be grouped. Adopting the SLINK, the similarity level is the highest value between all couples of users, one belonging to the first pool and one belonging to the second. Conse- quently, the standard version of SLINK can generate clusters not homogeneous because of the well-known literature “chaining” problem: a high level of similarity between couples of participants does not guarantee that all the members (i.e. all couples) of a same CP cluster are located closed one to the other. Different results are ex- pected adopting the CLINK rule and eventually intro- ducing the threshold similarity value: they can guarantee to control the levels of similarity for the whole set of participants to a pool. However, this is not the object of this paper. 5.1.2. CP Participa nts’Age Di st ri bution The proposed modified version of the Pearson similarity index, introduced by Equation (2), controls the distribu- tion of the age of the participants in a generic pool. To exemplify, Tables 8 and 9 report the mean value, range and standard deviation of the age of the car poolers within each generated clusters of users adopting vehicles of capacity equal to respectively 5 and 3. The mean value of the range passes from 18.68 years to 8.62 years (ε = 0.6) and 7.62 years (ε = 0.75) when the capacity is 5, and from 12.82 to 8.09 (ε = 0.6) and 7.71 (ε = 0.75) when the capacity is reduced to 3. The same considerations can be drawn analyzing the age standard deviation values quan- tified for each generated pool. These results demonstrate that it is possible to develop problem oriented similarity indices able to support dif- ferent levels of homogeneity among the participants of Copyright © 2012 SciRes. JTTs 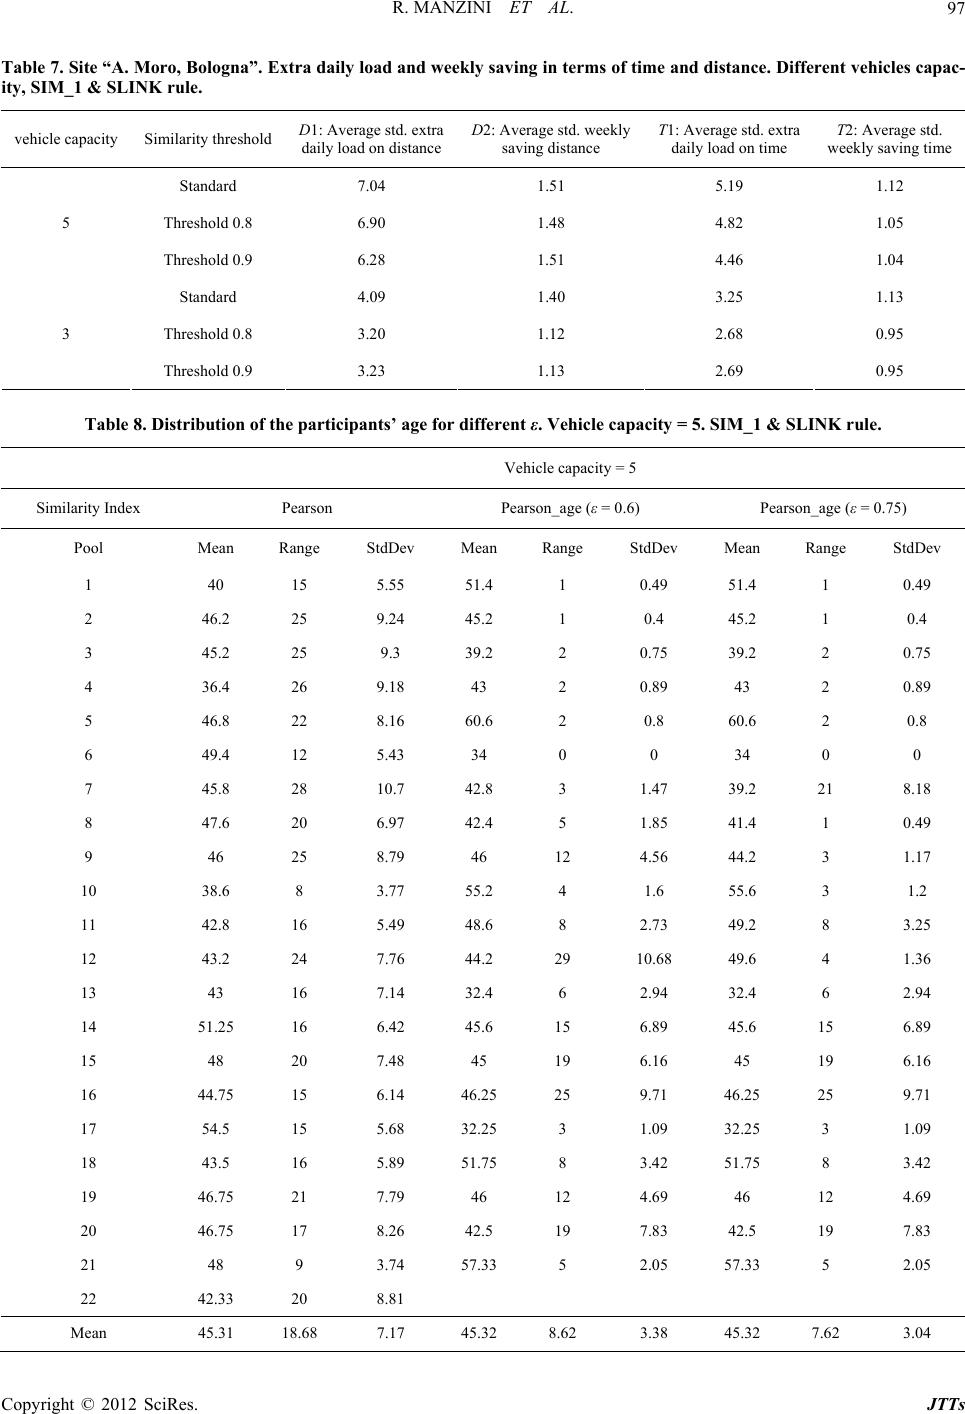 R. MANZINI ET AL. 97 Table 7. Site “A. Moro, Bologna”. Extra daily load and weekly saving in terms of time and distance. Different vehicles capac- ity, SIM_1 & SLINK rule. vehicle capacity Similarity threshold D1: Average std. extra daily load on distance D2: Average std. weekly saving distance T1: Average std. extra daily load on time T2: Average std. weekly saving time Standard 7.04 1.51 5.19 1.12 Threshold 0.8 6.90 1.48 4.82 1.05 5 Threshold 0.9 6.28 1.51 4.46 1.04 Standard 4.09 1.40 3.25 1.13 Threshold 0.8 3.20 1.12 2.68 0.95 3 Threshold 0.9 3.23 1.13 2.69 0.95 Table 8. Distribution of the participants’ age for different ε. Vehicle capacity = 5. SIM_1 & SLINK rule. Vehicle capacity = 5 Similarity Index Pearson Pearson_age (ε = 0.6) Pearson_age (ε = 0.75) Pool Mean Range StdDev Mean Range StdDev Mean Range StdDev 1 40 15 5.55 51.4 1 0.49 51.4 1 0.49 2 46.2 25 9.24 45.2 1 0.4 45.2 1 0.4 3 45.2 25 9.3 39.2 2 0.75 39.2 2 0.75 4 36.4 26 9.18 43 2 0.89 43 2 0.89 5 46.8 22 8.16 60.6 2 0.8 60.6 2 0.8 6 49.4 12 5.43 34 0 0 34 0 0 7 45.8 28 10.7 42.8 3 1.47 39.2 21 8.18 8 47.6 20 6.97 42.4 5 1.85 41.4 1 0.49 9 46 25 8.79 46 12 4.56 44.2 3 1.17 10 38.6 8 3.77 55.2 4 1.6 55.6 3 1.2 11 42.8 16 5.49 48.6 8 2.73 49.2 8 3.25 12 43.2 24 7.76 44.2 29 10.68 49.6 4 1.36 13 43 16 7.14 32.4 6 2.94 32.4 6 2.94 14 51.25 16 6.42 45.6 15 6.89 45.6 15 6.89 15 48 20 7.48 45 19 6.16 45 19 6.16 16 44.75 15 6.14 46.25 25 9.71 46.25 25 9.71 17 54.5 15 5.68 32.25 3 1.09 32.25 3 1.09 18 43.5 16 5.89 51.75 8 3.42 51.75 8 3.42 19 46.75 21 7.79 46 12 4.69 46 12 4.69 20 46.75 17 8.26 42.5 19 7.83 42.5 19 7.83 21 48 9 3.74 57.33 5 2.05 57.33 5 2.05 22 42.33 20 8.81 Mean 45.31 18.68 7.17 45.32 8.62 3.38 45.32 7.62 3.04 Copyright © 2012 SciRes. JTTs 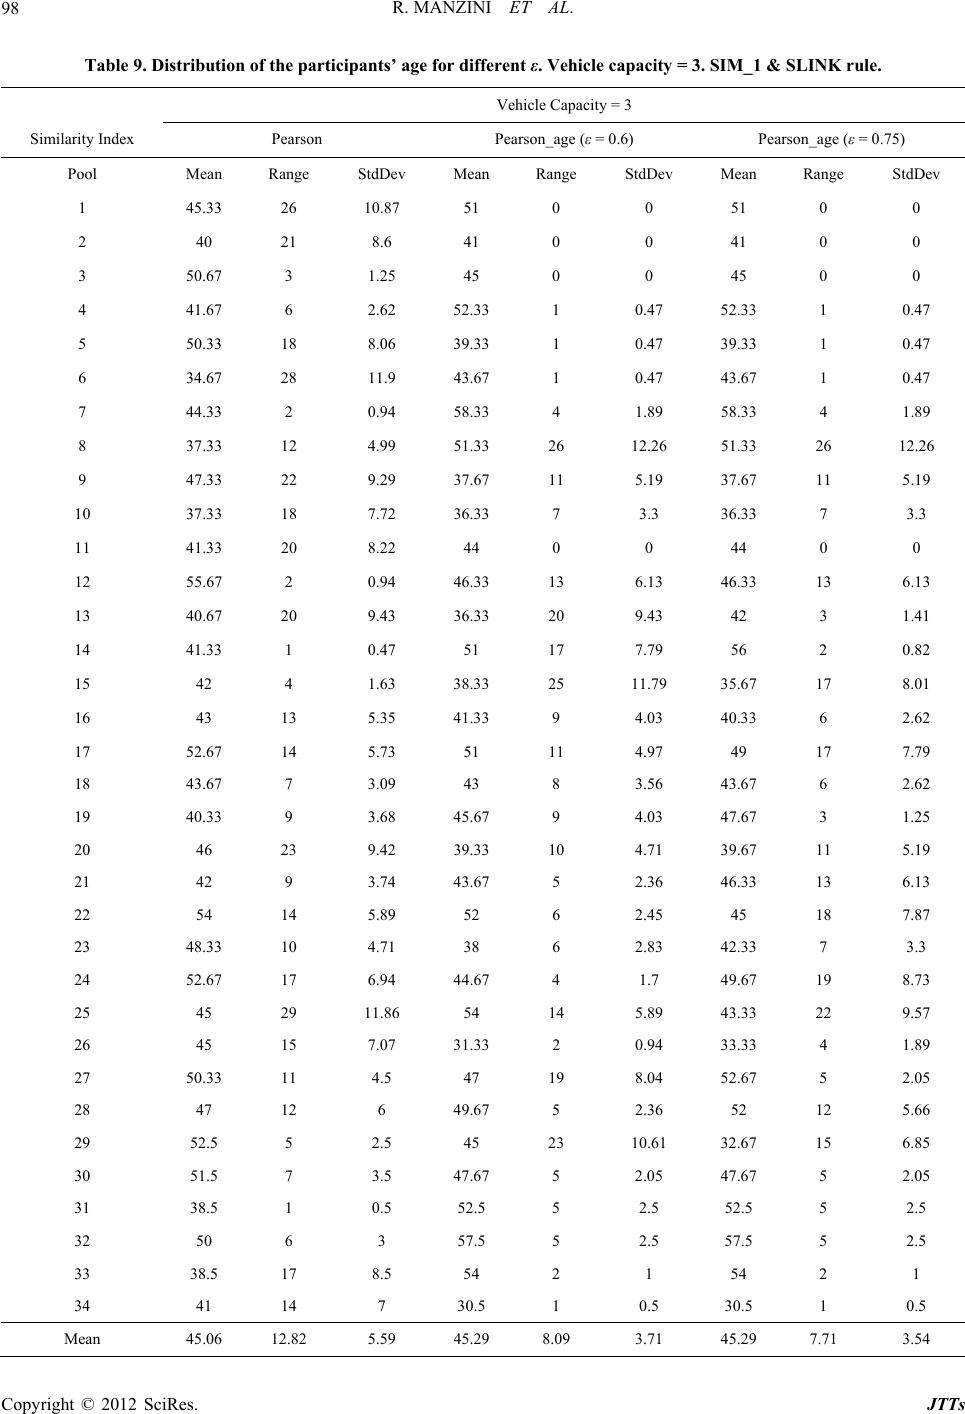 R. MANZINI ET AL. 98 Table 9. Distribution of the participants’ age for different ε. Vehicle capacity = 3. SIM_1 & SLINK rule. Vehicle Capacity = 3 Similarity Index Pearson Pearson_age (ε = 0.6) Pearson_age (ε = 0.75) Pool Mean Range StdDev Mean Range StdDev Mean Range StdDev 1 45.33 26 10.87 51 0 0 51 0 0 2 40 21 8.6 41 0 0 41 0 0 3 50.67 3 1.25 45 0 0 45 0 0 4 41.67 6 2.62 52.33 1 0.47 52.33 1 0.47 5 50.33 18 8.06 39.33 1 0.47 39.33 1 0.47 6 34.67 28 11.9 43.67 1 0.47 43.67 1 0.47 7 44.33 2 0.94 58.33 4 1.89 58.33 4 1.89 8 37.33 12 4.99 51.33 26 12.26 51.33 26 12.26 9 47.33 22 9.29 37.67 11 5.19 37.67 11 5.19 10 37.33 18 7.72 36.33 7 3.3 36.33 7 3.3 11 41.33 20 8.22 44 0 0 44 0 0 12 55.67 2 0.94 46.33 13 6.13 46.33 13 6.13 13 40.67 20 9.43 36.33 20 9.43 42 3 1.41 14 41.33 1 0.47 51 17 7.79 56 2 0.82 15 42 4 1.63 38.33 25 11.79 35.67 17 8.01 16 43 13 5.35 41.33 9 4.03 40.33 6 2.62 17 52.67 14 5.73 51 11 4.97 49 17 7.79 18 43.67 7 3.09 43 8 3.56 43.67 6 2.62 19 40.33 9 3.68 45.67 9 4.03 47.67 3 1.25 20 46 23 9.42 39.33 10 4.71 39.67 11 5.19 21 42 9 3.74 43.67 5 2.36 46.33 13 6.13 22 54 14 5.89 52 6 2.45 45 18 7.87 23 48.33 10 4.71 38 6 2.83 42.33 7 3.3 24 52.67 17 6.94 44.67 4 1.7 49.67 19 8.73 25 45 29 11.86 54 14 5.89 43.33 22 9.57 26 45 15 7.07 31.33 2 0.94 33.33 4 1.89 27 50.33 11 4.5 47 19 8.04 52.67 5 2.05 28 47 12 6 49.67 5 2.36 52 12 5.66 29 52.5 5 2.5 45 23 10.61 32.67 15 6.85 30 51.5 7 3.5 47.67 5 2.05 47.67 5 2.05 31 38.5 1 0.5 52.5 5 2.5 52.5 5 2.5 32 50 6 3 57.5 5 2.5 57.5 5 2.5 33 38.5 17 8.5 54 2 1 54 2 1 34 41 14 7 30.5 1 0.5 30.5 1 0.5 Mean 45.06 12.82 5.59 45.29 8.09 3.71 45.29 7.71 3.54 Copyright © 2012 SciRes. JTTs 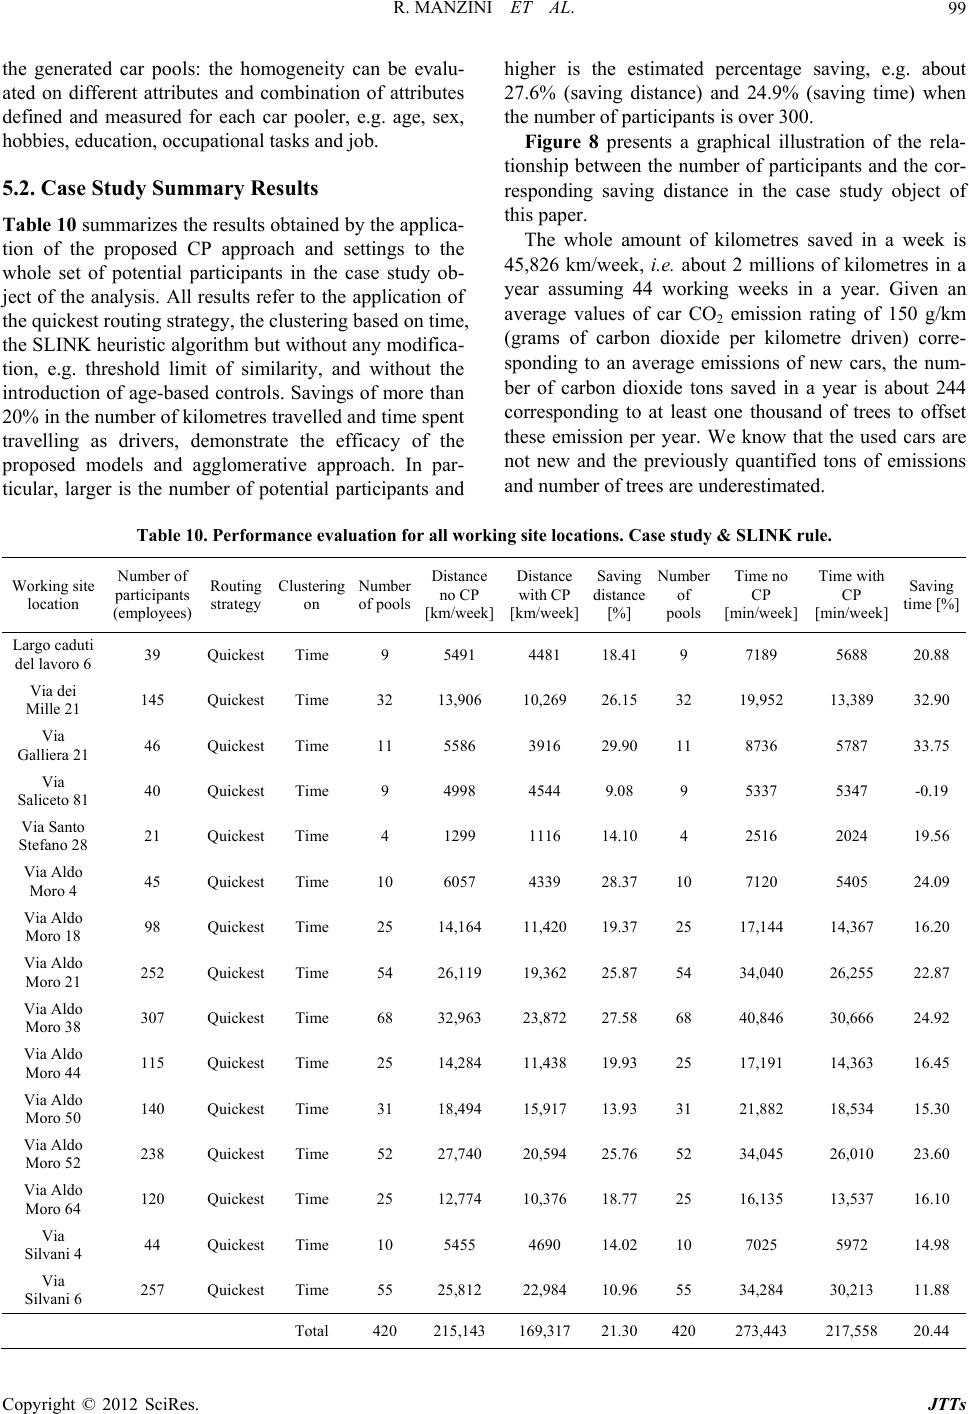 R. MANZINI ET AL. Copyright © 2012 SciRes. JTTs 99 the generated car pools: the homogeneity can be evalu- ated on different attributes and combination of attributes defined and measured for each car pooler, e.g. age, sex, hobbies, education, occupational tasks and job. 5.2. Case Study Summary Results Table 10 summarizes the results obtained by the applica- tion of the proposed CP approach and settings to the whole set of potential participants in the case study ob- ject of the analysis. All results refer to the application of the quickest routing strategy, the clustering based on time, the SLINK heuristic algorithm but without any modifica- tion, e.g. threshold limit of similarity, and without the introduction of age-based controls. Savings of more than 20% in the number of kilometres travelled and time spent travelling as drivers, demonstrate the efficacy of the proposed models and agglomerative approach. In par- ticular, larger is the number of potential participants and higher is the estimated percentage saving, e.g. about 27.6% (saving distance) and 24.9% (saving time) when the number of participants is over 300. Figure 8 presents a graphical illustration of the rela- tionship between the number of participants and the cor- responding saving distance in the case study object of this paper. The whole amount of kilometres saved in a week is 45,826 km/week, i.e. about 2 millions of kilometres in a year assuming 44 working weeks in a year. Given an average values of car CO2 emission rating of 150 g/km (grams of carbon dioxide per kilometre driven) corre- sponding to an average emissions of new cars, the num- ber of carbon dioxide tons saved in a year is about 244 corresponding to at least one thousand of trees to offset these emission per year. We know that the used cars are not new and the previously quantified tons of emissions and number of trees are underestimated. Table 10. Performance evaluation for all working site locations. Case study & SLINK rule. Working site location Number of participants (employees) Routing strategy Clustering on Num er of pools Distance no CP [km/week] Distance with CP [km/week] Saving distance [%] Num er of pools Time no CP [min/week] Time with CP [min/week] Saving time [%] Largo caduti del lavoro 6 39 Quickest Time 9 5491 4481 18.419 7189 5688 20.88 Via dei Mille 21 145 Quickest Time 32 13,906 10,269 26.1532 19,952 13,389 32.90 Via Galliera 21 46 Quickest Time 11 5586 3916 29.9011 8736 5787 33.75 Via Saliceto 81 40 Quickest Time 9 4998 4544 9.08 9 5337 5347 -0.19 Via Santo Stefano 28 21 Quickest Time 4 1299 1116 14.104 2516 2024 19.56 Via Aldo Moro 4 45 Quickest Time 10 6057 4339 28.3710 7120 5405 24.09 Via Aldo Moro 18 98 Quickest Time 25 14,164 11,420 19.3725 17,144 14,367 16.20 Via Aldo Moro 21 252 Quickest Time 54 26,119 19,362 25.8754 34,040 26,255 22.87 Via Aldo Moro 38 307 Quickest Time 68 32,963 23,872 27.5868 40,846 30,666 24.92 Via Aldo Moro 44 115 Quickest Time 25 14,284 11,438 19.9325 17,191 14,363 16.45 Via Aldo Moro 50 140 Quickest Time 31 18,494 15,917 13.9331 21,882 18,534 15.30 Via Aldo Moro 52 238 Quickest Time 52 27,740 20,594 25.7652 34,045 26,010 23.60 Via Aldo Moro 64 120 Quickest Time 25 12,774 10,376 18.7725 16,135 13,537 16.10 Via Silvani 4 44 Quickest Time 10 5455 4690 14.0210 7025 5972 14.98 Via Silvani 6 257 Quickest Time 55 25,812 22,984 10.9655 34,284 30,213 11.88 Total 420 215,143 169,317 21.30420 273,443 217,558 20.44 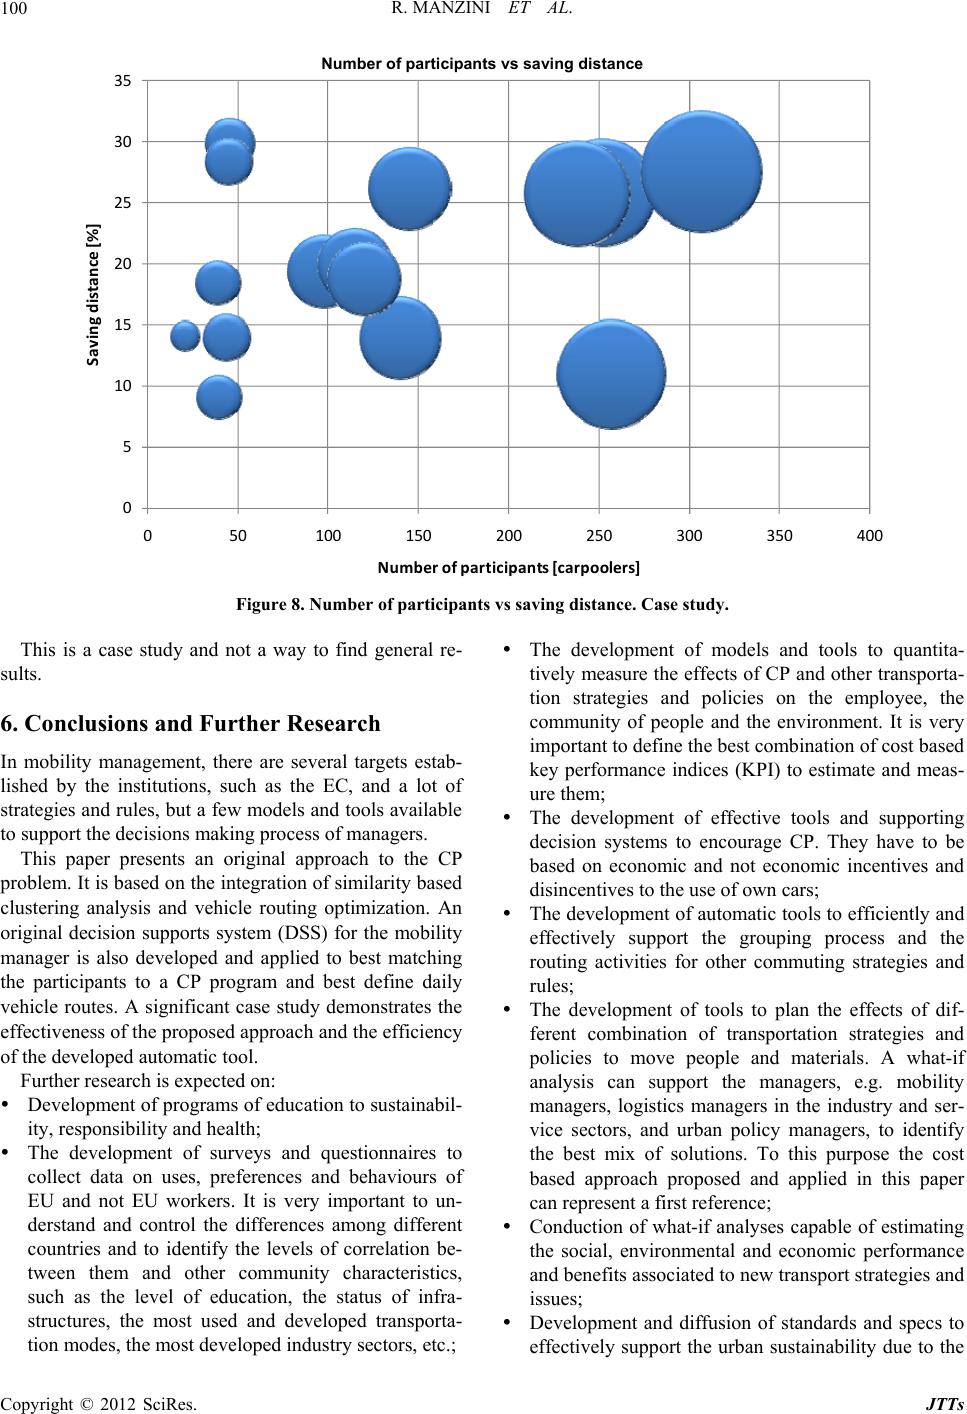 R. MANZINI ET AL. 100 Number of participants vs saving distance 0 5 10 15 20 25 30 35 050100150 200250300 350400 Saving distance [%] Number of participants [carpoolers] Figure 8. Number of participants vs saving distance. Case study. This is a case study and not a way to find general re- sults. 6. Conclusions and Further Research In mobility management, there are several targets estab- lished by the institutions, such as the EC, and a lot of strategies and rules, but a few models and tools available to support the decisions making process of managers. This paper presents an original approach to the CP problem. It is based on the integration of similarity based clustering analysis and vehicle routing optimization. An original decision supports system (DSS) for the mobility manager is also developed and applied to best matching the participants to a CP program and best define daily vehicle routes. A significant case study demonstrates the effectiveness of the proposed approach and the efficiency of the developed automatic tool. Further research is expected on: Development of programs of education to sustainabil- ity, responsibility and health; The development of surveys and questionnaires to collect data on uses, preferences and behaviours of EU and not EU workers. It is very important to un- derstand and control the differences among different countries and to identify the levels of correlation be- tween them and other community characteristics, such as the level of education, the status of infra- structures, the most used and developed transporta- tion modes, the most developed industry sectors, etc.; The development of models and tools to quantita- tively measure the effects of CP and other transporta- tion strategies and policies on the employee, the community of people and the environment. It is very important to define the best combination of cost based key performance indices (KPI) to estimate and meas- ure them; The development of effective tools and supporting decision systems to encourage CP. They have to be based on economic and not economic incentives and disincentives to the use of own cars; The development of automatic tools to efficiently and effectively support the grouping process and the routing activities for other commuting strategies and rules; The development of tools to plan the effects of dif- ferent combination of transportation strategies and policies to move people and materials. A what-if analysis can support the managers, e.g. mobility managers, logistics managers in the industry and ser- vice sectors, and urban policy managers, to identify the best mix of solutions. To this purpose the cost based approach proposed and applied in this paper can represent a first reference; Conduction of what-if analyses capable of estimating the social, environmental and economic performance and benefits associated to new transport strategies and issues; Development and diffusion of standards and specs to effectively support the urban sustainability due to the Copyright © 2012 SciRes. JTTs  R. MANZINI ET AL. 101 management of transportation issues. REFERENCES [1] Eurostat European Commission, “Energy, Transport and Environment Indicators,” 2009. [2] R. Baldacci, V. Maniezzo and A. Mingozzi, “An Exact Method for the Car Pooling Problem Based on Lagran- gian Column Generation,” Operations Research, Vol. 53, No. 3, 2004, pp. 422-439. doi:10.1287/opre.1030.0106 [3] World Business Council for Sustainable Development, “The Sustainable Mobility Project,” Full Report, 1 June 2004. [4] J. Sousanis, “World Vehicle Population Tops 1 Billion Units,” Ward Auto World, 2011. [5] S. Yan and C. Y. Chen, “An Optimization Model and a Solution Algorithm for the Many-to-Many Car Pooling Problem,” Annals of Operations Research, Vol. 191, No. 1, 2011, pp. 37-71. doi:10.1007/s10479-011-0948-6 [6] Y. Guo, G. Goncalves and T. Hsu, “A Clustering Ant Colony Algorithm for the Long-Term Car Pooling Prob- lem,” International Conference on Swarm Intelligence, Cergy, 14-15 June 2011, pp. 1-10. [7] A. Garling and A. Johansson, “Household Choices of Car-Use Reduction Measures,” Transportation Research, Part A: Policy and Practice, Vol. 34, No. 5, 2000, pp. 309-20. doi:10.1016/S0965-8564(99)00039-7 [8] R. Manzini and F. Bindi, “Strategic Design and Opera- tional Management Optimization of a Multi Stage Physi- cal Distribution System,” Transportation Research Part E: Logistics and Transportation Review, Vol. 45, No. 6, 2009, pp. 915-936. doi:10.1016/j.tre.2009.04.011 [9] R. Manzini, M. Bortolini, M. Gamberi and M. Montecchi, “A Supporting Decision Tool for the Integrated Planning of a Logistic Network,” In: S. Renko, Ed., Supply Chain Management-New Perspectives, InTech, Rijeka, 2011. http://www.intechopen.com/books/supply-chain-manage ment-new-perspectives/a-supporting-decision-tool-for-the -integrated-planning-of-a-logistic-network [10] E. Ferrari, R. Manzini, A. Pareschi, A. Persona and A. Regattieri, “The Car Pooling Problem: Heuristic Algo- rithms Based on Savings Functions,” Journal of Ad- vanced Transportation, Vol. 37, No. 3, 2003, pp. 243-272. doi:10.1002/atr.5670370302 [11] EEA Report, “Climate for a Transport Change. TERM 2007: Indicators Tracking Transport and Environment in the European Union,” European Environment Agency, 2008. [12] Eurostat European Commission, “Panorama of Trans- port,” 2007. http://www.google.it/url?sa=t&rct=j&q=&esrc=s&source =web&cd=1&ved=0CDEQFjAA&url=http%3A%2F%2F epp.eurostat.ec.europa.eu%2Fcache%2FITY_OFFPUB% 2FKS-DA-07-001%2FEN%2FKS-DA-07-001-EN.PDF& ei=JySET8izEun04QTMnoXbBw&usg=AFQjCNHQQ_q 5-r3k-24ao_E_cg8nJ1V_Zg&sig2=22d8lSfbuQFSKVAY TdWSyA [13] EEA Report, “Transport and Environment: On the Way to a New Common Transport Policy,” European Environ- ment Agency, 2007. [14] Eurobarometer, “Attitudes on Issues Related to EU Trans- port Policy: Analytical Report, the Gallup Organization,” European Commission, 2007. http://www.google.it/url?sa=t&rct=j&q=&esrc=s&source =web&cd=1&ved=0CDIQFjAA&url=http%3A%2F%2Fe c.europa.eu%2Fpublic_opinion%2Fflash%2Ffl_206b_en. pdf&ei=qySET6PBOqTN4QTY_6HIBw&usg=AFQjCN FX4i8KPfrvf5O5JD2Ke2iUWi-xUg&sig2=KnHMULWy 72Xh4jvvMHslow [15] UKERC, “Quick Hits: Car Clubs,” Environmental Change Institute, Oxford, 2007. [16] R. Manzini, F. Bindi and A. Pareschi, “The Threshold Value of Group Similarity in the Formation of Cellular Manufacturing System,” International Journal of Pro- duction Research, Vol. 48, No. 10, 2009, pp. 3029-3060. doi:10.1080/00207540802644860 [17] A. Villa, I. Cassarino and D. Antonelli, “Extending Group Technology to the Identification and the Analysis of En- terprise Networks,” International Journal of Production Research, Vol. 45, No. 17, 2007, pp. 3881-3892. [18] R. W. Calvo, F. de Luigi, P. Haastrup and V. Maniezzo, “A Distributed Geographic Information System for the Daily Car Pooling Problem,” Computers & Operations Research, Vol. 31, No. 13, 2004, pp. 2263-2278. doi:10.1016/S0305-0548(03)00186-2 [19] M. Naor, “On Fairness in the Carpool Problem,” Journal of Algorithms, Vol. 55, No. 1, 2005, pp. 93-98. doi:10.1016/j.jalgor.2004.05.001 [20] M. A. Vargas, J. Sefair, J. L. Walteros, A. L. Medaglia and L. Rivera, “Car Pooling Optimization: A Case Study in Strasbourg (France),” Proceedings of the 2008 IEEE Systems and Information Engineering Design Symposium, Vargas, 25 April 2008, pp. 89-94. [21] E. W. Dijkstra, “A Note on Two Problems in Connexion with Graphs,” Numerische Mathematik, Vol. 1, No. 1, 1959, pp. 269-271. doi:10.1007/BF01386390 Copyright © 2012 SciRes. JTTs
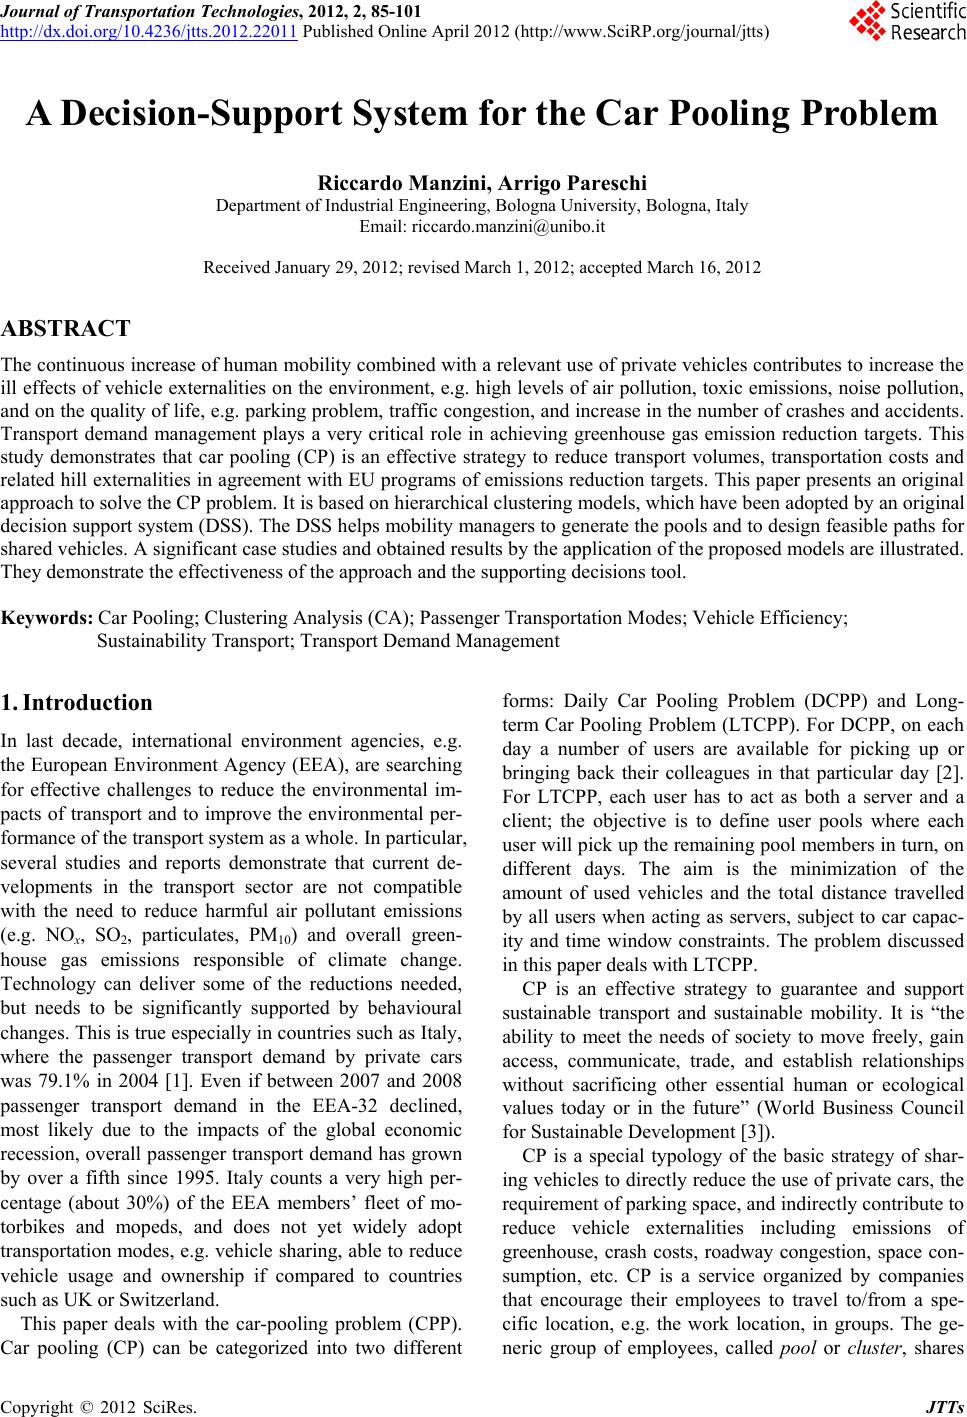
|