 J. Biomedical Science and Engineering, 2012, 5, 162-169 JBiSE http://dx.doi.org/10.4236/jbise.2012.54021 Published Online April 2012 (http://www.SciRP.org/journal/jbise/) Automatic determination of MS lesion subtypes based on fractal analysis in brain MR images Mahdi Mohamadkhanloo, Farzad Mehrabi, Abdolhamid Sohrabi Department of Medical Science, Aja University, Tehran, Iran Email: mahdi.khanlo@gmail.com, df_mehrabi2002@yahoo.com, sohrabind@gmail.com Received 29 November 2011; revised 25 December 2011; accepted 29 January 2012 ABSTRACT In this paper a novel approach based on fractal analysis has been proposed to determine MS lesions into two subtypes (i.e., Enhancing lesions (Acute), T1 “black holes” (chronic) lesions) in Fluid Attenuated Inversion Recovery (FLAIR) MR images, automati- cally. In the proposed method, firstly, MS lesion vox- els are segmented in FLAIR images using Entropy- Based EM Algorithm and Markov Random Field (MRF) model. Then, Fractal dimension of each lesion voxel is computed in FLAIR images and used with signal intensity features (T1-weighted, gadolinium enhanced T1-weighted, T2-weighted). Finally, a neu- ral network classifier is applied to feature vectors. Evaluation of the proposed method was performed by manual segmentation of chronic and acute lesions in gadolinium enhanced T1-weighted (Gad-E-T1-w) images by studying T1-weighted (T1-w) and T2- weighted (T2-w) images, using similarity criteria. The results showed a good correlation between the lesions segmented by the proposed method and by experts manually. Thus, the suggested method is useful to reduce the need for paramagnetic materials in con- trast enhanced MR imaging which is a routine pro- cedure for separation of acute and chronic lesions. Keywords: Multiple Sclerosis; MRI; Fractal Dimension; Lesion Subtype 1. INTRODUCTION Multiple sclerosis (MS) is the commonest idiopathic in- flammatory demyelinating disease of the central nervous system that predominantly affects young adults about 30 years. It changes the morphology and structure of the brain and in the most of case irreversible clinical disabi- lity. Much MS research has focused on CNS immune responses because a specific cause for MS has not been identified. One of the most important modalities of me- dical imaging that assist in the diagnosis and monitoring of MS is MRI. Recently, the study of MRI in MS has been flourishing in the field of research due to its ability in generating multiple images of the same tissue with different contrast mechanisms using different image ac- quisition protocols and parameters. In its application to MS, macroscopic areas of damage or loss of myelin with hyper or hypo intensities relative to the surrounding tis- sues are shown by MRI. Different MRI protocols in- cluding T1-weighted (T1-w), T2-weighted (T2-w), PD- weighted (PD-w), and fluid-attenuated inversion reco- very (FLAIR) T2 images are being investigated for im- proving the performance in the early inflammatory stage and in the advanced stage of the diseases [1]. Figure 1 shows a slice of a multi-parametric MRI of two MS pa- tients. The lesions appear as regions with increased sig- nal intensity on the T2-w and FLAIR images and de- creased signal intensity (hypointense) on the T1-w image. There are two major categories of lesions which can be identified with conventional MR imaging: acute lesions demonstrating blood-brain barrier leakage on contrast- enhanced MR imaging (enhancing lesions), chronic se- verely damaged lesions that are hypointense, so-called “black holes” on T1-w MR images [2]. Acute plaques appear with less signal changes in T1-w images due to more inflammation, edema, and little demyelination. The borders of acute plaques in T1-w images are vague and cannot be marginate well because they compared with white matter, will be Signal sointense or hypointense (less darkness). Gradually, the plaques become darker in T1-w images with progress in demyelination process and also chronicity of the disease. The lesions Borders be- come sharper with more demyelination and gliosis (re- placement of fibrous tissue instead of myelin and neuron) As a result of this process some chronic plaques become darker known as black holes. The signal intensity of these plaques will not change in enhanced T1-w images (by injection of the paramagnet contrast materials) and they will appear as hyperintense areas in T2-w images [3]. Ying Wu et al. [2], proposes Intensity-based statisti- cal k-nearest neighbor (k-NN) classification has com- bined with template-driven segmentation and partial OPEN ACCESS 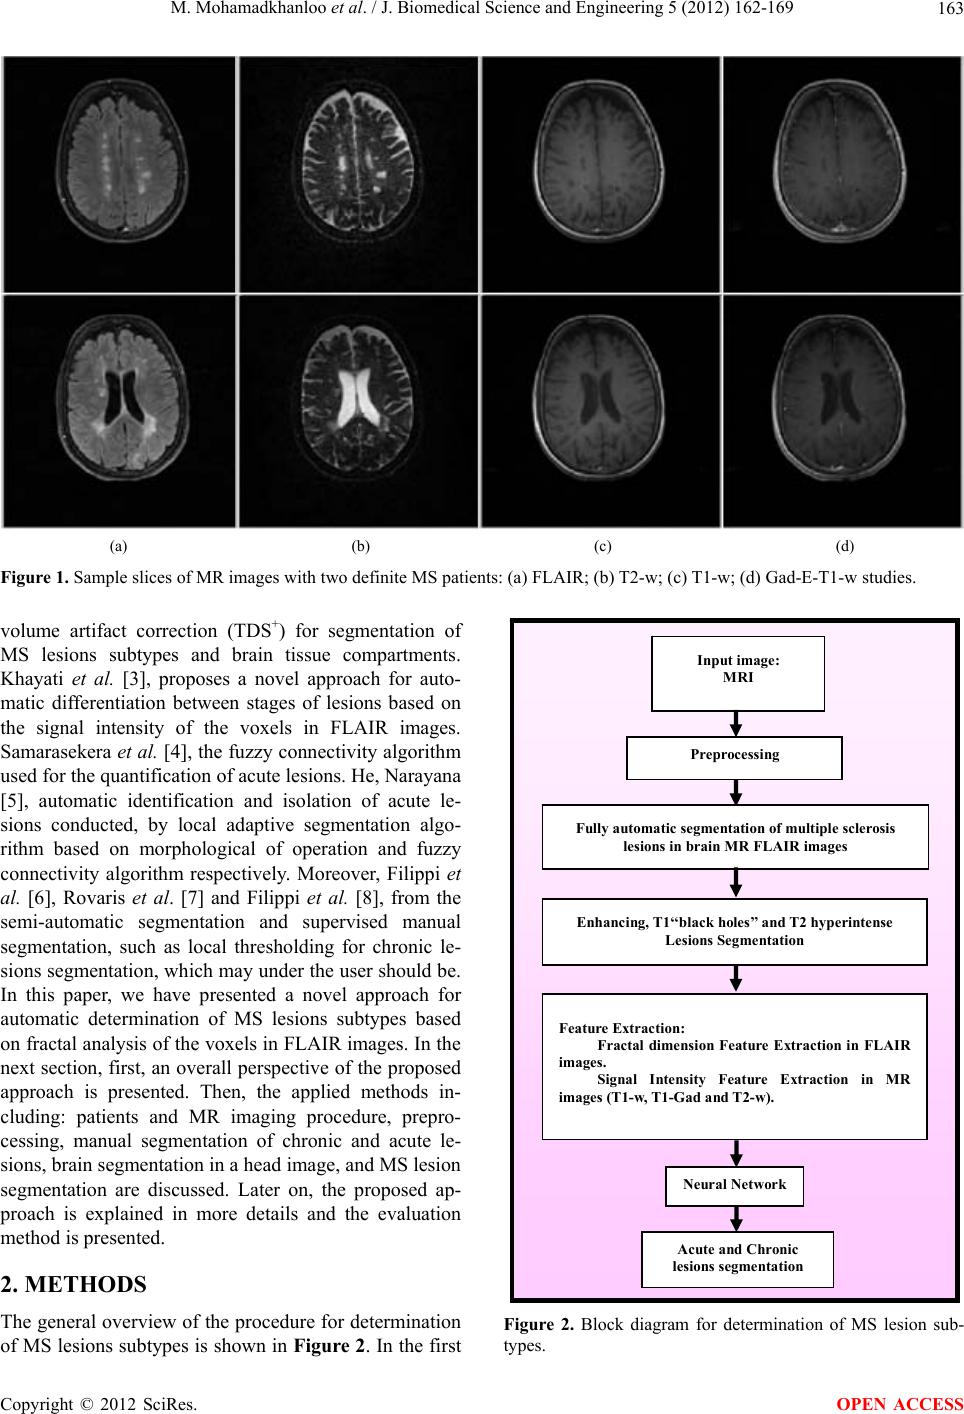 M. Mohamadkhanloo et al. / J. Biomedical Science and Engineering 5 (2012) 162-169 163 (a) (b) (c) (d) Figure 1. Sample slices of MR images with two definite MS patients: (a) FLAIR; (b) T2-w; (c) T1-w; (d) Gad-E-T1-w studies. volume artifact correction (TDS+) for segmentation of MS lesions subtypes and brain tissue compartments. Khayati et al. [3], proposes a novel approach for auto- matic differentiation between stages of lesions based on the signal intensity of the voxels in FLAIR images. Samarasekera et al. [4], the fuzzy connectivity algorithm used for the quantification of acute lesions. He, Narayana [5], automatic identification and isolation of acute le- sions conducted, by local adaptive segmentation algo- rithm based on morphological of operation and fuzzy connectivity algorithm respectively. Moreover, Filippi et al. [6], Rovaris et al. [7] and Filippi et al. [8], from the semi-automatic segmentation and supervised manual segmentation, such as local thresholding for chronic le- sions segmentation, which may under the user should be. In this paper, we have presented a novel approach for automatic determination of MS lesions subtypes based on fractal analysis of the voxels in FLAIR images. In the next section, first, an overall perspective of the proposed approach is presented. Then, the applied methods in- cluding: patients and MR imaging procedure, prepro- cessing, manual segmentation of chronic and acute le- sions, brain segmentation in a head image, and MS lesion segmentation are discussed. Later on, the proposed ap- proach is explained in more details and the evaluation method is presented. 2. METHODS The general overview of the procedure for determination of MS lesions subtypes is shown in Figure 2. In the first Inp ut i m ag e: MRI Preprocessing Enhancing, T1‘‘black holes’’ and T2 hyperintense Lesions Segmentation Feature Extraction: Fractal dimension Feature Extraction in FLAIR images. Signal Intensity Feature Extraction in MR images (T1-w, T1-Gad and T2-w). Fully automatic se gmentation of multiple sclerosis lesions in brain MR FLAI R images Neural Network Acute and Chronic lesions segme ntation Figure 2. Block diagram for determination of MS lesion sub- types. Copyright © 2012 SciRes. OPEN ACCESS  M. Mohamadkhanloo et al. / J. Biomedical Science and Engineering 5 (2012) 162-169 164 phase of the proposed method, pre-processing and nor- malization of raw magnetic resonance images is desired. Then, the lesions are extracted from normal tissue and cerebrospinal fluid (CSF) in the FLAIR images. Then, a binary mask is generated from the lesions class, resulted from previous step and applied to the original slices (T1-w, T1-Gad and T2-w) to extract the lesions. Also, fractal dimension of segmented lesions in FLAIR images are computed locally and used along with intensity fea- tures. The input dataset and it’s desired output containing lesions subtypes which were manually prepared by a neurologist (acute and chronic) are used to train the neu- ral network. Finally, determination of MS lesions subtypes in MR images are done using the Neural Network classifier and is evaluated by comparing the obtained results with the manual determination. 2.1. Patients and MR Imaging The proposed method is evaluated on a dataset which is obtained and used in [9]. This dataset contains 16 female and 4 male with average age of 29 ± 8 years old, this dataset is selected according to the revised Mc Donald criteria 2005 [10]. All images were acquired according to full field MRI criteria of MS [10] in T2-weighted (T2-w), T1-weighted (T1-w), Gadolinium enhanced T1-weighted and FLAIR in axial, sagittal and coronal surfaces. We selected the FLAIR images, especially axial ones, with lesions in deep, priventricular, subcortical, and cortical white matters (supratentorial lesions). More lesion load and higher accuracy of FLAIR in revealing of these MS lesions were the reason for this selection [11]. Each im- age volume (patient data) consisted of averagely 40 slices with a 256 × 256 scan matrix. The pixel size was 1 mm2, and the slice thickness was 3 mm without any gap. 2.2. Preprocessing As mentioned before, after segmentation of MS lesions in Flair images, a binary mask containing lesion class is applied to the original slices (T1-w, T1-Gad and T2-w) to extract the lesions intensities. So, as the primary step, all slices and all the examinations are registered using SPM software. 2.3. Manual Segmentation of Chronic and Acute Lesions There are two complimentary methods to separate acute and chronic (black holes) lesions: the first is the observa- tion of GD-enhanced lesions for acute ones and the se- cond is the observation of serial T1-w, T2-w, and Gad- E-T1-w slices in different times (imaging follow-up study) for chronic ones. In the second method, lesions which have not been enhanced and repeated in serial T1-w images are recognized as black holes. The seg- mentation of MS lesion subtypes was performed manu- ally by neurologist and radiologist in Flair images with visual inspection of corresponding T1-w, Gad-E-T1-w and T2-w images. Lesions which have not been en- hanced and repeated in serial T1-w images are recog- nized as chronic “black holes” and lesions which have been enhanced and repeated in serial Gad-E-T1-w im- ages are recognized as acute. In this study, a neurologist and a radiologist, who were not aware of the results of the computerized methods in this research, were asked to perform manual segmenta- tion of MS lesions in FLAIR images and also, chronic and acute lesions in corresponding Gad-E-T1-w slices. The results of this step for all the selected slices (learning and test) provided binary segmented images, were used as Gold standard [12] to evaluate the performance of proposed method. 2.4. Brain and Lesions Segmentation The brain segmentation was performed using a fully automatic object-oriented approach [13]. This method was based on the regional-spatial characteristics of brain in MR images. At first, original image is converted to a binary image. Then, morphological opening on the bi- nary image is performed and tiny regions are eliminated. Three rectangular masks showing the cerebral regions are produced and the regions in the binary image which have overlap with these rectangles are preserved and, the rest are eliminated. Final mask is generated by dilation of selected regions and filling tiny holes. Finally, an image, which includes only cerebral tissues, is obtained by applying the resulted mask on the original image. Then, MS lesions are segmented in FLAIR images using a fully automatic method which is based on entropy based EM algorithm and Markov random field model [14]. This method estimates a gaussian mixture model with three kernels as cerebrospinal fluid (CSF), normal tissue and Multiple Sclerosis lesions. To estimate this model, an automatic Entropy based EM algorithm was used to find the best estimated Model. Then, Markov random field (MRF) model and EM algorithm were utilized to obtain and upgrade the class conditional probability density function and the apriori probability of each class. After estimation of Model parameters and apriori probability, brain tissues were classified using Bayesian classifica- tion. Then, a binary mask is generated from the lesions class, resulted from previous step and applied to the re- gistered original slices (T1-w, T1-Gad and T2-w) to extract the lesions. The result of this step, Provides Sig- Copyright © 2012 SciRes. OPEN ACCESS  M. Mohamadkhanloo et al. / J. Biomedical Science and Engineering 5 (2012) 162-169 165 nal intensity feature vectors. 3. FRACTAL DIMENSION FEATURE The concept of fractal is first proposed by Mandelbrot [15] to describe the complex geometry of the objects in nature. Fractal dimension (FD) is a real number that de- scribes the fractal property of the object. There are sev- eral different methods to estimate the FD. Estimating fractal dimension from frequency domain is an application of Fourier power spectrum. This method is extendable and is very accurate potentially in terms of calculation. Furthermore, it’s calculation based on defi- nite mathematical relations is one of the advantages of this method. Due to above mentioned reasons and the good experimental results, this method was used to esti- mate fractal dimension in the paper. In this method, the power spectrum (p(u,v)) of an ideal fractal two-dimen- sional image (f(x,y)) with fractal dimension (fd) is defined as follows: 222 ,; H puv crru v (3.1) where c is a constant, H is Hurst coefficient, v and u are frequency variables. If the two-dimensional power spec- trum of an image is shown as S(r,θ) in Polar coordinates, S(r,θ) could be considered as an one-dimensional func- tion r for every θ direction r . Analysis shows the power spectrum behavior for a constant value θ, and could be used to investigate some characteristics such as existence of energy peaks in radiant direction from start. A comprehensive statement for power spec- trum is obtained summing these functions [16]: π 0 rs r (3.2) So, the slope of Least Squares Linear Regression of logarithmic graph S(r) in terms of r equals –2H. Fractal dimension of the image then can be obtained from equa- tion: 1 dd tH (3.3) where d is topological dimension, which equals 3 for surface. It should be mentioned that estimating the fractal dimension is done excluding DC component from S. For a homogenous texture, most energy is concentrated in low frequencies, H has high value, therefore d t is small. Whereas, for a heterogeneous texture with vast spectrum, H has low value, therefore d is big. For each pixel which belongs to lesion class, we have computed fractal dimension locally through a n × n win- dow. Computing fractal dimension using a window with big size will be time consuming. Also, small size causes erroneous results. So, we have considered a 16 × 16 window to compute fractal dimension, locally. According to the experimental results, we observed that Lesions and normal tissue categories have a fractal dimension in 2.1 < fd < 2.6 and 2.3 < fd < 3, respectively. But there is a little overlap between these two areas which make us not to be able to classify acute lesions from chronic lesions. 4. CLASSIFICATION OF ACUTE AND CHRONIC LESIONS Multilayer perceptron (MLP) is employed to classify acute lesions from chronic lesions. After Registration of MRI images (T1-w, T1-Gad and T2-w) and segmentation of MS lesions in FLAIR images, fractal dimension is computed for each pixel locally and used with MRI sig- nal intensities (T1-w, T1-Gad and T2-w) as feature vec- tors. The classifier is constructed using a three-layer MLP consisting of an input layer, a hidden layer and an output layer. The input layer has a number of nodes equal to the input vector length. The output layer consists of one node, accounting for a possibility of only 2 classes to be classi- fied. Also, the number of nodes in the hidden layer is 20, which this number selected by trial and error method. This number of nodes in hidden layer makes best result for classification. Both input and output nodes use linear transfer functions, and the hidden layer uses a sigmoid function. The epochs in the data set were randomly di- vided into two sets: a Training Set and a Testing Set. 70% of the epochs are used to train the MLP while 30% were used to test the performance of the classifier. This process was done for 100 times to reach the average ac- curacy. The MLP was trained using the Back propagation strategy, and the termination criteria are the completion of 2000 training epochs or reaching a mean square error level of 0.01 for the training data set. 5. EVALUATION The result of the chronic lesions classification based on fractal analysis method is compared with the gold stan- dard. The similarity criteria, SI [17], overlap fraction (OF) and extra fraction (EF) [18], are calculated for the all selected (learning and test) slices. The SI is a criterion for the correctly classified chronic lesions area relative to the total area of chronic lesions in both the gold standard and the area of the segmented image. The OF and EF specify, respectively, the areas which have been correctly and falsely classified as chronic lesions areas relative to the chronic lesions area in the gold standard. The simi- larity criteria are defined by the Eq.5 (5.1-5.3) 2TP SI 2TPFPFN (5.1) TP OF TPFN (5.2) Copyright © 2012 SciRes. OPEN ACCESS  M. Mohamadkhanloo et al. / J. Biomedical Science and Engineering 5 (2012) 162-169 Copyright © 2012 SciRes. 166 implemented on different FLAIR images using a Pen- tium (R) Dual-Core CPU 2.00 GHz, 2.00 GB RAM. In Figures 3(a)-(c) a typical original image as a sample slice in FLAIR and its corresponding T1-w, and Gad-E- T1-w images have been shown, respectively. Indeed, the pro- posed algorithm has three steps. In the first step, The MS lesions were segmented in FLAIR images. Figure 3(d) displays the result of gray level slice of the seg- mented MS lesions. The numerical results of the similar- ity criteria obtained in this step were compared to the results previously reported by the researchers such as Johnston et al. [20], Boudraa et al. [21], Leem put et al. [22], and Zijdenbos et al. [23], who used similar methods for their evaluation (i.e., SI). It is reminded that these researchers have used manual segmentation for evalua- tion of their methods. We, too, used manual segmenta- tion for evaluation. Therefore, comparison of our method with these methods is reasonable. This comparison is done in Table 1. FP EF TP FN (5.3) In these equations, TP stands for true positive voxels, FP for false positive voxels, and FN for false negative voxels. In binary segmentation, it is desired to achieve (SI, OF) є {0, 1} with regard to the amount of overlap between the segmentation outputs resulted from manual (gold standard) and the proposed segmentation approach. Theoretically, an optimized segmentation SI and OF should be close to 1 and EF should be close to 0. Practi- cally, a value for SI more than 0.7 represents an excellent agreement [19]. For evaluation of the segmentation of acute lesions, A similar procedure has been used and the results have been compared with the gold standard. 6. RESULTS A novel method for determination of MS lesion subtypes according to their fractal dimension in FLAIR images was presented in this paper. The proposed algorithm was Means and standard deviations of SI, OF, and EF are equal to 0.75 ± 0.03, 0.74 ± 0.05, and 0.23 ± 0.06, re- (a) (b) (c) (d) (e) (f) Figure 3. Step of the proposed method: (a) Original FLAIR image of a sample slice; (b) T1-w image of the sample slice; (c) Gad- E-T1-w image of the sample slice; (d) Gray level slice of the segmented MS lesions; (e) Result of the mapping; (f) segmentation of chronic lesions (blue) and acute lesions (red) with a manually-selected threshold. The chronic lesions in all images are indicated with blue arrows (For interpretation of the references to color in this figure legend, the reader is referred to the web version of the article.). OPEN ACCESS  M. Mohamadkhanloo et al. / J. Biomedical Science and Engineering 5 (2012) 162-169 167 Table 1. The SI values of MS lesions, segmented by different method. Method Johnson et al. [20] Boudraa et al. [21] Leemput et al. [22] Zijdenbos et al. [23] approach Fully automatic Similarity Index 0.65 0.62 0.51 0.68 0.75 Figure 4. Comparison of a binary segmented image (Seg) with the reference image (Ref). TP, TN, FP, and FN represent true positive, true negatives, false positives, and false negatives voxels, respectively [12]. spectively. These values show a better performance of MS (FLAIR) lesions segmentation for all the selected slices, as mentioned in the evaluation step. For classifi- cation of chronic and acute lesions using the method, the defined mapping was calculated and applied to the gray level slices of the lesions. The result of the mapping has been shown in Figure 3(e). Also, for each lesion pixel in Flair image, fractal dimension is computed locally and is considered as a feature. The result of voxel classification into two stages: chronic and acute by applying a manu- ally-selected threshold has been shown in Figure 3(f). As it can be seen, one of the chronic lesions is missed. The computed total volume for the chronic lesions (i.e., 0.165 cc) is much less than the value of true total volume (i.e., 0.37 cc). Using the Eq.5 (5 .1-5.3) , means of the similarity crite- ria were computed for the learning slices (see the first row in Ta bl e 2 ). It is recalled, that the value of SI more than 0.7 is considered as an excellent segmentation [19]. In the evaluation step, classification was performed for the test slices, then, the means and standard deviations of the similarity criteria were computed and showed in the second row of Table 2. The means of the calculated similarity criteria for the test slices compared to the learning slices decreased about 6% and 4% for SI and OF, respectively, and in- creased about 3% for EF criterion. In spite of a decrease (a) (b) (c) (d) Figure 5. Segmentation of the chronic lesions (blue) and the acute lesions (red) in the sample slice: (a) Gad-E-T1-w image of the sample slice; (b) Segmentation by the manually-selected threshold; (c) Segmentation based on fractal analysis method, (d) Segmentation based on signal intensity method. The chronic lesions in all images are indicated with blue arrows (For inter- pretation of the references to color in this figure legend, the reader is referred to the web version of the article.). in the SI value for the test slices, as this value is still higher than 0.7, the performance of the proposed algo- rithm is acceptable [19]. A comparison between the ef- fects of the fractal dimension and signal intensity fea- tures is shown in Figure 5. In this Figures 5(a)-(c) rep- resent the Gad-ET1-w image of the sample slice, seg- mentation of the chronic lesions for manually-selected threshold, and segmentation based on fractal analysis method, respectively. The chronic lesions in the all im- ages are indicated with blue arrows. As it is seen, for the fractal dimension value, all of the chronic lesions have been detected properly. The computed total volume of the chronic lesions (i.e., 0.35 cc) is very close to that of the true volume (i.e., 0.37 cc). As it was mentioned before, these acute lesions have not been enhanced because of low value of blood brain barrier destruction or relative inactivity of the lesion that leads the lesion toward to chronicity. For comparison of the results of the based on fractal analysis method for segmentation of the chronic and the acute lesions, the Copyright © 2012 SciRes. OPEN ACCESS  M. Mohamadkhanloo et al. / J. Biomedical Science and Engineering 5 (2012) 162-169 168 Table 2. Means and standard deviation of the similarity criteria for based on fractal and without fractal methods. Slices SI (with fractal) SI (without fractal) OF (with fractal) OF (without fractal)EF(with fractal) EF (without fractal) Learning 0.83 ± 0.07 0.84 ± 0.03 0.92 ± 0.03 0.9 ± 0.02 0.23 ± 0.04 0.30 ± 0.05 Test 0.77 ± 0.04 0.74 ± 0.05 0.88 ± 0.06 0.85 ± 0.05 0.28 ± 0.07 0.33 ± 0.06 based on intensity method was reapplied to the result of the mapping with the threshold preset automatically to 0.58. Then, the means and standard deviations of the similarity criteria were computed again for the all Se- lected slices (learning and test) (see Table 2). As it is seen in this table, the means of the calculated. Similarity criteria for the test slices compared to learning Slices decreased about 10% and 5% for SI and OF, respectively, and increased about 5% for EF. Like, the based on fractal analysis method, there are trivial differences between learning and test slices. In Figure 5(d), the result of the chronic lesion segmentation per- formed by the based on intensity method has been shown. As it is seen, all chronic lesions have been detected cor- rectly. The computed total volume of the chronic lesions (i.e., 0.345 cc) is very close to that of the true volume (i.e., 0.37 cc). We selected based on fractal method as the reference method for segmentation of the chronic and acute lesions due to good accuracy according to Table 2 and low com- putational complexity, where, SI, Similarity Index; OF, Overlap Fraction; and EF, Extra Fraction. REFERENCES [1] Mortazavi, D., Kouzani, A.Z. and Soltanian-Zadeh, H. (2011) Segmentation of multiple sclerosis lesions in MR images: A review. Diagnostic Neuroradiology, 54, 299- 320. doi:10.1007/s00234-011-0886-7 [2] Wu, Y., Warfield, S.K., Tan, I.L., Wells, W.M. III, Meier, D.S., van Schijndel, R.A., Barkhof, F. and Guttmann, C.R. (2006) Automated segmentation of multiple sclerosis le- sion subtypes with multichannel MRI. NeuroImage, 32, 1205-1215. doi:10.1016/j.neuroimage.2006.04.211 [3] Khayati, R., Vafadust, M., Towhidkhah, F. and Nabavi, S.M. (2007) A novel method for automatic determination of different stages of multiple sclerosis lesions in brain MR FLAIR images. Computerized Medical Imaging and Graphics, 32, 124-133. doi:10.1016/j.compmedimag.2007.10.003 [4] Samarasekera, S., Udupa, J.K., Miki, Y., Wei, L. and Grossman, R.I. (1997) A new computer-assisted method for the quantification of enhancing lesions in multiple sclerosis. Journal of Computer Assisted Tomography, 21, 145-151. doi:10.1097/ 000 04728- 1997010 00-000 28 [5] He, R. and Narayana, P.A. (2002) Automatic delineation of Gd enhancements on magnetic resonance images in multiple sclerosis. Medical Physics, 29, 1536-1546. doi:10.1118/1.1487422 [6] Filippi, M., Rovaris, M., Campi, A., Pereira, C. and Comi, G. (1996) Semiautomated thresholding technique for meas- uring lesion volumes in multiple sclerosis: Effects of the change of the threshold on the computed lesion loads. Acta Neurologica Scandinavica, 93, 30-34. doi:10.1111/j.1600-0404.1996.tb00166.x [7] Rovaris, M., Filippi, M., Calori, G., et al. (1997) Intra- observer reproducibility in measuring new putative MR markers of demyelination and axonal loss in multiple sclerosis: A comparison with conventional T2-weighted images. Journal of Neurology, 244, 266-270. doi:10.1007/s004150050083 [8] Filippi, M., Horsfield, M.A., Hajnal, J.V., et al. (1996) Quantitative assessment of magnetic resonance imaging lesion load in multiple sclerosis. Journal of Neurology, Neurosurgery & Psychiatry, 64, S88-S93. doi:10.1093/brain/119.4.1349 [9] Khayati, R., Vafadust, M., Towhidkhah, F. and Nabavi, S.M. (2008) Fully automatic segmentation of multiple sclerosis lesions in brain MR FLAIR images using adap- tive mixtures method and markov random field model. Computers in Biology and Medicine, 38, 379-390. doi:10.1016/j.compbiomed.2007.12.005 [10] Polman, C.H., Reingold, S.C., Edan, G., Fillippi, M., Hartung, H.P. and Kappos, L. (2005) Diagnostic criteria for MS 2005 revisions to the MC Donald criteria. Annals of Neurology, 58, 840-846. doi:10.1002/ana.20703 [11] Edelman, R.R., Hesselink, J.R., Zlatkin, M.B. and Crues, J.V. (2006) Clinical magnetic resonance imaging. 3rd Edition, Saunders, Philadelphia, 1571-1615. [12] Anbeek, P., Vincken, K.L., van Osch, M.J.P., Bisschops, R.H.C. and van der Grond, J. (2004) Probabilistic seg- mentation of white matter lesions in MR imaging. Neuro Image, 21, 1037-1044. doi:10.1016/j.neuroimage.2003.10.012 [13] Khayati, R. (2006) Quantification of multiple sclerosis lesions based on fractal analysis. Ph.D. Thesis, Amirkabir University of Technology, Tehran. [14] Bijar, A., Khanloo, M.M., Benavent, A.P. and Khayati, R. (2011) Segmentation of MS lesions using entropy-based EM algorithm and Markov random fields. Journal of Biomedical Science and Engineering, 4, 552-561. doi:10.4236/jbise.2011.48071 [15] Mandelbrot, B.B. and Freeman, W.H. (1983) The fractal geometry of nature, San Francisco, 1982. No. of pages: 460. Earth Surface Processes and Landforms, 8, 406. doi:10.1002/esp.3290080415 [16] Gonzalez, R.C., Woods, R.E. and Eddins, S.L. (2002) Digital Image Processing Using Matlab, Pearson Prentice Hall, Upper Saddle River. doi:10.1117/1.3115362 [17] Zijdenbos, A.P., Dawant, B.M., Margolin, R.A. and Pal- Copyright © 2012 SciRes. OPEN ACCESS  M. Mohamadkhanloo et al. / J. Biomedical Science and Engineering 5 (2012) 162-169 169 mer, A.C. (1994) Morphometric analysis of white matter lesions in MR images: Method and validation. IEEE Transactions on Medical Imaging, 13, 716-724. doi:10.1109/42.363096 [18] Stokking, R., Vincken, K.L. and Viergever, M.A. (2000) Automatic morphology based brain segmentation (MB- RASE) from MRI-T1 data. NeuroImage, 12, 726-738. doi:10.1006/nimg.2000.0661 [19] Bartko, J.J. (1991) Measurement and reliability: Statisti- cal thinking considerations. Schizophrenia Bulletin, 17, 483-489. doi:10.1093/schbul/17.3.483 [20] Johnston, B., Atkins, M.S., Mackiewich, B. and Ander- son, M. (1996) Segmentation of multiple sclerosis lesions in intensity corrected multispectral MRI. IEEE Transac- tions on Medical Imaging, 15, 154-169. doi:10.1109/42.491417 [21] Boudraa, A.O., Dehakb, S.M.R., Zhu, Y.M., Pachai, C., Bao, Y.G. and Grimaud, J. (2000) Automated segmenta- tion of multiple sclerosis lesions in multispectral MR imaging using fuzzy clustering. Computers in Biology and Medicine, 30, 23-40. doi:10.1016/S0010-4825(99)00019-0 [22] Leemput, K.V., Maes, F., Vandermeulen, D., Colchester, A. and Suetens, P. (2001) Automated segmentation of multiple sclerosis lesions by model outlier detection. IEEE Transactions on Medical Imaging, 20, 677-688. doi:10.1109/42.938237 [23] Zijdenbos, A.P., Forghani, R. and Evans, A.C. (2002) Automatic pipeline analysis of 3-D MRI data for clinical trials: Application to multiple sclerosis, IEEE Transac- tions on Medical Imaging, 21, 1280-1291. doi:10.1109/TMI.2002.806283 Copyright © 2012 SciRes. OPEN ACCESS
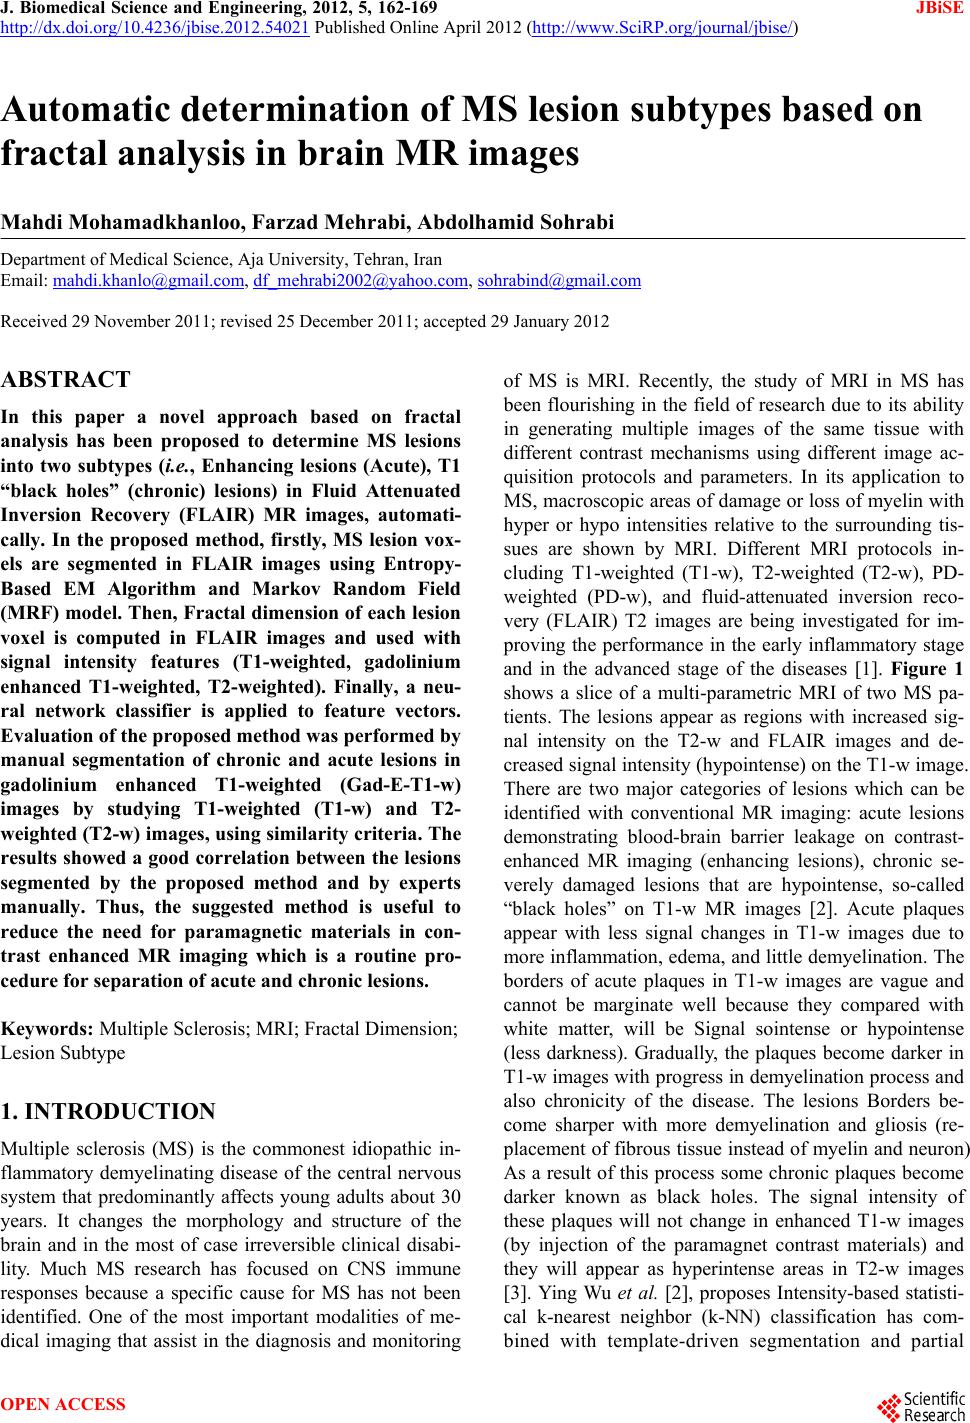
|