 Sociology Mind 2012. Vol.2, No.2, 235-246 Published Online April 2012 in SciRes (http://www.SciRP.org/journal/sm) http://dx.doi.org/10.4236/sm.2012.22031 Copyright © 2012 SciRes. 235 The Role of Social Networks in Determining Earnings: A Comparison Analysis of Four Racial and Ethnic Groups* Nadia Y. Flore s -Yeffal1, Li Zhang2 1Department of Sociology, Texas A&M University, College Station, USA 2L. Douglas Wilder School of Gov ernment and Public Af f ai rs, Virginia Commonwealth University, Richmond, USA Email: floresn@tamu.edu, Lzhang5@vcu. edu Received November 5th, 2011; re vi sed February 2nd, 2012; accepted March 11th, 2012 Previous literature shows that social networks built on weak ties provide greater advantages to individual earnings in the labor market. In this research, we evaluate the effect of social networks on earnings for different racial and ethnic groups by operationalizing social networks to the quality social network scores (QNS). We utilize the Multi-City Study of Urban Inequality (MCSUI) dataset to create the QNS for four different racial and ethnic groups: non-Hispanic Whites, Blacks, Hispanics and Asians. We assess how the earning disparities among these racial and ethnic groups are attributable to the quality of social net- works of the subgroups in the US labor market. The findings suggest that significant differences exist among these groups concerning the extent to which the QSN predicts earnings. A positive association between the QSN and earnings is found only among non-Hispanic Whites. In contrast, Blacks and His- panics gain higher wages from relying on strong ties. They benefit equivalently from the same QSN, whereas Asians earn significantly less than Blacks and Hispanics who have the same QSN. The results suggest that Asians are more likely to rely on human capital rather than social capital to improve earnings. Keywords: Social Networks; Earnings; MCSUI; Race and Ethnicity; International Migration Introduction Earning differences among various racial and ethnic groups are evident in the labor market. Generally, non-Hispanic Whites are located at the top of the earning strata, followed by Asians, Blacks and Hispanics. A variety of explanations exist in regard to the earning differentials by race and ethnicity. For instance, some researchers have found that Hispanics’ segregation pat- terns and immigrant status are the major reasons for their low socioeconomic status relative to other groups (Santiago & Wilder, 1991; Farley, 2001; Massey & Denton, 1993). Allen (1995) argues that continuing discrimination explains why Blacks are socioeconomically disadvantaged. Other researchers posit that because the educational attainments of Asian Americans have been higher than non-Hispanic Whites in the past two decades, Asian Americans have become socioeconomically more advanced than other minority groups (Kao, 1995; Alba & Nee, 2003). The existing literature has significantly improved our under- standing of earning differentials among racial and ethnic groups in the US (i.e., Green, Tigges, & Diaz, 1999; Mouw, 2002; Kmec & Trimble, 2009). Beyond the above explanations, a group of work has focused on the role of social networks in determining earnings. In the literature, social networks usually include the social contacts who refer jobs to an individual (Granovetter, 1995). Prior re- search shows that the characteristics of the social contacts in- fluence an individual’s wages (Green et al., 1999; Mouw, 2002; Stainback, 2008; Kmec & Trimble, 2009). For instance, Green et al., (1999) illustrates that for Hispanics, if the social contacts are composed by neighbors or relatives which are indicators of strong ties, then their annual income is likely to be negatively affected. In this paper, we attempt to extend the existing litera- ture by exploring how the composition rather than merely the characteristics of the social contacts affects individual earnings across race and ethnicity. In this paper, the composition of the social contacts is mainly measured by their demographic char- acteristics and socioeconomic status. We argue that the quality of the social contacts determines the quality of the social net- works. We rely on the social network theories as the theoretical guidance to investigate how the quality of social networks in- fluences earnings across race and ethnicity. According to social network theories, diffused weak ties are better than strong ties since they lead to newer and better information, and therefore, better jobs and earnings (see Granovertter, 1973; Lin, 2000). Based on the theories, we hypothesize that the quality of the social networks affects earnings across racial and ethnic groups. Thus, we examine whether racial and ethnic groups that have a better quality of social networks tend to earn more than those who do not, net the effects of social and economic factors on earnings. To answer this research question we use the Multi-City Study of Urban Inequality (MCSUI) dataset to conduct an indi- vidual level analysis. We study four racial and ethnic groups, namely, non-Hispanic Whites, Hispanics, Blacks and Asians and their social networks and earnings in the US labor market. Below we review the theoretical framework and the existing literature. Theoretical Framework and Previous Findings Social network theories provide theoretical guidance to this current research. These theories contend that good quality so- cial networks are often built on weak ties. This is because, as *Authors have contributed equally to this paper and are listed alphabetically by family names.  N. Y. FLORES-YEFFAL ET AL. Granovetter (1973) argues, strong ties formed by family members and close friends often circulate limited information. Weak ties formed by more distant friends and acquaintances, on the other hand, tend to circulate better quality information which leads to better jobs. Those who live in segregated communities are more likely to hold strong ties due to the content and quality of in- formation that flows within their close and tight networks. Such information tends to be redundant and inefficient, and, therefore, new information which can potentially lead to better paying jobs tends to be very difficult to acquire. Nan Lin (2000) also emphasizes such disadvantages when looking at the social net- works of different racial and ethnic groups. Although Grano- ve tter (1982) has revised his theory by affirming that the strength of strong ties can be beneficial to those in times of risk and uncertainty, greater emphasis has always been placed on litera- ture describing the role of sparse networks (the strength of weak ties) for acquiring economic benefits (Sanders, Nee, & Sernau, 2002). In addition, Smith (2000) notes that low-status individuals tend to concentrate on strong ties because they are more likely to provide assistance in a time of unemployment or any other severe hardship, whereas the individuals with finan- cial sta bility can dedic ate thei r time to new wea k ties whi ch can offer better employment opportunities. To apply social network theories in our research, we hold the ge n eral assumptio ns that social networks influe nce an individu al’s earnings; an individual benefits more from weak ties than strong ties regardless of his/her racial and ethnic background. Based on these assumptions, we further hypothesize that if various racial and ethnic groups have different social ties (different quality of social networks), then their earnings will differ. Specifically, we hypothesize that racial and ethnic groups whose social networks are built on weak ties (high quality of social networks) tend to earn more than those whose social networks are built on strong ties (low quality of social net- works). Thus, we have transformed the notion of strong ties/ weak ties to the notion of the quality of strong ties/weak ties. Therefore, the key research question is that how the quality of social networks (social ties) affects individual earnings across racial and et hnic groups. Prior research has documented that the quality of social networks vary among racial and ethnic groups. It has been revealed that Hispanics are more likely to rely on strong ties than weak ties in the US labor market (Flores, 2005; Garcia, 2005). Researchers argue that in order for the Hispanic minority to protect themselves from discriminationand to better cope with poverty after migrating to the US, they choose to be self- segregated (Massey et al., 1987). As a consequence, strong kin- ship relations among Hispanics are often formed. They live close to one another, which is especially the case for undo- cumented Hispanics (Singer & Massey, 1998). Their lack of skills and English language proficiency further traps them in the lowest-paying jobs, which increases their poverty levels and financially hinders them from living in integrated communities (Falcon & Melendez, 2001; Farley, 2001). Although the mi- nority groups may have cross-race contacts, Stainback (2008) indicates that for Blacks and Hispanics, cross-race contacts do not necessarily provide them an access to higher paying jobs nor jobs with authority. Theses contacts only help them to access lower-level supervisory positions. As to Blacks, researchers show that Blacks’social networks are mainly based on strong ties, and they face similar diffi- culties as Hispanics in expanding their social networks and developing or gaining access to weak ties. Because of their historical roots under slavery, Blacks have long faced a hie- rarchy of enforced discrimination. The emancipation of Blacks did not significantly improve their status, as they became defined as an “‘untouchable’ caste-like group,” forcibly seg- regated from the rest of society (Allen, 1995: p. 573). The civil rights movement and the subsequent Supreme Court decisions also failed to completely desegregate racial groups of the US. As a result, much of the Black population consists of small and tight social networks (Allen, 1995). These close and tight social networks based on strong ties have made them more segregated than any other racial and ethnic groups in the US (Massey & Denton, 1993; Wilson, 1987). Elliott and Sims (2001) note that, in regards to employer preference, Blacks are at the end of the social line and are, therefore, less likely to get a job interview. As a result of this continued discrimination in the job market, using close contacts turns out to be a way for Blacks to mini- mize the work environment discrimination (Mouw, 2002). If the close contact refers an individual to a particular workplace environment, then the individual is likely to be accepted in the environment. Due to the above conditions, Blacks have deve- loped strategies of social support, which are characterized by high reliance on family ties and extended family mechanisms (Martineau, 1977; Dominguez & Watkins, 2003). According to Lin (2000), members of minority groups and those with a lower socioeconomic status, such as Blacksand Hispanics in the US, tend to rely on poor social capital, or the information and resources acquired from strong ties.These strong ties are typ- ically homogeneous in resources and likely to be members who live in isolated co mmunities. Asian Americans are found to have formed their social networks based on strong ties as well. They have historically formed distinct communities and been segregated from the mainstream US society. Taking the Chinese as an example, Chinese immigrants were targeted with racism by non-Hispanic White miners in competition for income after they arrived in America to pursue mining jobs. In response to accusations of spreading disease and immorality, the Chinese formed tight communities which were further tightened by their proliferation in railroad work (Boswell, 1986). Later, “Chinatowns” and other tight communities sprang up in American cities based on strong ties (Zhou, 1992). Though Chinatowns provided a degree of protection for the Chinese minority, they also led to a gr e ater alienationfrom the mainstream American culture. Brothels, opium houses and gambling businesses in segregated Asian communities have provided job opportunities for Chinese gangs but have done nothing to integrate the community into the larger American business world (Light, 1974). Similar to the Chinese, other Asian American cultures have also formed their own versions of cultural communities. Today, although Asians and Asian Americans are considered the model minority group given their relatively higher levels of education and income than non-Hispanic Whites and other racial and ethnic groups (Kao, 1995; Alba & Nee, 2003), their social networks to a large extent are still considered to be based on strong ties. Recent studies also suggest that Asian Americans may utilize their social contacts with caution as they may be reluctant to ask for help and admit having trouble or stress in their lives as their culture places specific demands, such as to show success to others (Kim, Sherman, & Taylor, 2008). Asians are more likely to belong to ethnic niches and ethnic economies (Light, 1974). Copyright © 2012 SciRes. 236  N. Y. FLORES-YEFFAL ET AL. Falling in line with the recent findings, the enclave-economy hypothesis developed by Portes and associates suggests that ethnic economic enclaves create important labor and economic opportunities for their members (see Wilson &Portes, 1980). Such economic opportunities have helped Asian-Americans to gain better quality social capital than their Blacks and Hispanic counterparts. Compared to the minority groups, non-Hispanic Whites, as the majority of the US population, have formed their own exclusive social networks due to their privileged social and economic position and power. Most of the governmental jobs, legislature positions, white collar jobs, etc., are held by non- Hisp anic Whi te s in the US. Studies ha ve show n that Non-Hi sp anic Whites embrace a position of advantage in the US labor market and have maintained a higher socioeconomic status compared to any other racial or ethnic group in the US (Allensworth, 1997). They are less likely to live in disadvantaged segregated com- munities as compared to other racial and ethnic groups, parti- cularly, Blacks who are more likely to live in socially isolated neighborhoods in poverty (Browne, Green, & Tigges, 1998). Non-Hispanic Whites’ social networks are less dependent on strong ties as compared to other racial and ethnic groups. Prior research finds that they are more likely to utilize weak ties in the labor market, which leads to a positive effect on their em- ployment outcomes (Smith, 2000). Given the different nature of social ties for various racial and ethnic groups illustrated by prior literature, we are interested in investigating how different forms (quality) of social ties deter- mine the earning status of various racial and ethnic groups in the US labor market. To do so, we first rely on social network measures drawn from the MCSUI dataset to obtain information on social network quality of various racial and ethnic groups. We then construct quality network scores (QNSs) for each ra- cial and ethnic group by using the Ordinary Least Squares (OLS) technique to regress logged wages on social ties of an individual for each racial and ethnic group. Finally, we test whether there are significant differences among these four ra- cial and ethnic groups in the relationship between social net- work quality and earnings. That is, we examine whether the earn- ing differentials among non-Hispanic Whites, Blacks, Asians and Hispanics are partially caused by the difference in social network quality after controlling for other factors. Data and Variables Data We use the 1992-1994 Multi-City Study of Urban Inequality (MCSUI) dataset that is based on cities of Atlanta, Boston, Detroit and Los Angeles to conduct the analysis. The MCSUI project, funded by the Russell Sage Foundation and the Ford Foundation, aims to broaden our understanding of how labor market, racial attitudes and residential segregation foster urban inequality in the US. An interdisciplinary team of more than forty scholars at fifteen US colleges and universities completed the MCSUI project. As a result, more than 8,500 households and 8916 respondents in those households in four cities were interviewed by the project team. The response rates for Detroit, Los Angeles, Boston and Atlanta were 78%, 68%, 71%, and 75%, respectively (Bobo et al., 2000). Since the MCSUI has a primary research focus on low-income minorities, the project team over sampled Blacks and low-income households in this dataset. Overall, 2953 non-Hispanic Whites; 3179 Blacks; 1636 Hispanics and 1128 Asians are included in the dataset1. One of the unique features of the MCSUI dataset is that it contains rich information on earnings, employment history, de- tailed information on processes surrounding labor market entry, job search channels, characteristics of contact persons who are involved in the respondent’s social relationships and neighbor- hood activities. Such information allows us to examine the effect of social networks on wages because the contacts can be considered part of the respondent’s social networks. Al- though the MCSUI data were collected in the 1990s, its social networks data have not been extensively examined in the exist- ing literature. Given the rich information presented by the MCSUI dataset, we believe there is room to improve our un- derstanding of the current labor market through its analysis. We hope that the findings of this research will enrich theories of social networks and earnings as well. Dependent and Independent Variables The dependent variable in this analysis is logged hourly wage. The logged form of wage is used to normalize the distri- bution of hourly wages. Based on the descriptive analysis re- sults shown in Table 1, the average hourly wage for all re- spondents is $13.4 with a standard deviation of 0.3. Earnings vary across racial and ethnic groups. On average, non-Hispanic Whites have reported the highest hourly wages ($15.4), fol- lowed by Asians ($14.1) and Blacks ($11.8). Hispanics have reported the lowest hourly wages ($8.8) among these four racial and ethnic groups. Indeed, the ranking of natural logged form of wages shows exactly the same pattern; that is, non-Hispanic Whites are located at the top and Hispanics are at the bottom of the wage stratum (see Table 1). Since the major interest of this research is to examine how social networks influence earnings, variables representing so- cial networks become the major independent variables. In this research, we operationalize social networks into two independ- ent variables, namely, contacts and quality network score. The quality network score captures the quality of the social net- works. The variable contacts is coded as “1” if the respondent has reported at least one contact person involved in the respon- dent’s social relationships and neighborhood activities, and “0” otherwise. The question in the MCSUI survey that collects information on the respondent’s contact(s) is as follows: “Look- ing back over the last six months, who are the people, other than people living in your household, with whom you discussed matters important to you?” The survey instrument allows the respondent to mention up to three contact persons and then questions the respondent about characteristics of each contact. We consider those contact(s) as an important component of the respondent’s social networks. 1The data for the Asian group in the MCSUI Los Angeles region had a data collection problem where one of the interviewers was not able to re ort any contacts from the Asian respondents. When looking at issues related to social networks, some scholars have decided to exclude the Asian group in their studies. For the pu rpose of comparison, we decided to include the Asians in our analysis considering the res earch question we had. We were interested in stud yin g ho w the characteristics and the quality of the contacts could serve as predictors of wages for different racial and ethnic groups. Given that a good percentage of Asian respondents in the MCSUI (43.1%) had contacts and provided complete data about the characteristics of their contacts, we decided to include Asians in the analysis. We still advise readers to interpret the results presented here with cau- tion regarding to the A sia n gro up cons i der ing the un der rep or tin g issue. Copyright © 2012 SciRes. 237  N. Y. FLORES-YEFFAL ET AL. Copyright © 2012 SciRes. 238 Table 1. Descriptive statistics for dependent, independent an d control variables by race and ethnicity. Whites Blacks Hispanics Asians Variables Mean (or %) S.E. N Mean (or %)S.E. N Mean (or %)S.E. N Mean (or %) S.E. N Dependent variable Logged hourly wage* $15.4 0.02 1791 $11.8 0.03 1773 $8.8 0.03 1156 $14.1 0.07 531 Independent variables Social network variables If R has a social contact 2953 3179 1636 1,128 Yes 86.4 83.8 62.0 55.8 No 13.6 16.2 38.0 44.2 Quality network score (QNS) 6.6 0.19 1010 3.6 0.18 1056 3.2 0.18 638 3.5 0.32 329 Contro l variables Demographic factors Age** 40.2 2374 38.2 2658 35.8 1572 36.9 940 Gender 2952 3177 1636 1128 Male 48.3 45.9 49.9 49.0 Female 51.7 54.1 50.1 51.0 If R is married 2809 3001 1474 1117 Yes 65.8 40.7 59.8 74.6 No 34.2 59.3 40.2 25.4 If R is native born 2215 2427 1636 1115 Yes 90.8 88.8 26.9 12.1 No 9.2 11.2 73.1 87.9 Human capital Years of educ ation 13.8 0.09 2547 12.9 0.12 3157 9.9 0.19 1632 13.9 0.38 1127 Ability to speak English 2123 2404 1186 949 Poor 0.3 0.6 15.9 6.9 Fair 1.4 4.2 22.3 25.7 Good 8.5 17.8 23.5 15.9 Very good 16.5 25.6 18.6 28.0 Excellent 73.4 51.9 19.7 23.4 Work exp. since left school 2103 2269 1574 989 Did not work 8.1 5.4 8.1 6.0 Worked ¼ of the time 5.4 3.9 5.4 2.5 Worked ½ of the time 12.4 10.6 12.4 8.5 Worked ¾ of the time 13.6 12.8 13.6 13.7 Worked all the time 60.5 67.2 60.5 69.3 If R is a member of a labor union 2953 3179 1636 1128 Yes 40.0 31.0 46.3 39.1 No 60.0 69.0 53.7 60.9 Note: R refers t o respondent. Some sub-categories may not add up to 100% due to roundin g. *The average wage for all racial groups is 13.4. The average wages for Whites, Blacks, Hispanics and Asians are 15.4, 11.8, 8.8 and 14.1, respectively. **Respondents aged 65 and over are dropped from the analysis since we only consider working age people. QNSs are weighted. One may argue that it is a drawback of the MCSUI data that its survey only collected information on three of each respon- dent’s contacts. Therefore, the data may not capture the respon- dent’s entire social network. We argue that asking up to three contacts may be sufficient if one utilizes the limited informa- tion in an efficient way. As previous research shows, the Gen- eral Social Survey (GSS) data are highly reliable and represen- tative. The GSS, however, only asked up to five contacts. In the GSS, the respondents on average only provided information on three contacts since some of the subsequent studies eliminated the spouse or a kin from the total number of contacts reported. As a consequence, studies using the GSS data ended up with only taking into account three contacts (Marsden, 1987). Thus, we argue that asking information for only three contacts in the MCSUI survey should not have influenced the reliability of the data. Indeed, asking information about the contacts that are out- side of the households diminishes the possibility of including only close kinship ties in the respondent’s social networks. According to the social networks theories, having a contact person is more beneficial than having no contacts in terms of earnings. According to Table 1 which presents the descriptive information of the variables, we see that there are higher per- centages of non-Hispanic Whites (86.4%) and Blacks (83.8%) who have reported having at least one contact person as com-  N. Y. FLORES-YEFFAL ET AL. pared to Hispanics (62.0%) and Asians (55.8%). In the latter part of this article, we will conduct a regression analysis to further examine whether having contacts (social networks) improves earnings of the respondent and whether such an effect varies across racial and ethnic groups. One important caveat is that our research aggregates all Latino subpopulations into a single group. We admit that the Hispanics are composed of a great diversity of individuals “whose culture, language, and/or geography have Latin roots” (Massey, 1991: 23). As Massey (1991) indicates, Latinos (Hispanics) come from different places, share different cultural values, and have experienced very different social and migratory trajectories throughout history. The importance of social networks driven by the Mexican culture of supporting extended family in migra- tion, which is found in prior research, may not be applicable to other Hispanic groups. Earning differentials among sub-groups of Asians shown by previous research speaks to the same issue that subpopulations of a racial and ethnic group should not be aggregated to a single group. Despite the variation of Latinos, we aggregated all Latino groups into a single group which we called, Hispanics, in order to simplify this empirical exercise. For the sake of simplicity, we have also aggregated Asians, although Asians are composed of a variety of nationalities. Aggregating sub-groups to a single group also helps us to pre- serve a good number of cases for each of the groups being ana- lyzed in the analysis and offers parsimony to the results. The second independent variable that we use to operational- ize the respondent’s social networks is the quality network sc ore (QNS). The QNS is constructed by applying the OLS regres- sions to predict the respondent’s natural logged hourly wage based on the characteristics of the contacts. For the purpose of conducting a diagnostic exercise, we ran one regression model in which all four racial and ethnic groups are included. Even though prior literature suggests that social networks may work differently for each of the racial and ethnic groups, we assume that social networks operate in the way that weak ties and more heterogeneous networks lead to jobs with higher wages. Thus, we consider combining all four racial and ethnic groups in one regression model as an acceptable approach to create the weighting coefficients. The same approach that combines all four racial and ethnic groups is applied when we generate the weighting coefficients for the dependent variable. As to inde- pendent variables in the diagnostic model, we utilize character- istics of the contact variables to conduct the analysis. The MCSUI survey asks about the following characteristics of the contacts: sex, marital status, educational attainments, race and ethnicity, the contact’s relationship to the respondent, if the contact lived in the same neighborhood as the respondent, if the contact was getting social welfare and if the contact had a steady job. Depending on the regression coefficients, we then recode the variables containing information on characteristics of the contacts. For instance, if the regression coefficient for the sex variable is 0.12 for contact 1 (females are the reference category), we recode the sex variable as “0” if female, and “0.12” if male. All other variables that represent characteristics of the contact(s) are recoded following the same strategy. After we finish recoding all variables representing the contacts’ characteristics, we generate the QNS for each contact by adding all recoded variables (variables with non-significant regression coefficients are not added). Finally, we obtain an overall QNS by adding the QNSs for each contact. The reason we prefer one QNS is because we believe a single score better captures the overall quality of the respondent’s social networks. The higher the QNS is, the better the quality of the respondent’s social networks. In Appendix 1, we list names of variables that we use to generate the QNSs. We show descriptive results of the respon- dent’s contacts in Appendix 2. We find that contacts are slightly overrepresented by females than males. In our samples, over half of the contacts are married, and the majority (around 65%) of the contacts are non-Hispanic Whites. With regard to educa- tional attainments of the contacts, most contacts are either high school graduates or college graduates. Over 70% of contacts had steady jobs when the survey was conducted. Less than 5% of contacts depended on social welfare. In terms of the respon- dent’s relationship with the contacts, a large number of contacts were friends of the respondent; over 60% of the contacts did not live in the same neighborhood as the respondent. These descriptive results seem to suggest that, in general, samples of our analysis are more likely to have weak ties than strong ties. In Appendix 3, we present the OLS regression coefficients that we use to generate the QNSs. We would like to draw the readers’ attention to the fact that respondents with no contacts are excluded from this part of the analysis. The reason that we exclude those respondents is because including respondents with no contacts would result in a multicollinearity problem in regression models since there is no variation in the number of cases for each group with no contacts. Thus, when we examine how the quality of social networks influences wages, we only assess how the quality of social networks affects wages of those who have reported contacts. In fact, our coding based on the regression coefficients shown in Appendix 3 show strong con- sistency with findings of previous research. For example, the sex variable for contact 2 is coded as “0” for females and “0.13” for males. This coding corroborates findings of previous work that having a male contact is better than having a female contact, considering that women are more socioeconomically disadvantaged than men; they receive lower wages than men even though they have the same occupation as men. In terms of the marriage variable, if we use contact 2 as an example again, we code variable marriage as “0.12” if the respondent is mar- ried and “0” otherwise based on regression coefficients (see Ap- pendix 3). Such coding results echo findings of previous litera- ture that marriage carries a greater degree of economic or household responsibility, which has a positive influence on earnings. The regression coefficient for variable welfare for contact 3 is –0.39, meaning a contact receiving social welfare is assigned a lower (negative) score relative to a contact who did not de- pend on welfare (–0.39 versus 0). In addition, living in the same neighborhood as the respondent is coded as “–0.06” and “0” other- wise for contact 1. This coding is consistent with Massey and Denton’s (1993) finding regarding the disadvantages of minority members who live in (the same) segregated neighborhoods. Re- garding race and e thnicity, researcher s have documented relati vely higher levels of poverty and segregation among minority groups than among non-Hispanic Whites. The coefficients we use to re- code the contact’s characteristics, in most cases, reflect a similar pattern; minority groups receive lower (or negative) scores as compared to the majority, non-Hispanic Whites. As far as human capital, we code contacts having higher educa- tional attainme nts with highe r scores, mea ning the regre ssion coef - ficients are larger for contacts with more years of scho oli ng. Ou r coding fo r the relationship variable that measures the rel ati ons hip Copyright © 2012 SciRes. 239  N. Y. FLORES-YEFFAL ET AL. of contacts with the respondent also shows clear evidence which supports the weak tie theories. That is, the more distant the relationship, the weaker the ties and the better the social network quality. By adding scores representing characteristics of all contacts, we receive an overall QNS, which is a continu- ous variable that ranges from 0 to 12.2 with a mean value of 3.8. For the statistical analysis we utilize the “svy” procedure in STATA 10.0 software to correct for over sampling of minority groups and multilevel sampling of the MCSUI data. Thus, in addition to the raw QNS, we also use the “svy” command to generate a weighted QNS. The weighted QNS has a mean value of 5.29 and a standard deviation of 0.14. Please note that the values of weighted QNS are different from the values of un- weighted QNS. Table 1 exhibits the QNSs for different racial and ethnic groups. Obviously, non-Hispanic Whites have the highest QNS mean value (6.6) while the QNS mean value for the other racial and ethnic groups is about half of that of non-Hispanic Whites: 3.6 for Blacks, 3.5 for Asians and 3.2 for Hi spanics. Such results echo the findings of previous research that non-Hispanic Wh ites hav e th e pr ivilege of f orming w eak ties . Control Variables In addition to the dependent and independent variables dis- cussed above, we also include a series of control variables that capture characteristics of the respondent. In terms of the demo- graphic characteristics, we control for the respondent’s age, sex, marital status and If the respondent was native born. As seen in Table 1, female respondents are slightly overrepresented in comparison to males for all racial and ethnic groups. Hispanics show a relatively younger age with an average age of 35.8; non-Hispanic Whites have reported the oldest average age (40.2) among all racial and ethnic groups. Marriage rates for Asians is the highest (74.6%), followed by non-Hispanic Whites (65.8%) and Hispanics (59.8%). Blacks are less likely to be married (40.7%) as compared to other racial and ethnic groups. In addi- tion to the differences in the above demographic characteristics, significant racial and ethnic differences are also shown regard- ing the respondent’s place of birth. Only 12.1% of Asians and 26.9% of Hispanics were born in the US as compared to 90.8% of non-Hispanic Whites and 88.8% of Blacks who were native born. For human capital measures, we control for years of educa- tion, work experience since the respondent has left school (5 = worked all/nearly all the time; 4 = worked three-fourths of the time; 3 = worked about half of the time; 2 = worked about one-fourth of the time; 1 = did not work/or nearly not worked at all) and English speaking ability (5 = excellent, 4 = very good, 3 = good, 2 = fair, 1 = poor). In addition, we include a control variable measuring whether the respondent is a member of a labor union or a collective bargaining in their current job. We control for this factor because we assume being a member of a labor union could possibly increase an individual’s bargaining power in the labor market and that this individual has access to a broader network. According to the descriptive results shown in Table 1, ex- cept for working experience, racial and ethnic differences exist in human capital measures. On average, Asians and non-Hispanic Whites have reported more years of education (13.9 and 13.8, respectively) than Blacks (12.9) and Hispanics (9.9). Non-His- panic Whites and Blacks have stronger capabilities of speaking English than Asians and Hispanics. In addition, a h igh er p er cen t- age of blacks tend to participate in a labor union (69.0%), fol- lowed by Asians (60.9%), non-Hispanic Whites (60.0%) and Hispanics (53.7%). In sum, the descriptive results have exhib- ited that the respondent’s demographic characteristics, social capital and human capital vary across race and ethnicity. In addition to the above control variables, we added two ad- ditional controls: the respondent’s skin tone and percentages of non-Hispanic Whites and other racial groups living in the same block as the respondent (these are controls of the neighborhood characteristics). Those variables turned out to be non-signi- fi ca nt in the regression models, so we did not to control for them. Detailed information on all variables discussed above is pre- sented in Table 1. We then use the OLS regression models as the statistical methods to predict the respondent’s natural logged wages. Results Table 2 presents the OLS regression results when we use the social networks variable contacts along with other control variables to predict the respondent’s natural logged hourly wage. Results presented in models 1 through 4 show regression results for non-Hispanic Whites, Blacks, Hispanics and Asians, respectively. After controlling for the demographic characteristics and human capital of the respondent, the results show that hav- ing a contact person appears to have a significant effect only on non-Hispanic Whites’ wages but not on earnings of other racial and ethnic groups. With everything else being equal, having a contact increases a non-Hispanic White individual’s natural logged hourly wage by 8%. Besides racial and ethnic differences shown in the effects of having contacts on wages, we observe that the influence of some control variables on the respondent’s earnings varies across race and ethnicity. For instance, being native born has a significant effect only on Hispanics’ wages after controlling for other factors. This finding suggests native born status is likely to be an important social characteristic for Hispanics, which significantly improves their socioeconomic status and bargain- ing power in the labor market. Another factor that differentiates wages of various racial and ethnic groups is marital status. Everything else being equal in characteristics, being married increases non-Hispanic Whites’ and Hispanics’ wages by 9% and 8%, respective ly. Marital status does not have a significant effect on Blacks’ and Asians’ wages. The non-significant effect on Blacks’ wages could be due to their relatively lower mar- riage rate (40.7%) as compared to other racial and ethnic groups (see Table 1). The small number of Asian cases in the analysis could be the reason for the non-significant effect of marital status on Asians’ wages. Interestingly, belonging to a labor union significantly enhances Blacks’, Hispanics’ and Asians’ wages but not non-Hispanic Whites’ earnings. Such a finding indicates that participating in a labor organization could be an efficient way to protect minority groups’ earnings in the labor market. Results shown in Table 2 reveal that having contacts (having social networks) only has a significantly positive effect on non-Hispanic Whites’ wages. We then ask if these results mean that having social networks do not affect other racial and ethnic groups’ earnings. In order to better answer this question, we conduct our next analysis which predicts wages by QNS and other control variables. We want to remind the reader that a larger number of Asians reported not having any contacts. In Copyright © 2012 SciRes. 240  N. Y. FLORES-YEFFAL ET AL. Copyright © 2012 SciRes. 241 Table 2. OLS regression of logged hou rly wage on the contact variable and other control varia ble s by race and ethnicity : four cities, US. Variables Whites Blacks Hispanics Asians Social network variable If R has at least one social contact (ref. = no) 0.08* (0.06) –0.06 (0.07) 0.09 (0.03) –0.18 (0.05) Contro l variables Demographic factors Age 0.01*** 0.01*** 0.01*** 0.01*** Sex (ref. = fem ales) 0.12*** 0.10* 0.15*** 0.01*** If R is married (ref. = no) 0.09** 0.06 0.08*** 0.01 If R is native born (ref . = no) 0.02 –0.17 0.11** –0.28 Human capital Years of education 0.07*** 0.09*** 0.02*** 0.05*** Ability to speak English 0.07* 0.13*** 0.04*** 0.07*** Work exp. since le ft school 0.18*** 0.07** 0.07*** 0.12** If R is a member of a labor uni on (ref. = no) 0.05 0.20*** 0.32*** 0.22* Constant –0.26 –0.11 0.98 0.77 N 992 1,143 686 336 Design df 407 340 330 150 R-squared 0.32 0.39 0.33 0.27 Sources: derived from the MCSUI dataset. Numbers in parentheses are standard errors associated with regression coefficients. “R” represents the respondent. *indicates significant at the .05 level, **indicates significant at the 0.01 level and ***indicates significant at the 0.001 level (two tailed test). Table 3, we replace variable contacts by variable QNS. The QNS here is the overall QNS generated by adding QNSs of up to three contacts. Again, models 1 through 4 show regression results that examine samples of non-Hispanic Whites, Blacks, Hispanics and Asians, respectively. As shown in the table, the QNS only has a statistically significant effect on non-Hispanic Whites’ natural logged wages, meaning for non-Hispanic Whites, with every one unit increase in QNS, their natural logged wages increase by 2% controlling fo r all the other variabl es. This finding suggests that the quality of social networks plays a positive role in determining non-Hispanic Whites’ earnings. The quality of social networks, however, does not show significant effects on earnings for the oth er racial and ethnic groups. These results are consistent with results shown in Table 2 when we used the variable con- tacts to predict earnings. Such a consistency makes sense be- cause the QNS itself is constructed by predicting the respon- dent’s natural logged hourly wage based on characteristics of the contacts. Results presented in both tables suggest that social networks influence different racial and ethnic groups’ earnings. That is, earning differentials could be partly due to different forms and strengths of social ties held by respondents with various racial and ethnic backgrounds. We do not find much difference in terms of the effects of control variables on earn- ings which are shown in Tables 2 and 3. This again demon- strates the consistency in our two sets of regression models. In order to statistically test whether there is a significant dif- ference among the racial and ethnic groups regarding the ef- fects of contacts and QNS on earnings, we perform a Z-test as our final step of analysis. Our Z-test analysis is shown in Equa- tion (1)2. The calculated Z test values for two independent variables measuring social networks in the regression models are presented in Table 4 (detailed comparison procedures are not shown but available upon request from the authors)3. In Table 4, “No” (in parentheses) indicates rejection of the null hypothe- sis, meaning that the coefficients are not the same. “Yes” indi- cates acceptance of the null hypothesis, meaning that the coef- ficients are the same. Table 4, regarding the effects of having contacts on earnings, shows that significant racial and ethnic differences are mainly shown among three comparison groups, that is, between non- Hispanic Whites and Asians, between Blacks and Hispanics, and between Hispanics and Asians. Specifically, having contacts yields a stronger positive effect on non-Hispanic Whites’ earn- ings than on Asians’ earnings; Hispanics benefit more from having contacts than their Black and Asian counterparts. As far as the effects of QNS on earnings, we find that except for the compa- rison groups of Blacks and Hispanics, all other comparison groups show significant differences. This means that Blacks and His- panics tend to gain similar advantages from the same quality of social networks. Results based on other comparison groups sug- gest that the same quality of social networks tend to increase non-Hispanic Whites’ earnings to a greater extent compared to their Blacks, Hispanic and Asian counterparts, holding every- thing else equal. In addition, Blacks and Hispanic s tend to bene- fit more from the same quality of social networks than Asians. These findings suggest a very interesting story, that is, non- Hispanic Whites’ earnings benefit the most from having con- tacts and having good quality social networks as compared to other minority groups. Though Blacks, Hispanics and Asians share a similar level of QNS, the effects of the quality of social networks on their earnings are not the same. Blacks and His- panics seem to gain equivalent benefits from the same level of QNS, whereas Asians earn significantly less than Blacks and His- panics who have the same QNS, holding constant the effects of other variables. These findings probably suggest that in terms of 2Our Z-test follows the formula recommended by Paternoster and colleagues fo r con- trasting the effects of two regression coefficients: 22 121 2 bbSEb SEb where b1 is the regres sion coefficien t of independent variable X for group 1 (for instance, non-Hispanic Whites), b2 is the regression coefficient of the same variable X for group 2 (for example, Blacks), and SEb1 and SEb2 are the coeffi- cient variances associated with the first and second groups, respectively. 3If the value of Z for any one variable is less than 1.96, this indicates that we accept the null hypothesis that the coefficients for two racial and ethnic groups are not statisticall different from each other. If the Z test value is greater th an 1.96 , the null hy othesis is rejected, signifying that the coefficient in the equation predicting one of the racial o ethnic groups is significantly greater than the coefficient in the equation predicting another racial or ethnic group.  N. Y. FLORES-YEFFAL ET AL. Table 3. OLS regressions of logged hourly wage on the QNS variable and other contro l variables by race and ethnicity: four cities, US. Variables Whites Blacks Hispanics Asians Social network variable QNS 0.02*** (0.01) 0.01 (0.01) 0.01 (0.01) –0.02 (0.01) Control variables Demographic factors Age 0.01*** 0.01*** 0.01*** 0.01*** Sex (ref. = fem ales) 0.15*** 0.11* 0.15*** 0.14*** If R is married (ref. = no) 0.11** 0.09*** 0.07*** 0.06 If R is native born (ref. = no) 0.05 –0.10 0.11** –0.30 Human capital Years of e ducation 0.07*** 0.09*** 0.02*** 0.06*** Ability to speak English 0.06*** 0.09*** 0.06*** 0.13*** Work exp. since left school 0.18*** 0.08*** 0.04*** 0.11** If R is a member of a labor uni on (ref. = no) 0.04 0.25*** 0.35*** 0.20* Constant –0.33 –0.05 1.01*** 0.70 N 907 1056 638 329 Design df 379 298 315 145 R-squared 0.36 0.41 0.33 0.34 Sources: derived from the MCSUI dataset. Numbers in parentheses are standard errors associated with regression coefficients. “R” represents the respondent. *indicates significant at the 0.05 level, **indicates significant at the 0.01 level and ***indicates significant at the 0.001 level (two tailed test). Appendix 3 shows the coefficients utilized to construct the QNS variable. Table 4. Z-tests to determine if reg ression co efficients for racial and ethnic groups are significantly differ ent from each other: four cities, US. W vs. B W vs. H W vs. A Independent Va ria ble s Z value Z Value Z Va lue If having contact(s) 1.52 (Yes) 0.13 (Yes) 3.33(No) QNS 2.12 (No) 2.12 (No) 2.83 (No) B vs. H B vs. A H vs. A Independent Va ria ble s Z value Z Value Z Va lue If having contact(s) 1.97 (No) 1.39 (Yes) 4.63 (No) QNS 0 (Yes) 2.12 (No) 2.12 (No) Note: H0: b1 for racial and ethnic group 1 = b2 for racial and ethnic group 2. “Yes” means the regression coefficients are not sig nif ic a ntly different from each other. earnings, social networks are more important to non-Hispanic Whites, followed by Blacks and Hispanics. Other factors, such as educational attainments rather than social networks, are more likely to result in a relatively higher socioeconomic status for Asians than racial and ethnic groups. Conclusion and Discussion In this research, we focus on examining the manner in which social networks determine earnings across race and ethnicity. We find that both the characteristics and quality of social net- works for the four racial and ethnic groups vary. Regarding the composition of the respondents’social networks, 86% of non- Hispanic Whites and 84% of Blacks reported having at least one contact. In contrast, lower percentages of Hispanics (62%) and Asians (56%) reported having contacts. As far as the qual- ity of their social networks, we consider the social networks to be of good quality when they are composed of contacts who are male and married and who have steady jobs, do not rely on social welfare and have weak ties with the respondents. Ac- cording to our results, non-Hispanic Whites show the highest qu al ity network score, followed by Blacks, Asians and Hispanics . As far as earnings, non-Hispanic Whites reported higher hourly wages than all the other racial and ethnic groups, with Hispan- ic s h aving t he lowest hourly wag es. This finding ech oes Massey ’s (2007) statement that with the increasing number of new immi- grants from Latin America (including Mexico), especially those with no legal status in the United States, a new population of second-class citizens with low income is quickly formed in the US society (Massey, 2007). Through out the research, we have tested two general hypo- theses: 1) having contact(s) should have a stronger positive ef- fect on earnings than having no contact(s); and 2) the better the quality of social networks, the higher the wages. Our results show that the variation in having contact(s), the characteristics of the contact(s), and the quality of social networks do influ- ence individual earnings. These findings to a certain extent sup- port our general hypotheses. Some interesting findings emerge in this research as well. We find that after controlling for the re- spondent’s demo graphic characteristics, human capital as well as social capital, having contacts has the strongest positive effect on non-Hispanic White s’ earnings, followed by Blacks’ an d His- panics’ earnings. Earnings of Asians benefit the least from hav- ing contacts. As far as the effect of the quality of social networks on earn- ings, we find that good quality social networks positively in- fluences non-Hispanic Whites’ earnings to a greater extent as compared to other racial and ethnic groups. Though Blacks and Hispanics gain more benefits in earnings from having a good quality network score than Asians, the magnitude of their earn- ing benefits from QNS does not seem to be significantly dif- ferent from each other. These findings again support our gen- eral hypothesis and imply that social networks could be a factor that differentiates earnings across race and ethnicity in the US labor market. Th e “weak ties advantage” theory highlighted by prior resea rch is corroborated by findings of this research when non-Hispanic whites are examined, meaning weak ties improve non-Hispanic Copyright © 2012 SciRes. 242  N. Y. FLORES-YEFFAL ET AL. whites’ earnings. Non-Hispanic Whites have held most of the social, economic and political power in the US (Massey, 2007). It is not surprising that the “weak ties advantage” functions just as expected for non-Hispanic Whites. This study finds, however, the “weak ties advantage” may not be applied to other racial and ethnic groups, especially the minority groups. Our results raise an important question, that is, why is the “weak ties ad- vantage” not applicable to other racial and ethnic groups in the US? Results presented in this research may have provided an explanation for this question. For example, the results for Asians suggest that the number of contacts and the QNS are not as important determinants for their success as other racial and ethnic groups. Instead, human capital, such as the level of edu- cation, English-speaking ability and work experience, seems to matter more than their social capital in improving Asians’ wages. Such a finding suggests that human capital rather than social capital may be the key that elevates Asians into higher income strata in the US labor market. This explains why the “weak tie advantage” does not apply to the Asian group. Al- lensworth (1997) also offers a reasonable claim that Asians in the US may be reluctant to rely on social networks to look for jobs given their cultural demands to show self-sufficiency to others. For Hispanics and Blacks, our research also shows a com- pletely different pattern as compared to non-Hispanic Whites: the “strong ties advantage” works for these two minority groups. For Hispanics, the research shows that having more contacts and especially more similar contacts helps them to earn higher wages. This finding echoes the research result that strong ties rather than weak ties are more important when predicting Mexicans’ earnings (Amuedo-Dorantes & Mundra, 2007). Gra- novetter (1982) argues that strong ties work especially well for those who experience conditions of risk and uncertainty. A good example is the large number of undocumented immigrants from Latin America who are currently living in the US. Their unlawful status forces them to rely on their homogenous net- works or what Flores-Yeffal (forthcoming) calls, “Migration- Trust Networks” which are networks mostly formed by other immigrants from the same places of origin and are driven by relations of trust and solidarity. For those Hispanics, jobs are found mainly through utilizing immigrant networks (Garcia, 1997). Flores-Yeffal and Aysa-Lastra (2011) suggest that Mexi- can immigrants relay on a different type of “weak ties” such as paisanos or countryman which serve as substitutes in the ab- sence of family ties. Such “weak ties” also play a role when those Hispanics are looking for jobs (Garcia, 1997). Human capital is also found to determine Hispanics’ earnings. The most im- portant human capital uncovered in this study is their citizen- ship status. Being a US citizen is found to be an even better predictor than having social contacts or good quality social networks when determining Hispanics’ earnings. As for Blacks, the research suggests that their social net- works function more similarly to those of Hispanics than those of non-Hispanic Whites, that is, Blacks reply on strong ties to improve earnings. This is not surprising because both groups share a similar socioeconomic status in the US. Redlining prac- tices, among other forms of racial oppression, forced Blacks to be segregated in the inner city ghettos ( Massey & Denton, 1993). The American system has also failed to provide them with a quality education. Along with several other economic disad- vantages, Blacks have been placed in a perpetual cycle of pov- erty, especially for those who live in the inner city ghettoes (Massey, 2007). Similar to Hispanics in the US, those Blacks who live in conditions of risk and uncertainty are also more likely to rely on strong ties to look for jobs and improve earn- ings. Strong ties offer a more secure choice for them to avoid discrimination and racial oppression. The findings for Hispa- nics and Blacks shown in this research are largely consistent with Granovetter and Smith’s (2000) finding that weak ties are not likely to benefit groups in the low socio-economic spectrum although we have applied a different measure of social net- works in the research. We have used the quality network score to predict earnings whereas Granovetter and Smith (2000) have applied an individualized variable approach. Regardless the variation of measurements, the findings are consistent with each other. In sum, our research clearly shows that the earning differen- tials across racial and ethnic groups are attributable to the qual- ity of an individual’s social networks. For non-Hispanic Whites, the better the qualit of social networks, the higher the earnings. For other racial and ethnic groups, having better quality of so- cial networks does not necessarily lead to higher wages. Our research suggests that human capital as well as the social and economic situations of the respondent also play a role in the social networks and earnings relationship. Future research may look more closely at the cultural, social, economic and his- torical factors that may have affected various racial and ethnic groups, which may help us to better understand why the quality of social networks influences earnings in different ways for different racial and ethnic groups. This empirical exercise based on analyzing the MCSUI data is a beginning for understanding the role of social networks in shaping earnings across different racial and ethnic groups in the United States. Results presented in this research also provide directions for future research to further explore the determinants of earnings of various racial and ethnic groups. REFERENCES Aguilera, M. B., & Massey, D. S. (2003). Social capital and the wages of Mexican migrants: New hypotheses and tests. Social Forces, 82, 671-701. doi:10.1353/sof.2004.0001 Alba, R., & Nee, V. (2003). Remaking the American mainstream: As- similation and contemporary immigration. Cambridge, MA: Harvard University Press. Allen, W. R. (1995). African American family life in societal context: Crisis and hope. Sociological Forum, 10, 569-592. doi:10.1007/BF02095769 Allensworth, E. M. (1997). Earnings mobility of first and “1.5” gene- ration Mexican-origin women and men: A comparison with US born Mexican Americans and non-Hispanic Whites. International Migra- tion Review, 31, 386-410. doi:10.2307/2547225 Amuedo-Dorantes, C., & Mundra, K. (2007). Social networks and their impact on the earnings of Mexican migrants. Demography, 44, 849- 863. doi:10.1353/dem.2007.0039 Bernhardt, A., Morris, M., & Handcock, M. S. (1995). Women’s gains or men’s losses? A closer look at the shrinking gender gap in earn- ings. The American Journal of Sociology, 101, 302-328. doi:10.1086/230726 Bobo, L., Johnson, J., Oliver, M., Farley, R., Bluestone, B., Browne, I., Danziger, S., Green, G., Holzer, H., Krysan, M., Massagli, M., & Zubrinsky Charles, C. (2000). Multi-city study of urban inequality, 1992-1994. 3rd ICPSR Version. Atlanta, Boston, Detroit, and Los Angeles: Household Survey Data. Boswell, T. E. (1986). A split labor market analysis of discrimination against Chinese immigrants, 1850-1882. American Sociological Re- view, 51, 352-271. doi:10.2307/2095307 Copyright © 2012 SciRes. 243  N. Y. FLORES-YEFFAL ET AL. Copyright © 2012 SciRes. 244 Browne, I., Green, G., & Tigges, L. (1998). Social isolation of the ur- ban poor: Race, class, and neighborhood effects on social resources. Sociological Quarterl y, 39, 53-77. doi:10.1111/j.1533-8525.1998.tb02349.x Dominguez, S., & Watkins, C. (2003).Creating networks for survival and mobility: Social capital among African-American low-income mothers. Social Problems, 50, 111-135. doi:10.1525/sp.2003.50.1.111 Elliott, J. R., & Sims, M. (2001). Ghettos and barrios: The impact of neighborhood ethnicity and poverty on job matching among African Americans and Latinos. Social Problems, 48, 341-361. doi:10.1525/sp.2001.48.3.341 Falcon, L. M., & Melendez, E. (2001). Racial and ethnic differences in job searching in urban centers. In A. O’Connor, C. Tilly, & L. D. Bobo (Eds.), Urban inequality: Evidence from four cities (pp. 341- 371). New York: Russell Sage Foundation. Farley, R. (2001). Metropolises of the Multi-City Study of urban ine- quality: Social economic, demographic, and racial issues in Atlanta, Boston, Detroit, and Los Angeles. In A. O’Connor, C. Tilly, & L. D. Bobo (Eds.), Urban inequality: evidence from four cities (pp. 34-89). New York: Russell Sage Foundation . Flores, N. Y. (2005). The interrelation between social context, social structure, and social capital in migration flows from Mexico to the United States. Doctoral Dissertation, Philadelphia, PA: University of Pennsylvania. Flores-Yeffal, N. Y. (forthcoming). Migration-trust networks: The so- cial networks of Mexican-US bound migration. College Station, TX: Texas A&M University Press. Flores-Yeffal, N. Y., & Aysa-Lastra, M. (2011). Place of origin, types of ties, and support networks in Mexico-US Migration. Rural Socio- logy, 25, 1-30. Garcia, C. (2005). Buscando Trabajo: Social networking among immi- grants from Mexico to the United States. Hispanic Journal of Behav- ioral Sciences, 27, 3-22. doi:10.1177/0739986304272353 Garcia, J. G., & Zea, M. C. (1997). Psychological interventions and research with Latino populations . Boston, MA: Allyn & Bacon Publi- shers. Granovetter, M. (1973).The strength of weak ties. American Journal of Sociology, 78, 1360-1380. doi:10.1086/225469 Granovetter, M. (1982).The strength of weak ties: A theory revisited. In P. V. Marsden, & N. Lin (Ed.), Social structure and network analysis 78 (pp. 1360-13 80). London: Sage. Granovetter, M. (1995).Getting a job: A study of contacts and careers. Chicago: Universityof Chica go P ress. Green, G. P., Tigges, L. M., & Diaz, D. (1999). Racial and ethnic dif- ferences in job-search strategies in Atlanta, Boston, and Los Angeles. Social Science Quarterly, 8 0, 263-278. Horwitz, A. V., White, H. R., & White, S. H. (1996). Becoming mar- ried and mental health: A longitudinal study of a cohort of young adults. Journal of Marriage and the Family, 58, 895-907. doi:10.2307/353978 Kao, G. (1995). Asian Americans as model minorities? A look at their academic performance. American Journal of Education, 103, 121- 159. doi:10.1086/444094 Kim, H. S., Sherman, D. K., & Taylor, S. E. (2008). Culture and social support. American Psychologist, 63, 518-526. doi:10.1037/0003-066X Kmec, J. A., & Trimble, L. B. (2009). Does it pay to have a network contact? Social network ties, workplace racial context, and pay out- comes. Social Science Research, 38, 266-278. doi:10.1016/j.ssresearch.2009.01.003 Light, I. (1974). From vice district to tourist attraction: The moral ca- reer of American Chinatowns, 1880-1940. The Pacific Historical Re- view, 43, 367-394. Lin, N. (2000). Inequality in social capital. Contemporary Sociology, 29, 785-795. doi:10.2307/2654086 Marsden, P. V. (1987). Core discussion networks of Americans. Ameri- can Sociological Review, 52, 122-131. doi:10.2307/2095397 Martineau, W. H. (1977). Informal social ties among urban Black Americans: Some new data and review of the problem. Journal of Black Studies, 8, 83-104. doi:10.1177/002193477700800106 Massey, D. S. (1991). Latinos and the underclass. Hispanic Review of Behavioral Science, 4, 22-45. Massey, D. S. (2007).Categorically unequal: The American stratifica- tion system. New York: Russell Sage. Massey, D. S., Alarcon, R., Durand, J., & González, H. (1987). Return to Aztlan: The social process of international migration from western Mexico. Berkeley and Los Angeles, CA: University of California Press. Massey, D. S., & Denton, N. A. (1993). American apartheid: Segrega- tion and the making of the underclass. Cambridge, MA: Harvard University Press. Mouw, T. (2002). Racial differences in the effects of job contacts: Conflicting evidence from cross-sectional and longitudinal data. So- cial Science Research, 31, 511-538. doi:10.1016/S0049-089X(02)00020-0 Paternoster, R., Brame, R., Mazerolle, P., & Piquero, A. (1998). Using the correct statistical test for the equality of regression coefficients. Criminology, 36, 859-866. doi:10.1111/j.1745-9125.1998.tb01268.x Poston, D. L. (2002).The effects of human capital and cultural capital characteristics on the economic attainment patterns of male and fe- male Asian-born immigrants to the United States: Multi-level analy- ses. Asian and Pacific Migration Jou rnal, 11, 197-219. Sanders, J., Nee, V., & Sernau, S. (2002). Asian immigrants’ reliance on social ties in a multiethnic labor market. Social Forces, 81, 281- 314. doi:10.1353/sof.2002.0058 Santiago, A. M., & Wilder, M. G. (1991). Residential segregation and links to minority poverty: The case of Latinos in the United States. Social Problems, 38, 492-515. doi:10.1525/sp.1991.38.4.03a00060 Singer, A., & Massey, D. S. (1998). The social process of undocu- mented border crossing among Mexican migrants. International Mi- gration Review, 32, 561-592. doi:10.2307/2547764 Smith, S. S. (2000). Mobilizing social resources: Race, ethnic, and gen- der differences in social capital. Sociological Quarterly, 41, 509-537. doi:10.1111/j.1533-8525.2000.tb00071.x Stainback, K. (2008). Social contacts and race/ethnic job matching. Social Forces, 87, 857-886. doi:10.1353/sof.0.0123 Wellman, B., & Wortley, S. (1990). Different strokes for different folks: Community ties and social support. The American Journal of Soci- ology, 96, 558-588. doi:10.1086/229572 Wilson, W. J. (1987). The truly disadvantaged: The inner city, the un- derclass, and public policy. Chicago: The University of Chicago Press. Wilson, K. L., & Portes, A. (1980). Immigration enclaves: An analysis of the labor market experiences of Cubans in Miami. American Journal of Sociology, 86, 295-319. doi:10.1086/227240 Zhou, M. (1992). Chinatown: The socioeconomic potential of an urban enclave. Philadelphia, PA: Temple University Press. 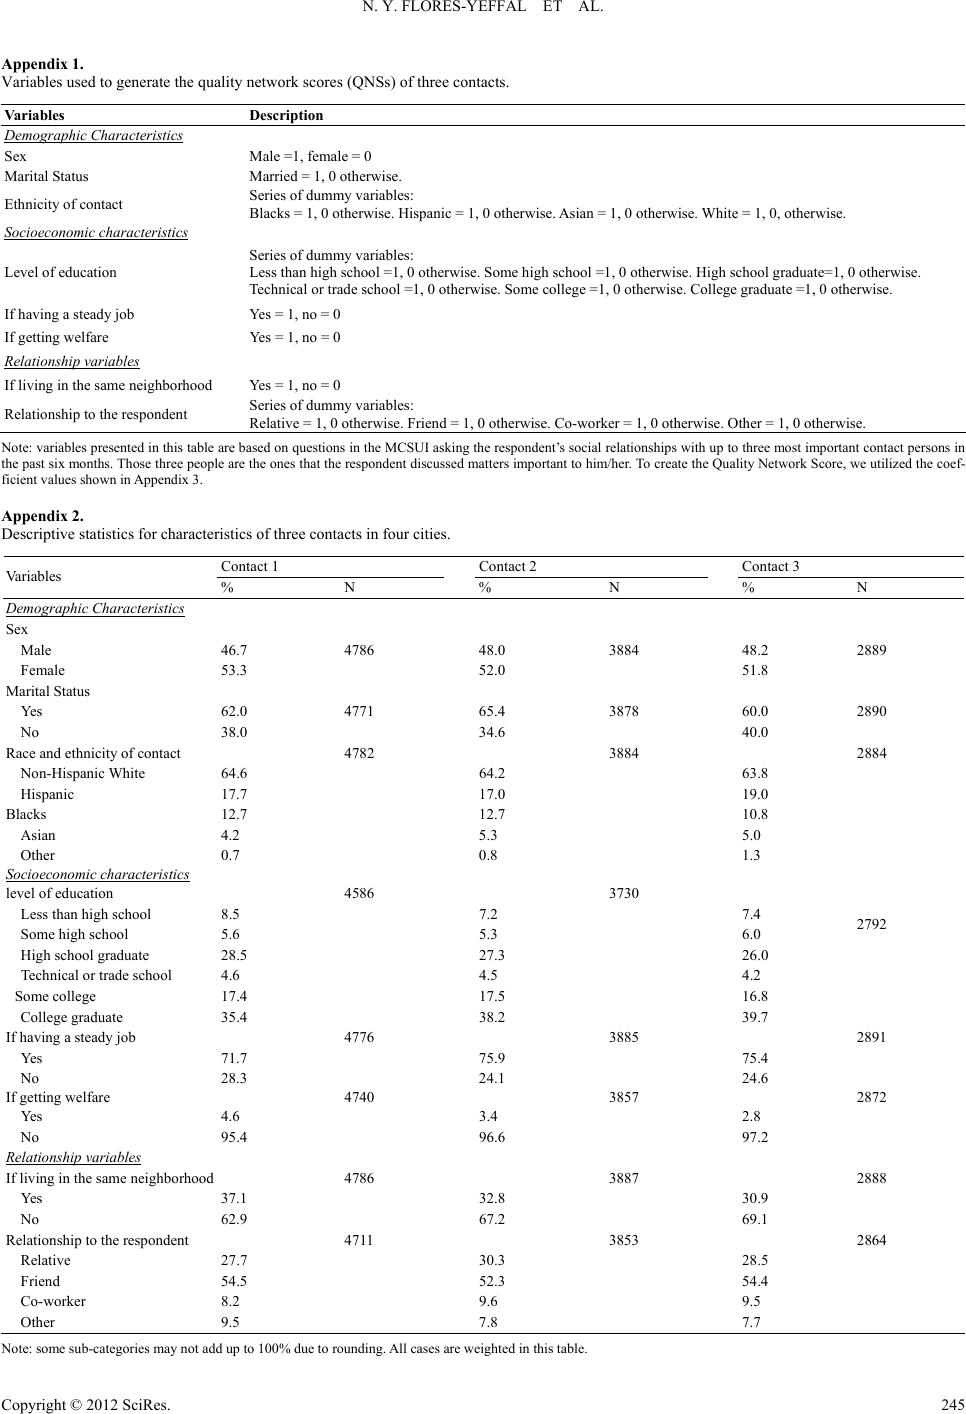 N. Y. FLORES-YEFFAL ET AL. Appendix 1. Variables used to generate the quality network sco res ( QNSs) of three contacts. Variables Description Demographic Characteristic s Sex Male =1, female = 0 Marital Status Married = 1, 0 otherwis e. Ethnicity of contact Series of dummy variables: Blacks = 1, 0 otherwise . Hispanic = 1, 0 otherw is e. Asian = 1, 0 otherwise. White = 1, 0, otherwise. Socioeconomic characte ristics Level of e d u cation Series of dummy variables: Less than hig h s chool =1, 0 otherwise. Some hi gh s chool =1, 0 otherwise. High school graduate=1, 0 otherwise. Technical or trade s chool =1, 0 otherwise. Some coll ege =1, 0 other wise. College graduate =1, 0 otherwise. If having a steady job Yes = 1, no = 0 If getting welfare Yes = 1, no = 0 Relationship variables If living in t he same neighborhood Yes = 1, n o = 0 Relationsh ip to the respondent S e ries of dummy variables: Relative = 1, 0 otherwis e. Friend = 1, 0 otherwise. Co-worker = 1, 0 ot herwise. Other = 1, 0 otherwise. Note: variables p resented in this table are based on questions in th e MCSUI asking the respon dent’s social relationship s with up to three most import ant cont act pers ons in the past six months. Those three people are the ones t hat the resp onden t di scusse d matters important to him/her. To create the Quality Network Score, we utilized the coef- ficient values shown in Appendix 3. Appendix 2. Descriptive statistics for characteristics of three contacts in four cities. Contact 1 Contact 2 Contact 3 Variables % N % N % N Demographic Characteristic s Sex Male 46.7 4786 48.0 3884 48.2 2889 Female 53.3 52.0 51.8 Marital Status Yes 62.0 4771 65.4 3878 60.0 2890 No 38.0 34.6 40.0 Race and ethnicity of contact 4782 3884 2884 Non-Hispanic White 64.6 64.2 63.8 Hispanic 17.7 17.0 19.0 Blacks 12.7 12.7 10.8 Asian 4.2 5.3 5.0 Other 0.7 0.8 1.3 Socioeconomic characte ristics level of education 4586 3730 Less than high scho ol 8.5 7.2 7.4 Some high school 5.6 5.3 6.0 2792 High school graduate 28.5 27.3 26.0 Technical or trade school 4.6 4.5 4.2 Some college 17.4 17.5 16.8 College graduate 35.4 38.2 39.7 If having a steady job 4776 3885 2891 Yes 71.7 75.9 75.4 No 28.3 24.1 24.6 If getting we l fare 4740 3857 2872 Yes 4.6 3.4 2.8 No 95.4 96.6 97.2 Relationship variables If living in the same neighborhood 4786 3887 2888 Yes 37.1 32.8 30.9 No 62.9 67.2 69.1 Relationsh ip to the re s pondent 4711 3853 2864 Relative 27.7 30.3 28.5 Friend 54.5 52.3 54.4 Co-worker 8.2 9.6 9.5 Other 9.5 7.8 7.7 Note: some sub-categories may not add up to 100% due to rounding. All cases are weighted in this table. Copyright © 2012 SciRes. 245  N. Y. FLORES-YEFFAL ET AL. Appendix 3. Regression of logged hourly wage on character istics of contacts in four US cities. Variables Contact 1 Contact 2 Contact 3 Demographic characteristics Sex Male 0.12** 0.13** - Female 0 0 0 If Married Yes 0.10** 0.12*** 0.08* No 0 0 0 Race and Ethnic ity of contac t Non-Hispanic Whites 0 0 0 Blacks –0.17*** –0.17*** –0.10* Hispanics –0.29*** –0.28*** –0.25*** Asians 0.03 –0.09 –0.00 Other rac i al groups –0.14 –0.15 0.12 Socioeconomic characte ristics level of education Less than high school –0.17** –0.12 –0.14 Some high sc hool –0.13 –0.22 –0.11 High school graduate 0 0 0 Technical or trade school –0.20*** 0.09 0.16 Some colle ge 0.07 0.11* –0.07 College grad uate 0.26*** 0.32*** 0.19*** If getting welfare - - Yes –0.39*** No 0 Social Relationships If living in t he same neighborhood - - Yes –0.06* No 0 Relationsh ip to the respondent - Relative 0.02 0.04 Friend 0 0 Co-worker 0.17** 0.21* Other 0.18** 0.15* Constant 2.38*** 2.26*** 2.42*** N 3141 2620 2018 Design df 920 851 756 R-squared 0.18 0.20 0.16 Average quality network score (QNS) 0.10 0.23 0.17 Note: *indicates significant at the 0.05 level, **indicates significant at the 0.01 level and ***indicates significant at the 0.001 level (two tailed test). If had a steady job is dropped due to non-significant regression coefficients. The QNSs are weighted which are calculated by adding all regression coefficients and they have different values than unwei gh te d sc or es. Copyright © 2012 SciRes. 246
|