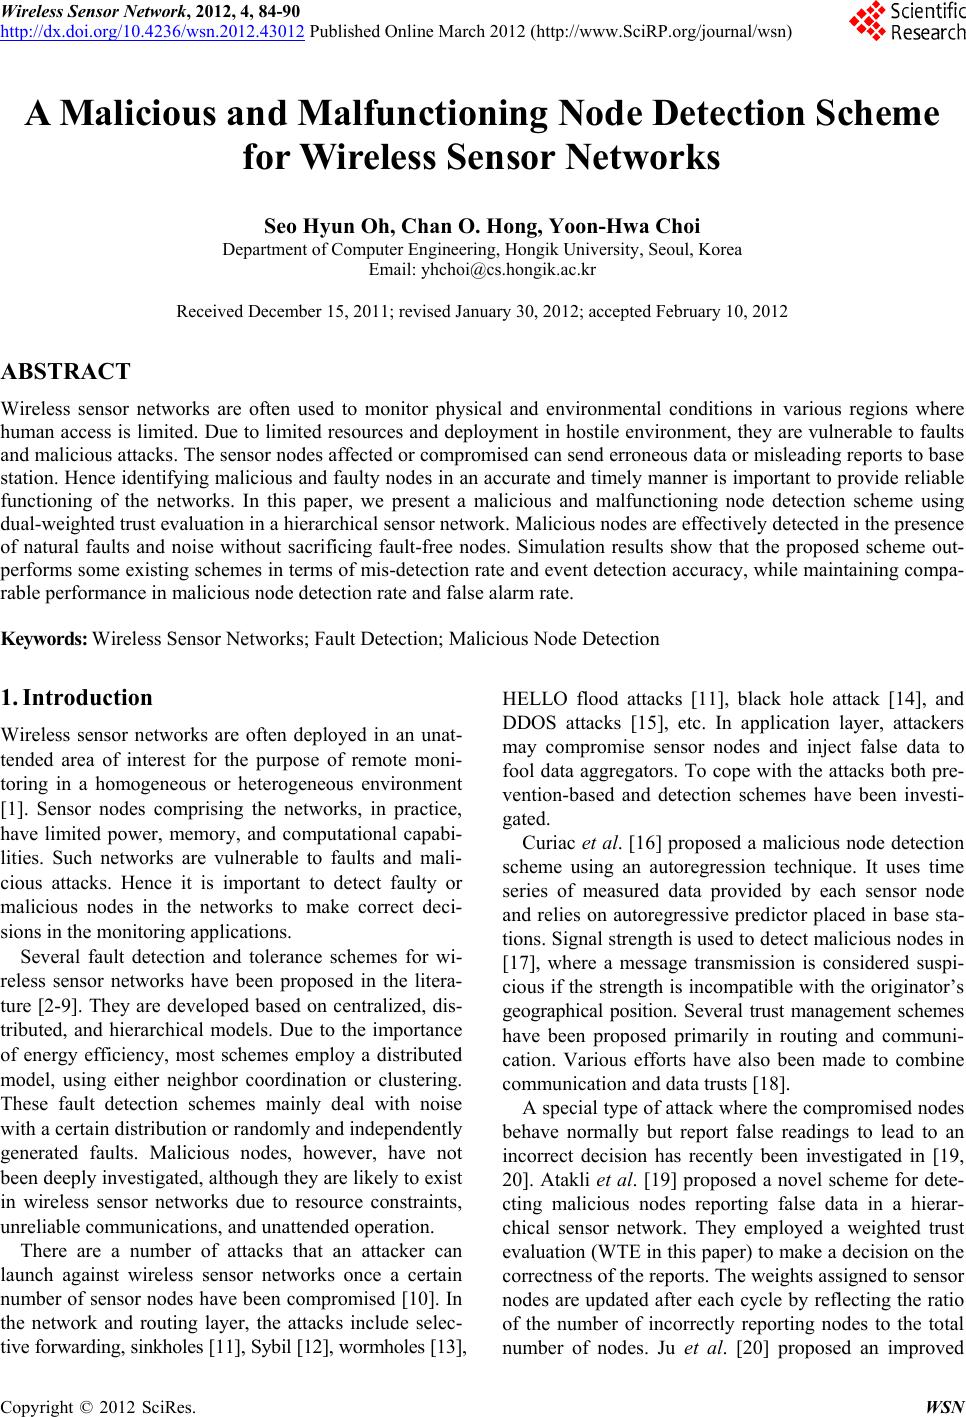
 Wireless Sensor Network, 2012, 4, 84-90 http://dx.doi.org/10.4236/wsn.2012.43012 Published Online March 2012 (http://www.SciRP.org/journal/wsn) A Malicious and Malfunctioning Node Detection Scheme for Wireless Sensor Networks Seo Hyun Oh, Chan O. Hong, Yoon-Hwa Choi Department of Computer Engineering, Hongik University, Seoul, Korea Email: yhchoi@cs.hongik.ac.kr Received December 15, 2011; revised January 30, 2012; accepted February 10, 2012 ABSTRACT Wireless sensor networks are often used to monitor physical and environmental conditions in various regions where human access is limited. Due to limited resources and deployment in hostile environment, they are vulnerable to faults and malicious attacks. The sensor nodes affected or compromised can send erroneous data or misleading reports to base station. Hence identifying malicious and faulty nodes in an accurate and timely manner is important to provide reliable functioning of the networks. In this paper, we present a malicious and malfunctioning node detection scheme using dual-weighted trust evaluation in a hierarchical sensor network. Malicious nodes are effectively detected in the presence of natural faults and noise without sacrificing fault-free nodes. Simulation results show that the proposed scheme out- performs some existing schemes in terms of mis-detection rate and event detection accuracy, while maintaining compa- rable performance in malicious node detection rate and false alarm rate. Keywords: Wireless Sensor Networks; Fault Detection; Malicious Node Detection 1. Introduction Wireless sensor networks are often deployed in an unat- tended area of interest for the purpose of remote moni- toring in a homogeneous or heterogeneous environment [1]. Sensor nodes comprising the networks, in practice, have limited power, memory, and computational capabi- lities. Such networks are vulnerable to faults and mali- cious attacks. Hence it is important to detect faulty or malicious nodes in the networks to make correct deci- sions in the monitoring applications. Several fault detection and tolerance schemes for wi- reless sensor networks have been proposed in the litera- ture [2-9]. They are developed based on centralized, dis- tributed, and hierarchical models. Due to the importance of energy efficiency, most schemes employ a distributed model, using either neighbor coordination or clustering. These fault detection schemes mainly deal with noise with a certain distribution or randomly and independently generated faults. Malicious nodes, however, have not been deeply investigated, although they are likely to exist in wireless sensor networks due to resource constraints, unreliable communications, and unattended operation. There are a number of attacks that an attacker can launch against wireless sensor networks once a certain number of sensor nodes have been compromised [10]. In the network and routing layer, the attacks include selec- tive forwarding, sinkholes [11], Sybil [12], wormholes [13], HELLO flood attacks [11], black hole attack [14], and DDOS attacks [15], etc. In application layer, attackers may compromise sensor nodes and inject false data to fool data aggregators. To cope with the attacks both pre- vention-based and detection schemes have been investi- gated. Curiac et al. [16] proposed a malicious node detection scheme using an autoregression technique. It uses time series of measured data provided by each sensor node and relies on autoregressive predictor placed in base sta- tions. Signal strength is used to detect malicious nodes in [17], where a message transmission is considered suspi- cious if the strength is incompatible with the originator’s geographical position. Several trust management schemes have been proposed primarily in routing and communi- cation. Various efforts have also been made to combine communication and data trusts [18]. A special type of attack where the compromised nodes behave normally but report false readings to lead to an incorrect decision has recently been investigated in [19, 20]. Atakli et al. [19] proposed a novel scheme for dete- cting malicious nodes reporting false data in a hierar- chical sensor network. They employed a weighted trust evaluation (WTE in this paper) to make a decision on the correctness of the reports. The weights assigned to sensor nodes are updated after each cycle by reflecting the ratio of the number of incorrectly reporting nodes to the total number of nodes. Ju et al. [20] proposed an improved C opyright © 2012 SciRes. WSN 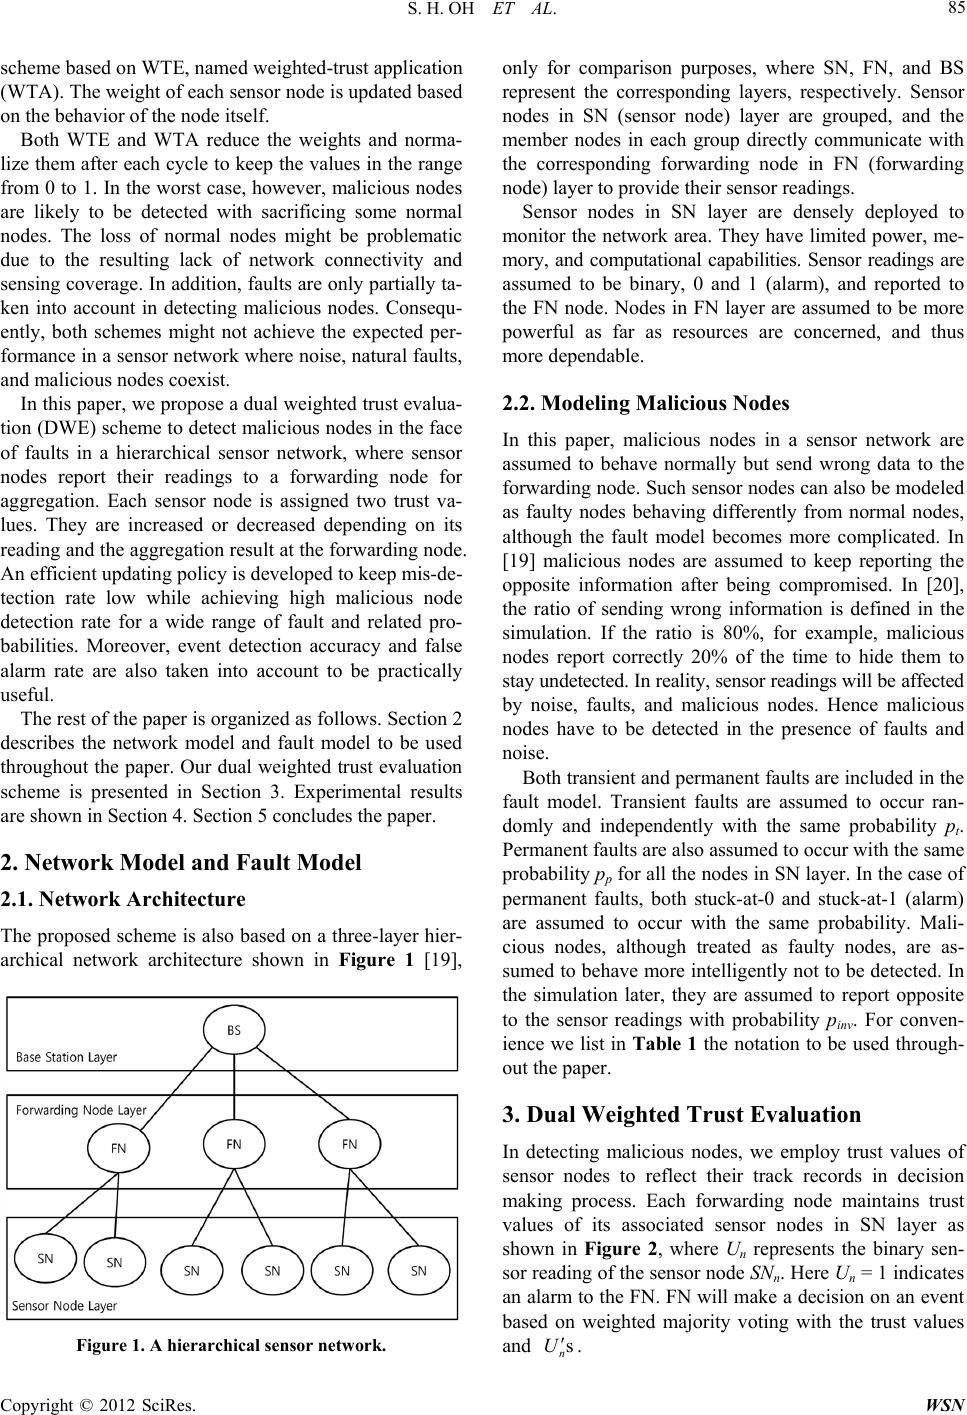 S. H. OH ET AL. 85 scheme based on WTE, named weighted-trust application (WTA). The weight of each sensor node is updated based on the behavior of the node itself. Both WTE and WTA reduce the weights and norma- lize them after each cycle to keep the values in the range from 0 to 1. In the worst case, however, malicious nodes are likely to be detected with sacrificing some normal nodes. The loss of normal nodes might be problematic due to the resulting lack of network connectivity and sensing coverage. In addition, faults are only partially ta- ken into account in detecting malicious nodes. Consequ- ently, both schemes might not achieve the expected per- formance in a sensor network where noise, natural faults, and malicious nodes coexist. In this paper, we propose a dual weighted trust evalua- tion (DWE) scheme to detect malicious nodes in the face of faults in a hierarchical sensor network, where sensor nodes report their readings to a forwarding node for aggregation. Each sensor node is assigned two trust va- lues. They are increased or decreased depending on its reading and the aggregation result at the forwarding node. An efficient updating policy is developed to keep mis-de- tection rate low while achieving high malicious node detection rate for a wide range of fault and related pro- babilities. Moreover, event detection accuracy and false alarm rate are also taken into account to be practically useful. The rest of the paper is organized as follows. Section 2 describes the network model and fault model to be used throughout the paper. Our dual weighted trust evaluation scheme is presented in Section 3. Experimental results are shown in Section 4. Section 5 concludes the paper. 2. Network Model and Fault Model 2.1. Network Architecture The proposed scheme is also based on a three-layer hier- archical network architecture shown in Figure 1 [19], Figure 1. A hierarchical sensor network. only for comparison purposes, where SN, FN, and BS represent the corresponding layers, respectively. Sensor nodes in SN (sensor node) layer are grouped, and the member nodes in each group directly communicate with the corresponding forwarding node in FN (forwarding node) layer to provide their sensor readings. Sensor nodes in SN layer are densely deployed to monitor the network area. They have limited power, me- mory, and computational capabilities. Sensor readings are assumed to be binary, 0 and 1 (alarm), and reported to the FN node. Nodes in FN layer are assumed to be more powerful as far as resources are concerned, and thus more dependable. 2.2. Modeling Malicious Nodes In this paper, malicious nodes in a sensor network are assumed to behave normally but send wrong data to the forwarding node. Such sensor nodes can also be modeled as faulty nodes behaving differently from normal nodes, although the fault model becomes more complicated. In [19] malicious nodes are assumed to keep reporting the opposite information after being compromised. In [20], the ratio of sending wrong information is defined in the simulation. If the ratio is 80%, for example, malicious nodes report correctly 20% of the time to hide them to stay undetected. In reality, sensor readings will be affected by noise, faults, and malicious nodes. Hence malicious nodes have to be detected in the presence of faults and noise. Both transient and permanent faults are included in the fault model. Transient faults are assumed to occur ran- domly and independently with the same probability pt. Permanent faults are also assumed to occur with the same probability pp for all the nodes in SN layer. In the case of permanent faults, both stuck-at-0 and stuck-at-1 (alarm) are assumed to occur with the same probability. Mali- cious nodes, although treated as faulty nodes, are as- sumed to behave more intelligently not to be detected. In the simulation later, they are assumed to report opposite to the sensor readings with probability pinv. For conven- ience we list in Table 1 the notation to be used through- out the paper. 3. Dual Weighted Trust Evaluation In detecting malicious nodes, we employ trust values of sensor nodes to reflect their track records in decision making process. Each forwarding node maintains trust values of its associated sensor nodes in SN layer as shown in Figure 2, where Un represents the binary sen- sor reading of the sensor node SNn. Here Un = 1 indicates an alarm to the FN. FN will make a decision on an event based on weighted majority voting with the trust values and s n U . Copyright © 2012 SciRes. WSN 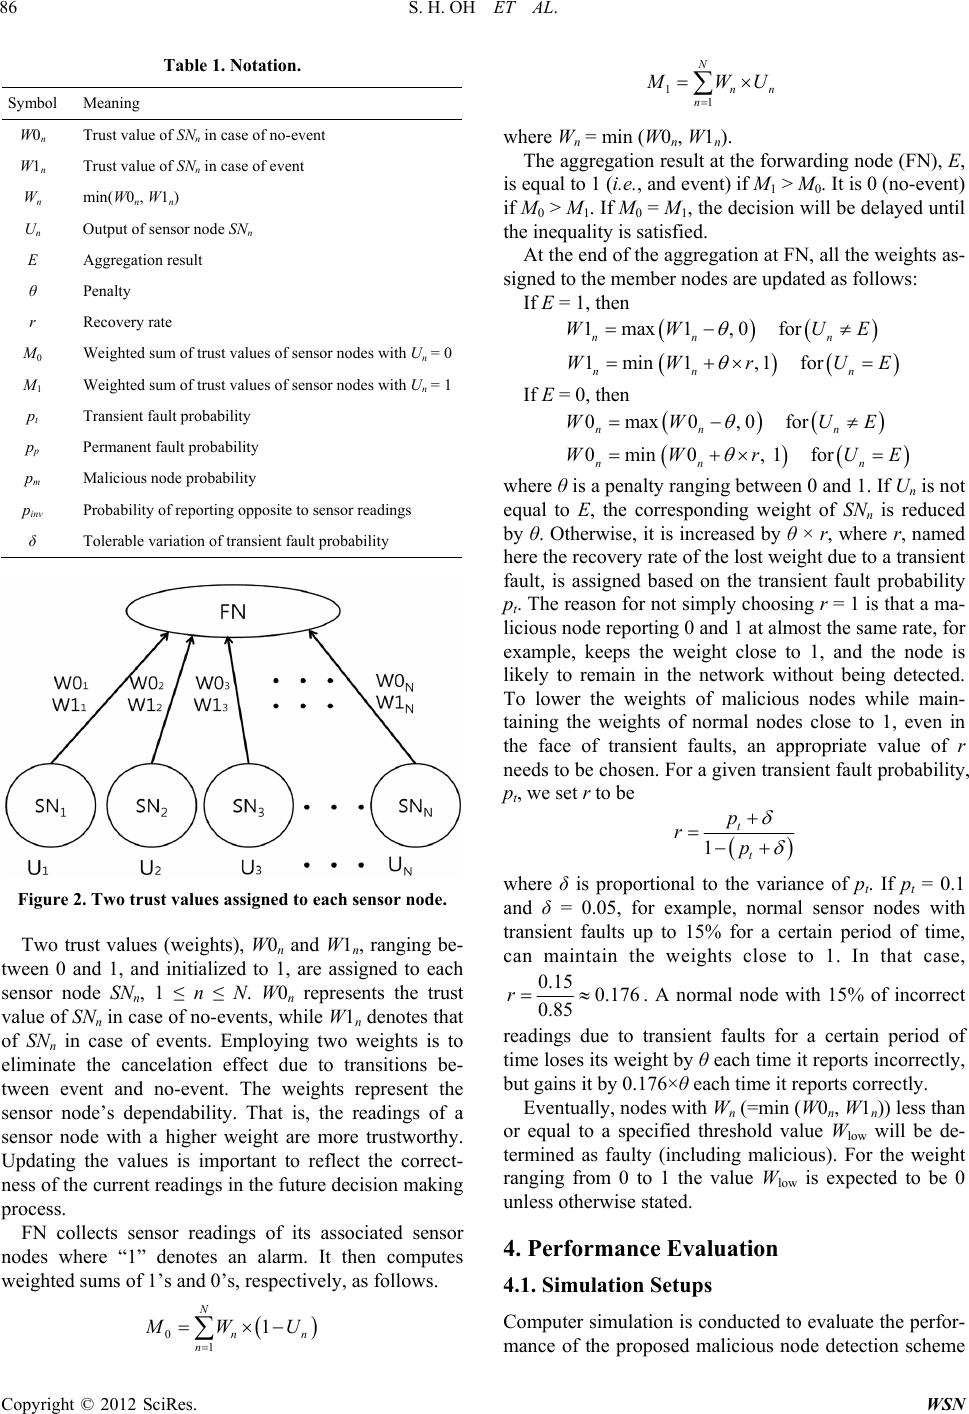 S. H. OH ET AL. 86 Table 1. Notation. Symbol Meaning W0n Trust value of SNn in case of no-event W1n Trust value of SNn in case of event Wn min(W0n, W1n) Un Output of sensor node SNn E Aggregation result θ Penalty r Recovery rate M0 Weighted sum of trust values of sensor nodes with Un = 0 M1 Weighted sum of trust values of sensor nodes with Un = 1 pt Transient fault probability pp Permanent fault probability pm Malicious node probability pinv Probability of reporting opposite to sensor readings δ Tolerable variation of transient fault probability Figure 2. Two trust values assigned to each sensor node. Two trust values (weights), W0n and W1n, ranging be- tween 0 and 1, and initialized to 1, are assigned to each sensor node SNn, 1 ≤ n ≤ N. W0n represents the trust value of SNn in case of no-events, while W1n denotes that of SNn in case of events. Employing two weights is to eliminate the cancelation effect due to transitions be- tween event and no-event. The weights represent the sensor node’s dependability. That is, the readings of a sensor node with a higher weight are more trustworthy. Updating the values is important to reflect the correct- ness of the current readings in the future decision making process. FN collects sensor readings of its associated sensor nodes where “1” denotes an alarm. It then computes weighted sums of 1’s and 0’s, respectively, as follows. 0 1 1 N nn n WU 1 1 N nn n WU where Wn = min (W0n, W1n). The aggregation result at the forwarding node (FN), E, is equal to 1 (i.e., and event) if M1 > M0. It is 0 (no-event) if M0 > M1. If M0 = M1, the decision will be delayed until the inequality is satisfied. At the end of the aggregation at FN, all the weights as- signed to the member nodes are updated as follows: If E = 1, then 1max1,0for nn n WW U E 1min1 ,1for nn n WWrU E If E = 0, then 0max0 ,0for nn n WW U E 0min0, 1for nn n WWrU E where θ is a penalty ranging between 0 and 1. If Un is not equal to E, the corresponding weight of SNn is reduced by θ. Otherwise, it is increased by θ × r, where r, named here the recovery rate of the lost weight due to a transient fault, is assigned based on the transient fault probability pt. The reason for not simply choosing r = 1 is that a ma- licious node reporting 0 and 1 at almost the same rate, for example, keeps the weight close to 1, and the node is likely to remain in the network without being detected. To lower the weights of malicious nodes while main- taining the weights of normal nodes close to 1, even in the face of transient faults, an appropriate value of r needs to be chosen. For a given transient fault probability, pt, we set r to be 1 t t p rp where δ is proportional to the variance of pt. If pt = 0.1 and δ = 0.05, for example, normal sensor nodes with transient faults up to 15% for a certain period of time, can maintain the weights close to 1. In that case, 0.15 0.176 0.85 r . A normal node with 15% of incorrect readings due to transient faults for a certain period of time loses its weight by θ each time it reports incorrectly, but gains it by 0.176×θ each time it reports correctly. Eventually, nodes with Wn (=min (W0n, W1n)) less than or equal to a specified threshold value Wlow will be de- termined as faulty (including malicious). For the weight ranging from 0 to 1 the value Wlow is expected to be 0 unless otherwise stated. 4. Performance Evaluation 4.1. Simulation Setups Computer simulation is conducted to evaluate the perfor- mance of the proposed malicious node detection scheme Copyright © 2012 SciRes. WSN 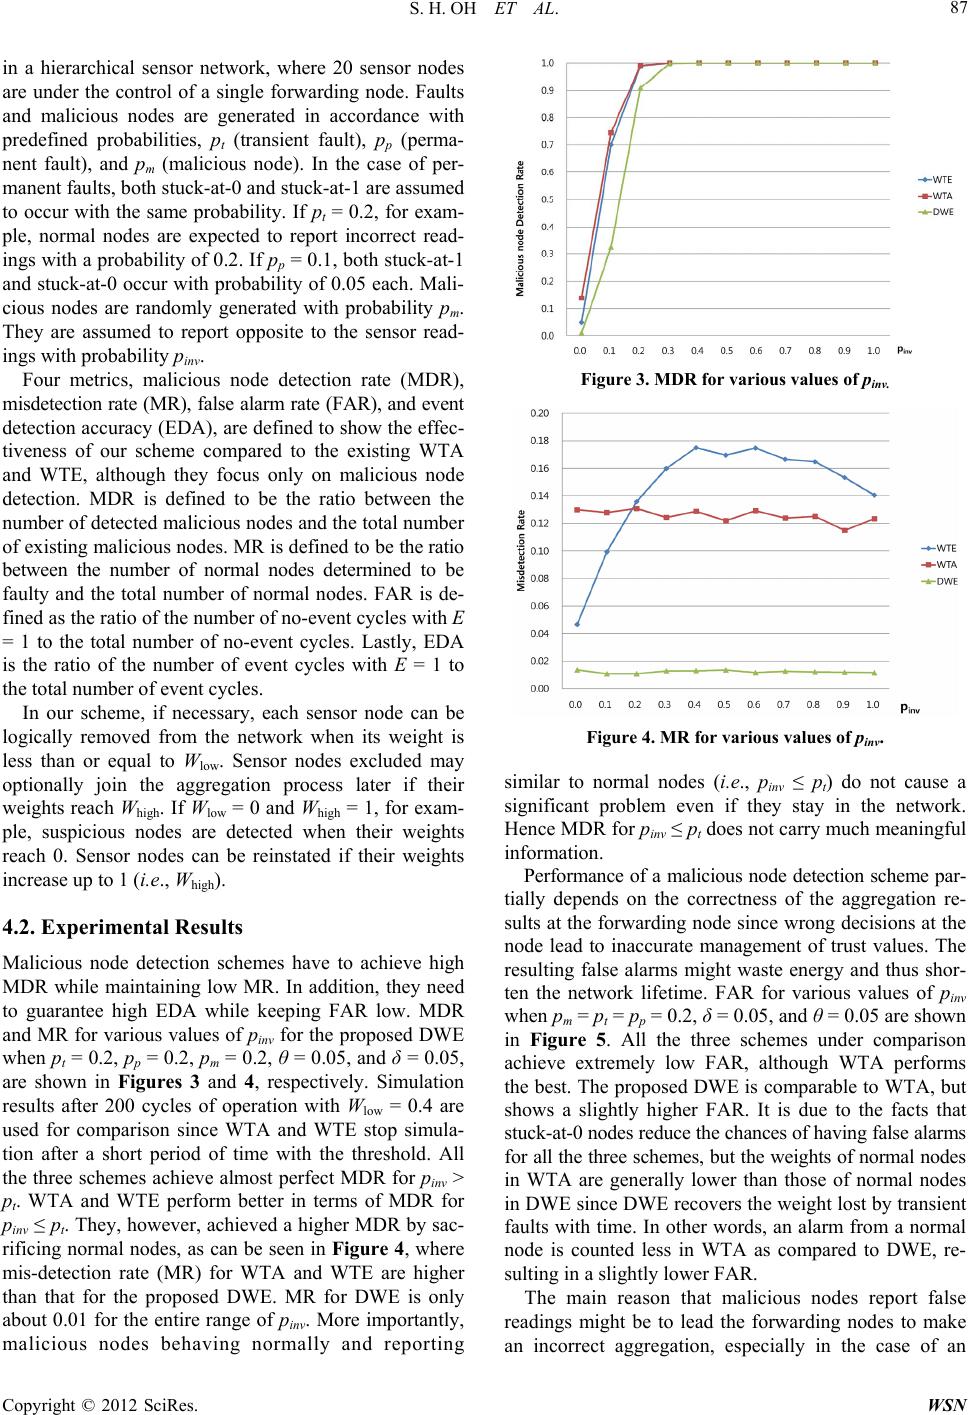 S. H. OH ET AL. 87 in a hierarchical sensor network, where 20 sensor nodes are under the control of a single forwarding node. Faults and malicious nodes are generated in accordance with predefined probabilities, pt (transient fault), pp (perma- nent fault), and pm (malicious node). In the case of per- manent faults, both stuck-at-0 and stuck-at-1 are assumed to occur with the same probability. If pt = 0.2, for exam- ple, normal nodes are expected to report incorrect read- ings with a probability of 0.2. If pp = 0.1, both stuck-at-1 and stuck-at-0 occur with probability of 0.05 each. Mali- cious nodes are randomly generated with probability pm. They are assumed to report opposite to the sensor read- ings with probability pinv. Four metrics, malicious node detection rate (MDR), misdetection rate (MR), false alarm rate (FAR), and event detection accuracy (EDA), are defined to show the effec- tiveness of our scheme compared to the existing WTA and WTE, although they focus only on malicious node detection. MDR is defined to be the ratio between the number of detected malicious nodes and the total number of existing malicious nodes. MR is defined to be the ratio between the number of normal nodes determined to be faulty and the total number of normal nodes. FAR is de- fined as the ratio of the number of no-event cycles with E = 1 to the total number of no-event cycles. Lastly, EDA is the ratio of the number of event cycles with E = 1 to the total number of event cycles. In our scheme, if necessary, each sensor node can be logically removed from the network when its weight is less than or equal to Wlow. Sensor nodes excluded may optionally join the aggregation process later if their weights reach Whigh. If Wlow = 0 and Whigh = 1, for exam- ple, suspicious nodes are detected when their weights reach 0. Sensor nodes can be reinstated if their weights increase up to 1 (i.e., Whigh). 4.2. Experimental Results Malicious node detection schemes have to achieve high MDR while maintaining low MR. In addition, they need to guarantee high EDA while keeping FAR low. MDR and MR for various values of pinv for the proposed DWE when pt = 0.2, pp = 0.2, pm = 0.2, θ = 0.05, and δ = 0.05, are shown in Figures 3 and 4, respectively. Simulation results after 200 cycles of operation with Wlow = 0.4 are used for comparison since WTA and WTE stop simula- tion after a short period of time with the threshold. All the three schemes achieve almost perfect MDR for pinv > pt. WTA and WTE perform better in terms of MDR for pinv ≤ pt. They, however, achieved a higher MDR by sac- rificing normal nodes, as can be seen in Figure 4, where mis-detection rate (MR) for WTA and WTE are higher than that for the proposed DWE. MR for DWE is only about 0.01 for the entire range of pinv. More importantly, malicious nodes behaving normally and reporting Figure 3. MDR for various values of pinv. Figure 4. MR for various values of pinv. similar to normal nodes (i.e., pinv ≤ pt) do not cause a significant problem even if they stay in the network. Hence MDR for pinv ≤ pt does not carry much meaningful information. Performance of a malicious node detection scheme par- tially depends on the correctness of the aggregation re- sults at the forwarding node since wrong decisions at the node lead to inaccurate management of trust values. The resulting false alarms might waste energy and thus shor- ten the network lifetime. FAR for various values of pinv when pm = pt = pp = 0.2, δ = 0.05, and θ = 0.05 are shown in Figure 5. All the three schemes under comparison achieve extremely low FAR, although WTA performs the best. The proposed DWE is comparable to WTA, but shows a slightly higher FAR. It is due to the facts that stuck-at-0 nodes reduce the chances of having false alarms for all the three schemes, but the weights of normal nodes in WTA are generally lower than those of normal nodes in DWE since DWE recovers the weight lost by transient faults with time. In other words, an alarm from a normal node is counted less in WTA as compared to DWE, re- sulting in a slightly lower FAR. The main reason that malicious nodes report false readings might be to lead the forwarding nodes to make an incorrect aggregation, especially in the case of an Copyright © 2012 SciRes. WSN 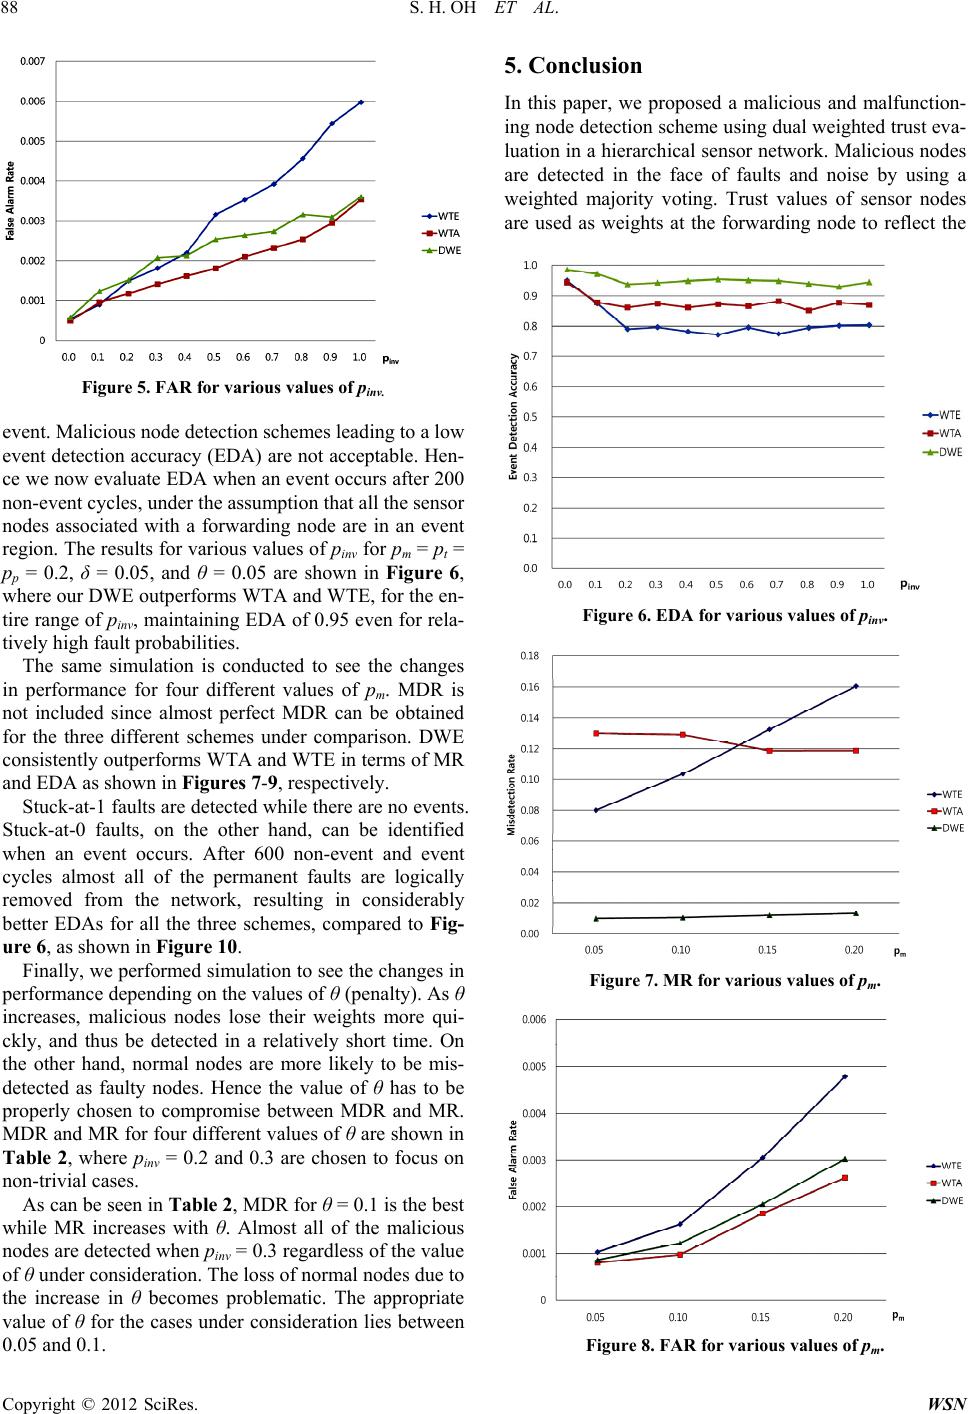 S. H. OH ET AL. 88 Figure 5. FAR for various values of pinv. event. Malicious node detection schemes leading to a low event detection accuracy (EDA) are not acceptable. Hen- ce we now evaluate EDA when an event occurs after 200 non-event cycles, under the assumption that all the sensor nodes associated with a forwarding node are in an event region. The results for various values of pinv for pm = pt = pp = 0.2, δ = 0.05, and θ = 0.05 are shown in Figure 6, where our DWE outperforms WTA and WTE, for the en- tire range of pinv, maintaining EDA of 0.95 even for rela- tively high fault probabilities. The same simulation is conducted to see the changes in performance for four different values of pm. MDR is not included since almost perfect MDR can be obtained for the three different schemes under comparison. DWE consistently outperforms WTA and WTE in terms of MR and EDA as shown in Figures 7-9, respectively. Stuck-at-1 faults are detected while there are no events. Stuck-at-0 faults, on the other hand, can be identified when an event occurs. After 600 non-event and event cycles almost all of the permanent faults are logically removed from the network, resulting in considerably better EDAs for all the three schemes, compared to Fig- ure 6, as shown in Figure 10. Finally, we performed simulation to see the changes in performance depending on the values of θ (penalty). As θ increases, malicious nodes lose their weights more qui- ckly, and thus be detected in a relatively short time. On the other hand, normal nodes are more likely to be mis- detected as faulty nodes. Hence the value of θ has to be properly chosen to compromise between MDR and MR. MDR and MR for four different values of θ are shown in Table 2, where pinv = 0.2 and 0.3 are chosen to focus on non-trivial cases. As can be seen in Table 2 , MDR for θ = 0.1 is the best while MR increases with θ. Almost all of the malicious nodes are detected when pinv = 0.3 regardless of the value of θ under consideration. The loss of normal nodes due to the increase in θ becomes problematic. The appropriate value of θ for the cases under consideration lies between 0.05 and 0.1. 5. Conclusion In this paper, we proposed a malicious and malfunction- ing node detection scheme using dual weighted trust eva- luation in a hierarchical sensor network. Malicious nodes are detected in the face of faults and noise by using a weighted majority voting. Trust values of sensor nodes are used as weights at the forwarding node to reflect the Figure 6. EDA for various values of pinv. Figure 7. MR for various values of pm. Figure 8. FAR for various values of pm. Copyright © 2012 SciRes. WSN 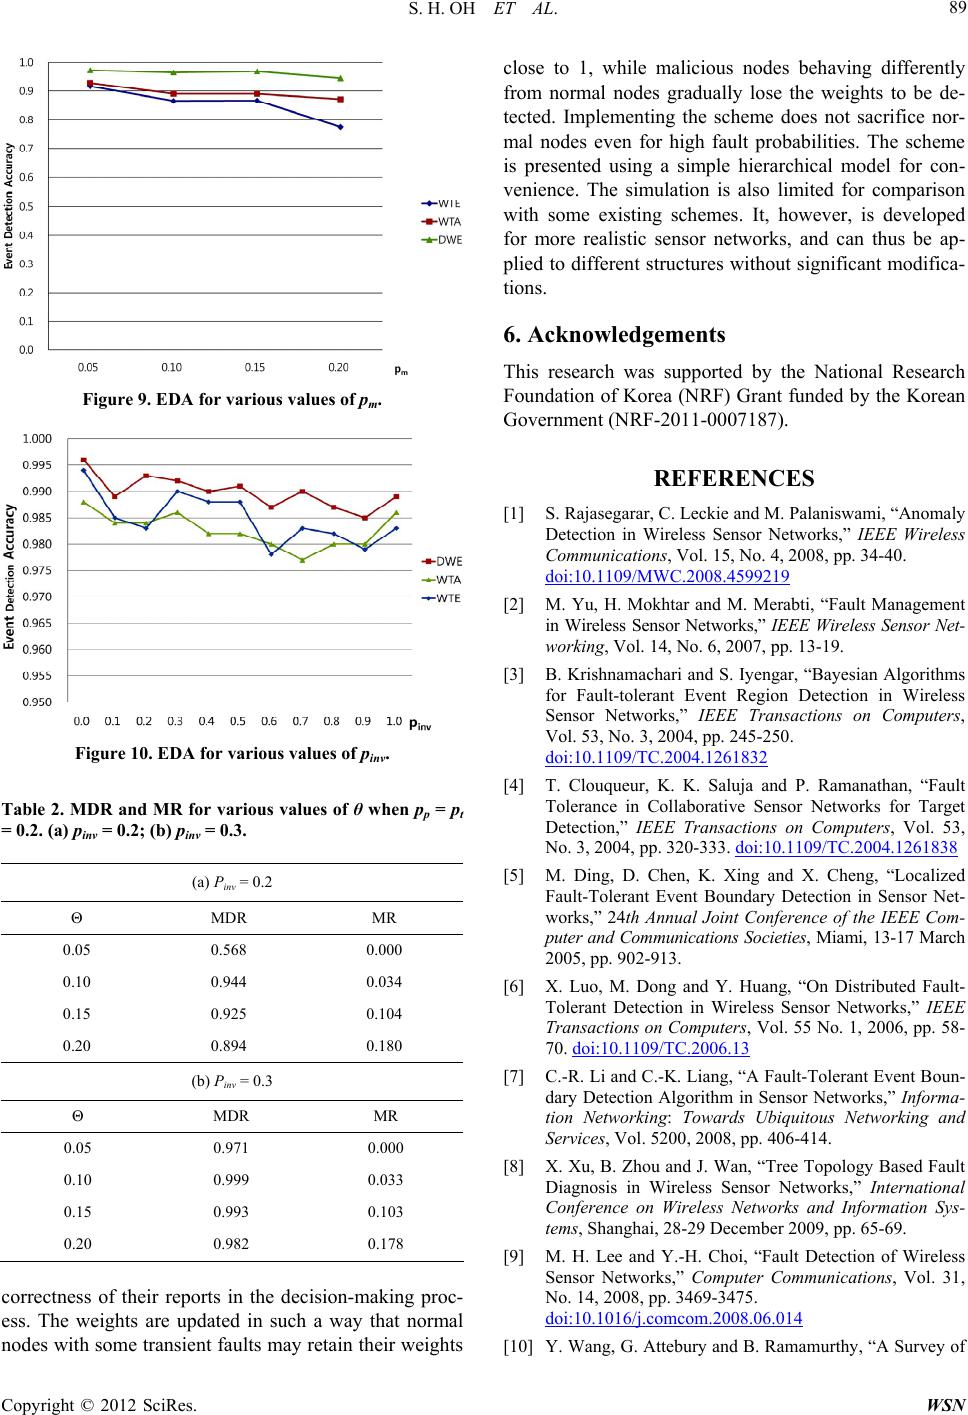 S. H. OH ET AL. 89 Figure 9. EDA for various values of pm. Figure 10. EDA for various values of pinv. Table 2. MDR and MR for various values of θ when pp = pt = 0.2. (a) pinv = 0.2; (b) pin v = 0.3. (a) Pinv = 0.2 Θ MDR MR 0.05 0.568 0.000 0.10 0.944 0.034 0.15 0.925 0.104 0.20 0.894 0.180 (b) Pinv = 0.3 Θ MDR MR 0.05 0.971 0.000 0.10 0.999 0.033 0.15 0.993 0.103 0.20 0.982 0.178 correctness of their reports in the decision-making proc- ess. The weights are updated in such a way that normal nodes with some transient faults may retain their weights close to 1, while malicious nodes behaving differently from normal nodes gradually lose the weights to be de- tected. Implementing the scheme does not sacrifice nor- mal nodes even for high fault probabilities. The scheme is presented using a simple hierarchical model for con- venience. The simulation is also limited for comparison with some existing schemes. It, however, is developed for more realistic sensor networks, and can thus be ap- plied to different structures without significant modifica- tions. 6. Acknowledgements This research was supported by the National Research Foundation of Korea (NRF) Grant funded by the Korean Government (NRF-2011-0007187). REFERENCES [1] S. Rajasegarar, C. Leckie and M. Palaniswami, “Anomaly Detection in Wireless Sensor Networks,” IEEE Wireless Communications, Vol. 15, No. 4, 2008, pp. 34-40. doi:10.1109/MWC.2008.4599219 [2] M. Yu, H. Mokhtar and M. Merabti, “Fault Management in Wireless Sensor Networks,” IEEE Wireless Sensor Net- working, Vol. 14, No. 6, 2007, pp. 13-19. [3] B. Krishnamachari and S. Iyengar, “Bayesian Algorithms for Fault-tolerant Event Region Detection in Wireless Sensor Networks,” IEEE Transactions on Computers, Vol. 53, No. 3, 2004, pp. 245-250. doi:10.1109/TC.2004.1261832 [4] T. Clouqueur, K. K. Saluja and P. Ramanathan, “Fault Tolerance in Collaborative Sensor Networks for Target Detection,” IEEE Transactions on Computers, Vol. 53, No. 3, 2004, pp. 320-333. doi:10.1109/TC.2004.1261838 [5] M. Ding, D. Chen, K. Xing and X. Cheng, “Localized Fault-Tolerant Event Boundary Detection in Sensor Net- works,” 24th Annual Joint Conference of the IEEE Com- puter and Communications Societies, Miami, 13-17 March 2005, pp. 902-913. [6] X. Luo, M. Dong and Y. Huang, “On Distributed Fault- Tolerant Detection in Wireless Sensor Networks,” IEEE Transactions on Computers, Vol. 55 No. 1, 2006, pp. 58- 70. doi:10.1109/TC.2006.13 [7] C.-R. Li and C.-K. Liang, “A Fault-Tolerant Event Boun- dary Detection Algorithm in Sensor Networks,” Informa- tion Networking: Towards Ubiquitous Networking and Services, Vol. 5200, 2008, pp. 406-414. [8] X. Xu, B. Zhou and J. Wan, “Tree Topology Based Fault Diagnosis in Wireless Sensor Networks,” International Conference on Wireless Networks and Information Sys- tems, Shanghai, 28-29 December 2009, pp. 65-69. [9] M. H. Lee and Y.-H. Choi, “Fault Detection of Wireless Sensor Networks,” Computer Communications, Vol. 31, No. 14, 2008, pp. 3469-3475. doi:10.1016/j.comcom.2008.06.014 [10] Y. Wang, G. Attebury and B. Ramamurthy, “A Survey of Copyright © 2012 SciRes. WSN 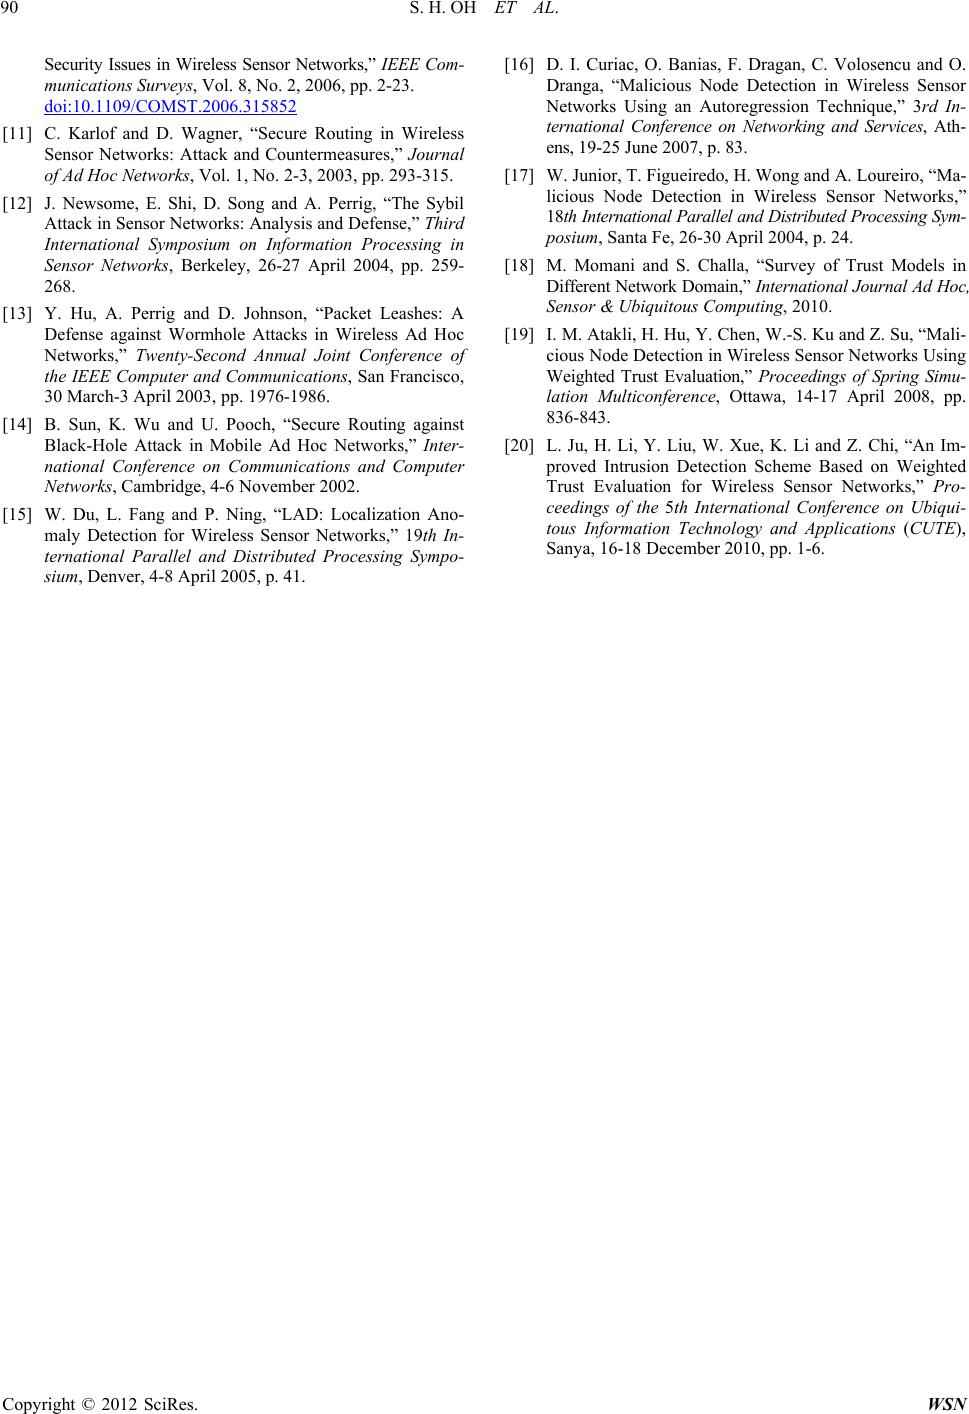 S. H. OH ET AL. Copyright © 2012 SciRes. WSN 90 Security Issues in Wireless Sensor Networks,” IEEE Com- munications Surveys, Vol. 8, No. 2, 2006, pp. 2-23. doi:10.1109/COMST.2006.315852 [11] C. Karlof and D. Wagner, “Secure Routing in Wireless Sensor Networks: Attack and Countermeasures,” Journal of Ad Hoc Networks, Vol. 1, No. 2-3, 2003, pp. 293-315. [12] J. Newsome, E. Shi, D. Song and A. Perrig, “The Sybil Attack in Sensor Networks: Analysis and Defense,” Third International Symposium on Information Processing in Sensor Networks, Berkeley, 26-27 April 2004, pp. 259- 268. [13] Y. Hu, A. Perrig and D. Johnson, “Packet Leashes: A Defense against Wormhole Attacks in Wireless Ad Hoc Networks,” Twenty-Second Annual Joint Conference of the IEEE Computer and Communications, San Francisco, 30 March-3 April 2003, pp. 1976-1986. [14] B. Sun, K. Wu and U. Pooch, “Secure Routing against Black-Hole Attack in Mobile Ad Hoc Networks,” Inter- national Conference on Communications and Computer Networks, Cambridge, 4-6 November 2002. [15] W. Du, L. Fang and P. Ning, “LAD: Localization Ano- maly Detection for Wireless Sensor Networks,” 19th In- ternational Parallel and Distributed Processing Sympo- sium, Denver, 4-8 April 2005, p. 41. [16] D. I. Curiac, O. Banias, F. Dragan, C. Volosencu and O. Dranga, “Malicious Node Detection in Wireless Sensor Networks Using an Autoregression Technique,” 3rd In- ternational Conference on Networking and Services, Ath- ens, 19-25 June 2007, p. 83. [17] W. Junior, T. Figueiredo, H. Wong and A. Loureiro, “Ma- licious Node Detection in Wireless Sensor Networks,” 18th International Parallel and Distributed Processing Sym- posium, Santa Fe, 26-30 April 2004, p. 24. [18] M. Momani and S. Challa, “Survey of Trust Models in Different Network Domain,” International Journal Ad Hoc, Sensor & Ubiquitous Computing, 2010. [19] I. M. Atakli, H. Hu, Y. Chen, W.-S. Ku and Z. Su, “Mali- cious Node Detection in Wireless Sensor Networks Using Weighted Trust Evaluation,” Proceedings of Spring Simu- lation Multiconference, Ottawa, 14-17 April 2008, pp. 836-843. [20] L. Ju, H. Li, Y. Liu, W. Xue, K. Li and Z. Chi, “An Im- proved Intrusion Detection Scheme Based on Weighted Trust Evaluation for Wireless Sensor Networks,” Pro- ceedings of the 5th International Conference on Ubiqui- tous Information Technology and Applications (CUTE), Sanya, 16-18 December 2010, pp. 1-6.
|