Paper Menu >>
Journal Menu >>
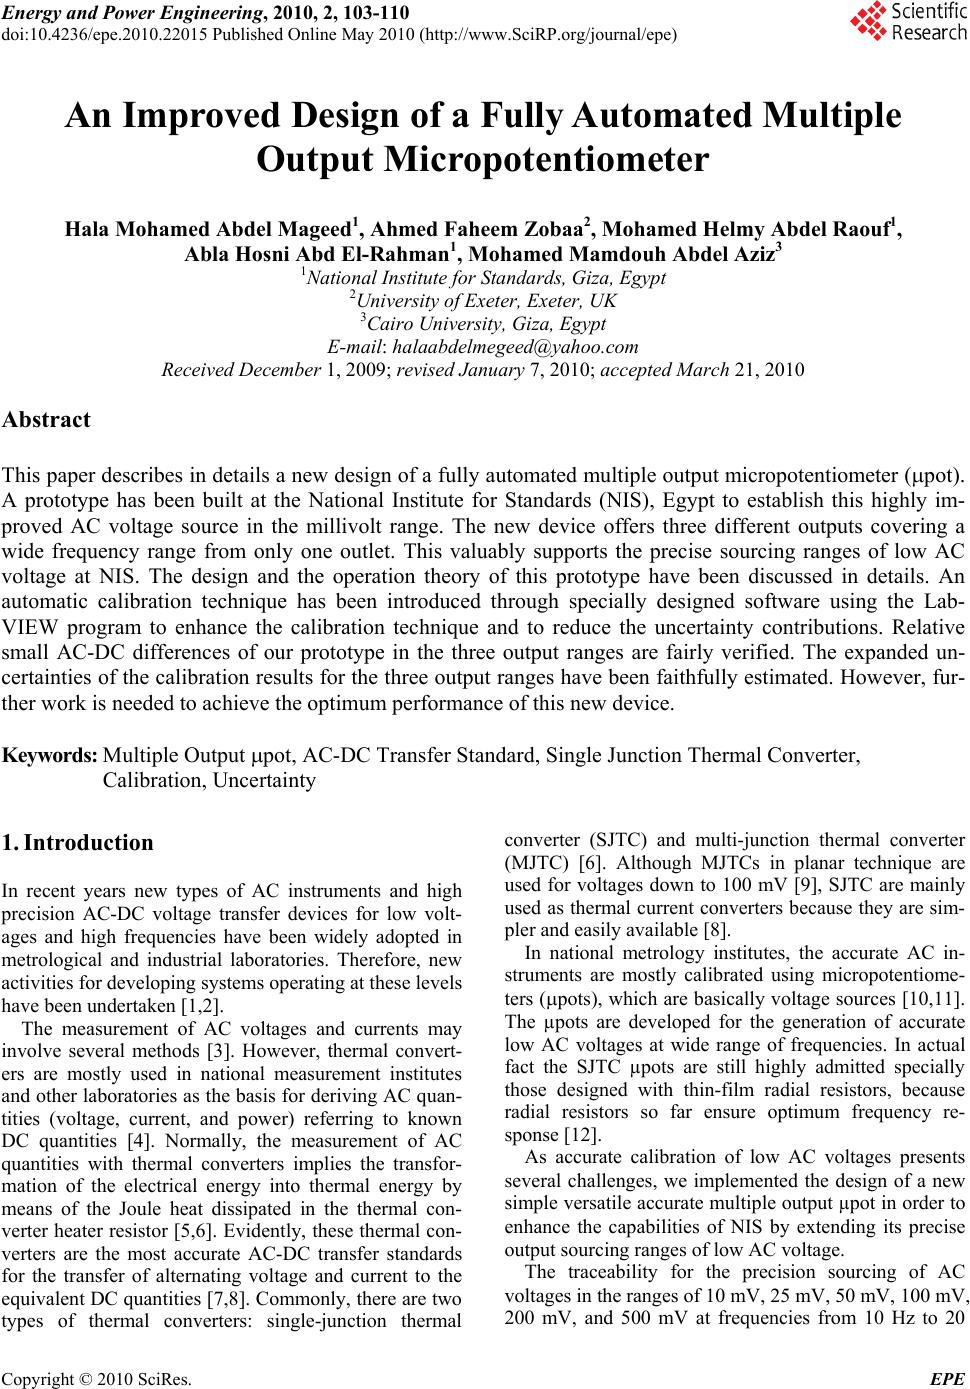 Energy and Power Engineering, 2010, 2, 103-110 doi:10.4236/epe.2010.22015 Published Online May 2010 (http://www.SciRP.org/journal/epe) Copyright © 2010 SciRes. EPE 103 An Improved Design of a Fully Automated Multiple Output Micropotentiometer Hala Mohamed Abdel Mageed1, Ahmed Faheem Zobaa2, Mohamed Helmy Abdel Raouf1, Abla Hosni Abd El-Rahman1, Mohamed Mamdouh Abdel Aziz3 1National Institute for Standards, Giza, Egypt 2University of Exeter, Exeter, UK 3Cairo University, Giza, Egypt E-mail: halaabdelmegeed@yahoo.com Received December 1, 2009; revised January 7, 2010; accepted March 21, 2010 Abstract This paper describes in details a new design of a fully automated multiple output micropotentiometer (pot). A prototype has been built at the National Institute for Standards (NIS), Egypt to establish this highly im- proved AC voltage source in the millivolt range. The new device offers three different outputs covering a wide frequency range from only one outlet. This valuably supports the precise sourcing ranges of low AC voltage at NIS. The design and the operation theory of this prototype have been discussed in details. An automatic calibration technique has been introduced through specially designed software using the Lab- VIEW program to enhance the calibration technique and to reduce the uncertainty contributions. Relative small AC-DC differences of our prototype in the three output ranges are fairly verified. The expanded un- certainties of the calibration results for the three output ranges have been faithfully estimated. However, fur- ther work is needed to achieve the optimum performance of this new device. Keywords: Multiple Output pot, AC-DC Transfer Standard, Single Junction Thermal Converter, Calibration, Uncertainty 1. Introduction In recent years new types of AC instruments and high precision AC-DC voltage transfer devices for low volt- ages and high frequencies have been widely adopted in metrological and industrial laboratories. Therefore, new activities for developing systems operating at these levels have been undertaken [1,2]. The measurement of AC voltages and currents may involve several methods [3]. However, thermal convert- ers are mostly used in national measurement institutes and other laboratories as the basis for deriving AC quan- tities (voltage, current, and power) referring to known DC quantities [4]. Normally, the measurement of AC quantities with thermal converters implies the transfor- mation of the electrical energy into thermal energy by means of the Joule heat dissipated in the thermal con- verter heater resistor [5,6]. Evidently, these thermal con- verters are the most accurate AC-DC transfer standards for the transfer of alternating voltage and current to the equivalent DC quantities [7,8]. Commonly, there are two types of thermal converters: single-junction thermal converter (SJTC) and multi-junction thermal converter (MJTC) [6]. Although MJTCs in planar technique are used for voltages down to 100 mV [9], SJTC are mainly used as thermal current converters because they are sim- pler and easily available [8]. In national metrology institutes, the accurate AC in- struments are mostly calibrated using micropotentiome- ters (pots), which are basically voltage sources [10,11]. The µpots are developed for the generation of accurate low AC voltages at wide range of frequencies. In actual fact the SJTC µpots are still highly admitted specially those designed with thin-film radial resistors, because radial resistors so far ensure optimum frequency re- sponse [12]. As accurate calibration of low AC voltages presents several challenges, we implemented the design of a new simple versatile accurate multiple output µpot in order to enhance the capabilities of NIS by extending its precise output sourcing ranges of low AC voltage. The traceability for the precision sourcing of AC voltages in the ranges of 10 mV, 25 mV, 50 mV, 100 mV, 200 mV, and 500 mV at frequencies from 10 Hz to 20 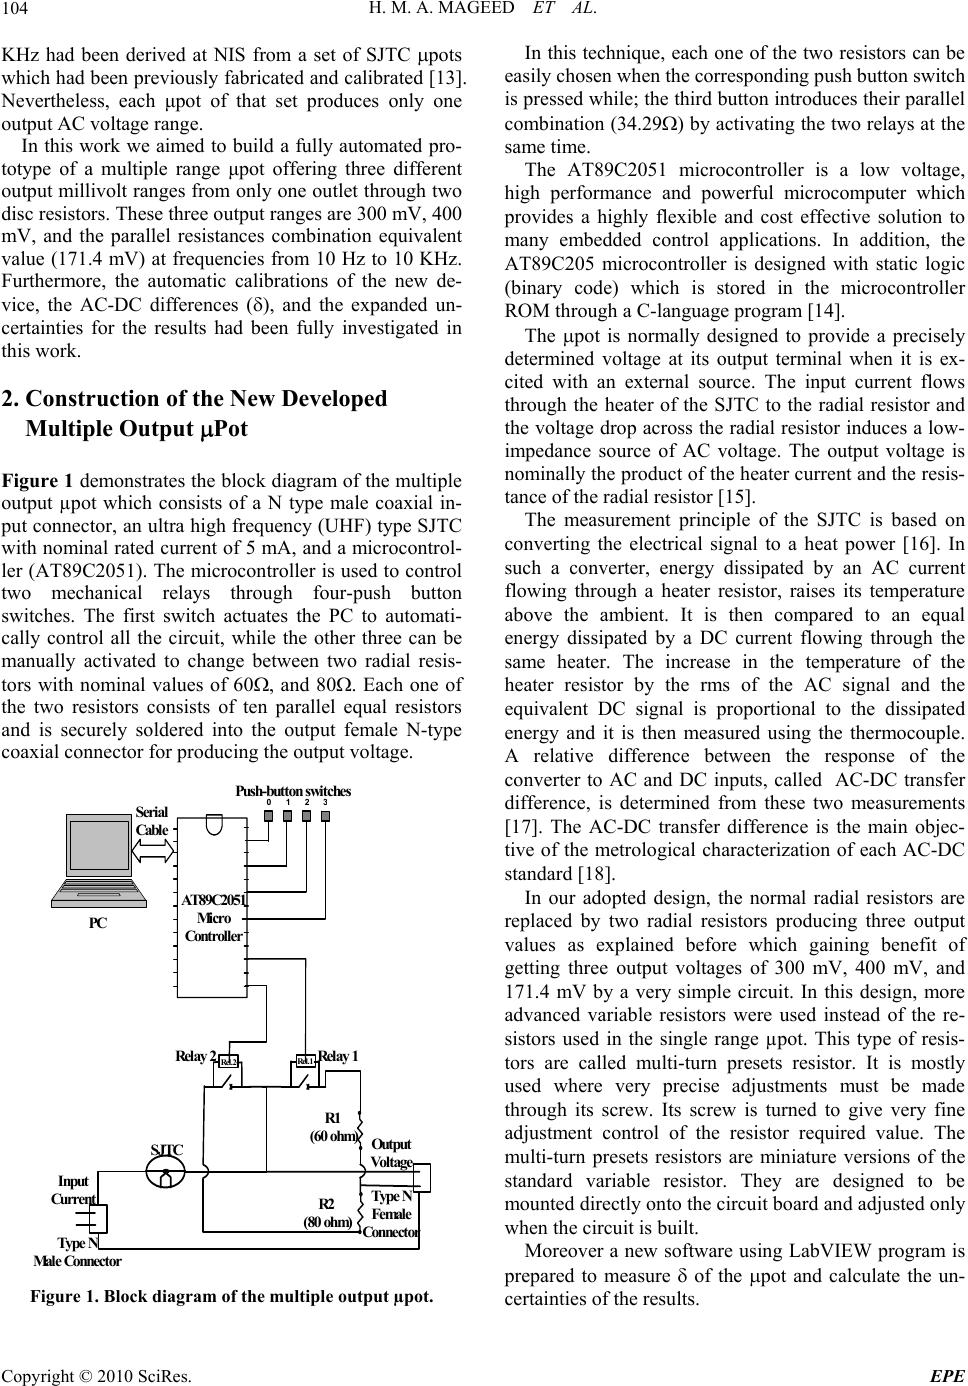 H. M. A. MAGEED ET AL. 104 KHz had been derived at NIS from a set of SJTC pots which had been previously fabricated and calibrated [13]. Nevertheless, each μpot of that set produces only one output AC voltage range. In this work we aimed to build a fully automated pro- totype of a multiple range μpot offering three different output millivolt ranges from only one outlet through two disc resistors. These three output ranges are 300 mV, 400 mV, and the parallel resistances combination equivalent value (171.4 mV) at frequencies from 10 Hz to 10 KHz. Furthermore, the automatic calibrations of the new de- vice, the AC-DC differences (), and the expanded un- certainties for the results had been fully investigated in this work. 2. Construction of the New Developed Multiple Output Pot Figure 1 demonstrates the block diagram of the multiple output µpot which consists of a N type male coaxial in- put connector, an ultra high frequency (UHF) type SJTC with nominal rated current of 5 mA, and a microcontrol- ler (AT89C2051). The microcontroller is used to control two mechanical relays through four-push button switches. The first switch actuates the PC to automati- cally control all the circuit, while the other three can be manually activated to change between two radial resis- tors with nominal values of 60, and 80. Each one of the two resistors consists of ten parallel equal resistors and is securely soldered into the output female N-type coaxial connector for producing the output voltage. 3 2 1 0 AT89C2051 Mic ro Controller P C Serial Cable Input Current Relay 1 Relay 2 P us h - button switches R el . 2 R el . 1 SJTC R1 (60 ohm)Output Vol t age R2 (80 ohm) Type N Male Connecto r Type N Female Connector Figure 1. Block diagram of the multiple output µpot. In this technique, each one of the two resistors can be easily chosen when the corresponding push button switch is pressed while; the third button introduces their parallel combination (34.29) by activating the two relays at the same time. The AT89C2051 microcontroller is a low voltage, high performance and powerful microcomputer which provides a highly flexible and cost effective solution to many embedded control applications. In addition, the AT89C205 microcontroller is designed with static logic (binary code) which is stored in the microcontroller ROM through a C-language program [14]. The pot is normally designed to provide a precisely determined voltage at its output terminal when it is ex- cited with an external source. The input current flows through the heater of the SJTC to the radial resistor and the voltage drop across the radial resistor induces a low- impedance source of AC voltage. The output voltage is nominally the product of the heater current and the resis- tance of the radial resistor [15]. The measurement principle of the SJTC is based on converting the electrical signal to a heat power [16]. In such a converter, energy dissipated by an AC current flowing through a heater resistor, raises its temperature above the ambient. It is then compared to an equal energy dissipated by a DC current flowing through the same heater. The increase in the temperature of the heater resistor by the rms of the AC signal and the equivalent DC signal is proportional to the dissipated energy and it is then measured using the thermocouple. A relative difference between the response of the converter to AC and DC inputs, called AC-DC transfer difference, is determined from these two measurements [17]. The AC-DC transfer difference is the main objec- tive of the metrological characterization of each AC-DC standard [18]. In our adopted design, the normal radial resistors are replaced by two radial resistors producing three output values as explained before which gaining benefit of getting three output voltages of 300 mV, 400 mV, and 171.4 mV by a very simple circuit. In this design, more advanced variable resistors were used instead of the re- sistors used in the single range µpot. This type of resis- tors are called multi-turn presets resistor. It is mostly used where very precise adjustments must be made through its screw. Its screw is turned to give very fine adjustment control of the resistor required value. The multi-turn presets resistors are miniature versions of the standard variable resistor. They are designed to be mounted directly onto the circuit board and adjusted only when the circuit is built. Moreover a new software using LabVIEW program is prepared to measure of the pot and calculate the un- certainties of the results. Copyright © 2010 SciRes. EPE 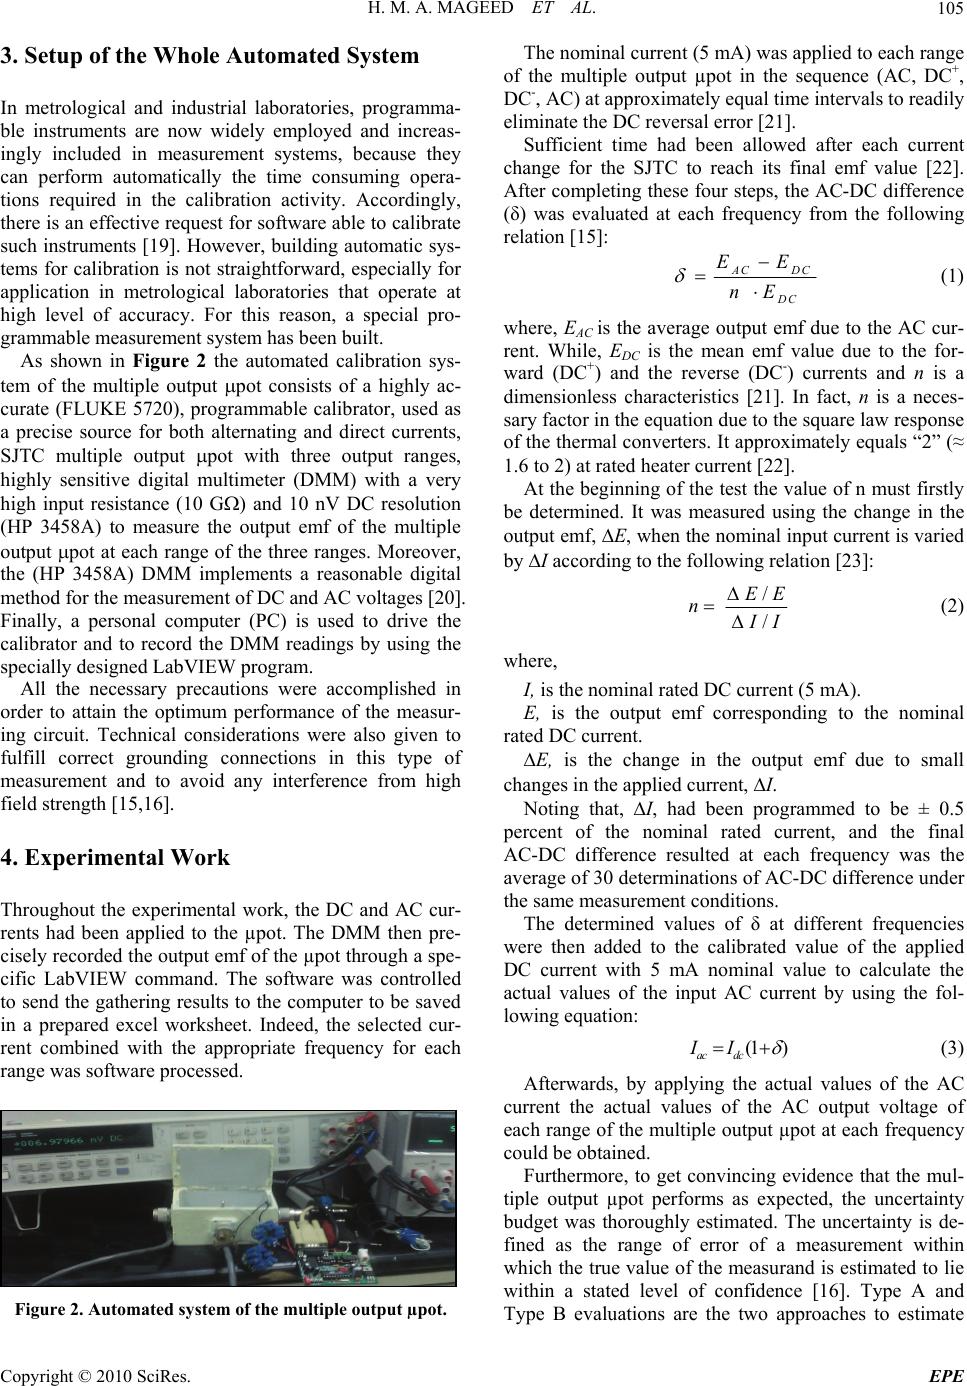 H. M. A. MAGEED ET AL.105 3. Setup of the Whole Automated System In metrological and industrial laboratories, programma- ble instruments are now widely employed and increas- ingly included in measurement systems, because they can perform automatically the time consuming opera- tions required in the calibration activity. Accordingly, there is an effective request for software able to calibrate such instruments [19]. However, building automatic sys- tems for calibration is not straightforward, especially for application in metrological laboratories that operate at high level of accuracy. For this reason, a special pro- grammable measurement system has been built. As shown in Figure 2 the automated calibration sys- tem of the multiple output pot consists of a highly ac- curate (FLUKE 5720), programmable calibrator, used as a precise source for both alternating and direct currents, SJTC multiple output pot with three output ranges, highly sensitive digital multimeter (DMM) with a very high input resistance (10 G) and 10 nV DC resolution (HP 3458A) to measure the output emf of the multiple output pot at each range of the three ranges. Moreover, the (HP 3458A) DMM implements a reasonable digital method for the measurement of DC and AC voltages [20]. Finally, a personal computer (PC) is used to drive the calibrator and to record the DMM readings by using the specially designed LabVIEW program. All the necessary precautions were accomplished in order to attain the optimum performance of the measur- ing circuit. Technical considerations were also given to fulfill correct grounding connections in this type of measurement and to avoid any interference from high field strength [15,16]. 4. Experimental Work Throughout the experimental work, the DC and AC cur- rents had been applied to the µpot. The DMM then pre- cisely recorded the output emf of the µpot through a spe- cific LabVIEW command. The software was controlled to send the gathering results to the computer to be saved in a prepared excel worksheet. Indeed, the selected cur- rent combined with the appropriate frequency for each range was software processed. Figure 2. Automated system of the multiple output µpot. The nominal current (5 mA) was applied to each range of the multiple output µpot in the sequence (AC, DC+, DC-, AC) at approximately equal time intervals to readily eliminate the DC reversal error [21]. Sufficient time had been allowed after each current change for the SJTC to reach its final emf value [22]. After completing these four steps, the AC-DC difference (δ) was evaluated at each frequency from the following relation [15]: AC DC DC EE nE (1) where, EAC is the average output emf due to the AC cur- rent. While, EDC is the mean emf value due to the for- ward (DC+) and the reverse (DC-) currents and n is a dimensionless characteristics [21]. In fact, n is a neces- sary factor in the equation due to the square law response of the thermal converters. It approximately equals “2” (≈ 1.6 to 2) at rated heater current [22]. At the beginning of the test the value of n must firstly be determined. It was measured using the change in the output emf, E, when the nominal input current is varied by I according to the following relation [23]: / / EE n I I (2) where, I, is the nominal rated DC current (5 mA). E, is the output emf corresponding to the nominal rated DC current. E, is the change in the output emf due to small changes in the applied current, I. Noting that, I, had been programmed to be ± 0.5 percent of the nominal rated current, and the final AC-DC difference resulted at each frequency was the average of 30 determinations of AC-DC difference under the same measurement conditions. The determined values of δ at different frequencies were then added to the calibrated value of the applied DC current with 5 mA nominal value to calculate the actual values of the input AC current by using the fol- lowing equation: (1 ) ac dc II (3) Afterwards, by applying the actual values of the AC current the actual values of the AC output voltage of each range of the multiple output µpot at each frequency could be obtained. Furthermore, to get convincing evidence that the mul- tiple output µpot performs as expected, the uncertainty budget was thoroughly estimated. The uncertainty is de- fined as the range of error of a measurement within which the true value of the measurand is estimated to lie within a stated level of confidence [16]. Type A and Type B evaluations are the two approaches to estimate Copyright © 2010 SciRes. EPE  H. M. A. MAGEED ET AL. Copyright © 2010 SciRes. EPE 106 the uncertainty sources. It is cleared that, the AC-DC differences for the three output ranges of the multiple output µpot are fairly small at frequencies from 10 Hz to 10 KHz, as it is known that µpots can be used to generate AC voltage signals in mil- livolt ranges from 10 Hz to 1 MHz with AC-DC differ- ences ranging from 20 ppm to 1000 ppm [25]. For AC-DC measurements, the Type B uncertainties are generally dominating [23]. Type A evaluations of standard uncertainty components are founded on normal distributions, while type B evaluations are founded on a suitable chosen distributions. The combined standard uncertainty equals to the Root Sum Square (RSS), of all the uncertainty contributions [16,24]. All components of the combined standard un- certainty (Type A, Type B) were taken into consideration. The expanded uncertainties of the multiple output µpot were calculated with confidence level of 95% (coverage factor K = 2). The gained results show that from 20 Hz to 1 KHz the multiple output µpot has a very stable output where the AC-DC differences are much smaller than the lower limit of the admitted AC-DC differences range. Although, at 10 Hz and 10 KHz the AC-DC differ- ences are relatively high, they are still very near to the lower limit. However, rather different but not highly ef- fective behavior appeared at the 10 KHz for the 400 mV output where it shows a negative sign with its . This is most probably due to some dielectric losses inherent in the resistors. 5. Results and Discussion The results obtained at the rated current for n of each voltage range were 1.69, 1.72, and 1.73 for the 300 mV, the 400 mV and the 171.4 mV output AC voltage respec- tively. Also, the AC-DC differences for the three ranges of the µpot had been fully investigated. They are pre- sented in Table 1 and Figure 3. The plots illustrate the AC-DC differences of the 300 mV, 400 mV, and 171.4 mV ranges at frequencies from 10 Hz to 10 KHz in part per million (ppm). Also, the of the 171.4 mV output at 10 KHz is rela- tively high due to factors contribute to frequency and voltage dependant errors. In fact this needs more careful investigation to reach the optimum design performance. Nevertheless, the AC-DC differences of our developed multiple output µpot faithfully prove to be highly suc- cessful. Tables 2-4 illustrate all the components of the uncer- tainty budget for the multiple output µpot three ranges respectively. -4 0 -2 0 0 20 40 60 80 100 101001000 10000 Frequency (Hz) AC-DC Difference (ppm) AC-DC Difference of 171.4 mV AC-DC Difference of 300 mV AC-DC Difference of 400 mV The AC input currents, and AC output voltages for the three voltage ranges at 10 Hz to 10 KHz combined with the corresponding expanded uncertainties are listed in Tables 5-7. It is clearly shown from the tables that, the expanded uncertainties of the multiple output µpot proved to be less than 5 ppm for all values. This presents that the out- put voltages of the multiple output µpot are very satis- factory. 6. Conclusions Figure 3. AC-DC difference of the 300 mV, 400 mV, 171.4 mV ranges (ppm). It is fairly demonstrated that our new design provides a Table 1. Results of the AC-DC differences of the 300 mV, 400 mV, and 171.4 mV ranges at different frequencies. Frequency (Hz) (300 mV Range) (ppm) (400 mV Range) (ppm) (171.4 mV Range) (ppm) 10 27 24 25 20 14.2 14 14.6 40 10.2 11 11 50 11.3 10 9.7 100 6.6 11 10 200 9.3 7 8.8 400 6.8 4 7.8 1000 2.2 2 4.4 10000 25.6 –31.5 78.7 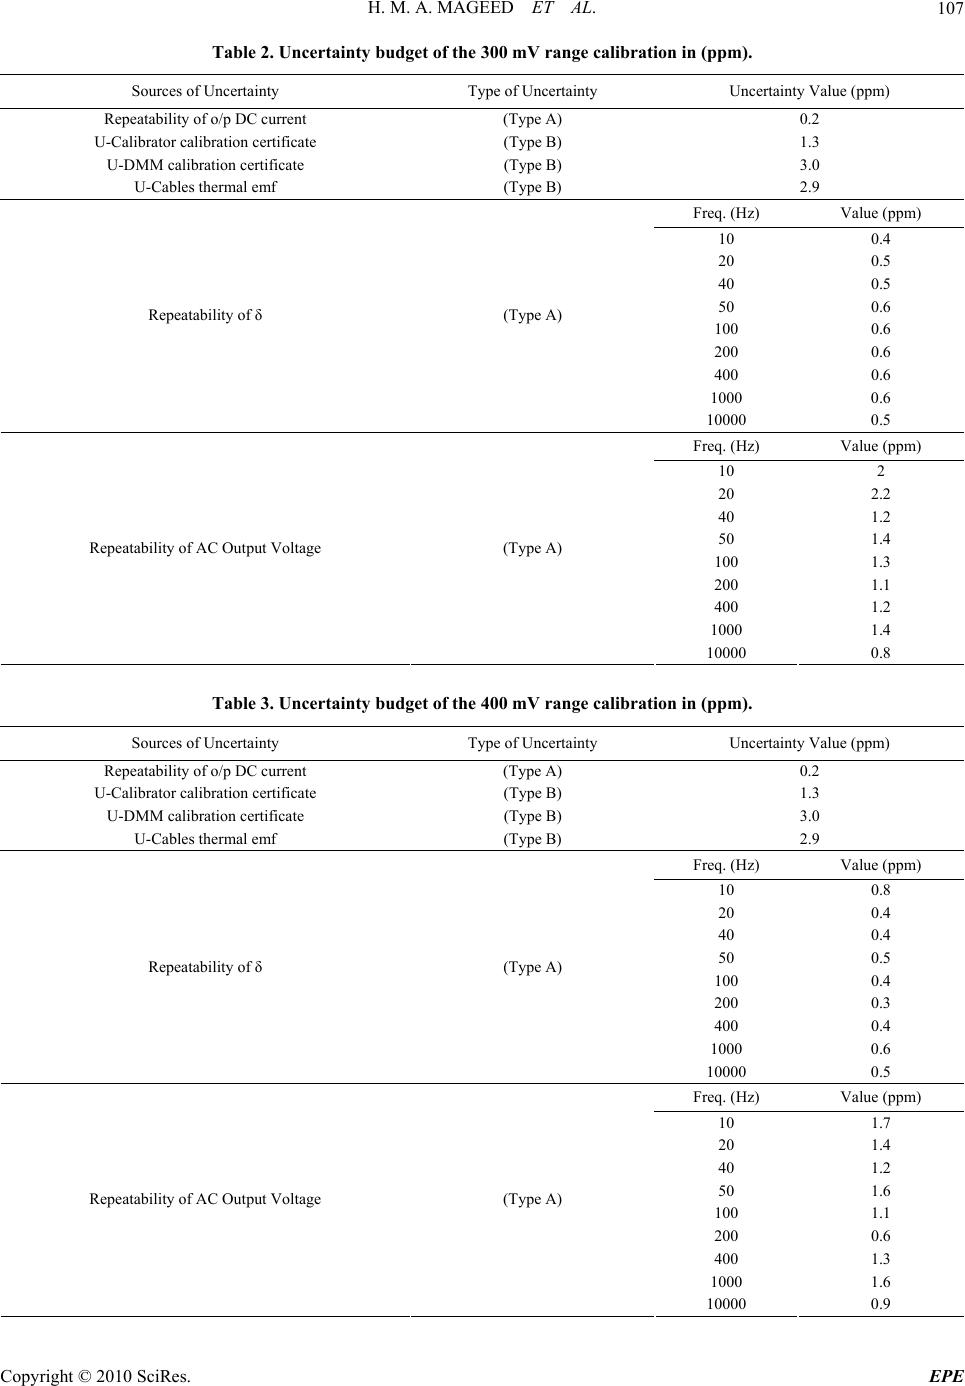 H. M. A. MAGEED ET AL.107 Table 2. Uncertainty budget of the 300 mV range calibration in (ppm). Sources of Uncertainty Type of Uncertainty Uncertainty Value (ppm) Repeatability of o/p DC current (Type A) 0.2 U-Calibrator calibration certificate (Type B) 1.3 U-DMM calibration certificate (Type B) 3.0 U-Cables thermal emf (Type B) 2.9 Freq. (Hz) Value (ppm) 10 0.4 20 0.5 40 0.5 50 0.6 100 0.6 200 0.6 400 0.6 1000 0.6 Repeatability of δ (Type A) 10000 0.5 Freq. (Hz) Value (ppm) 10 2 20 2.2 40 1.2 50 1.4 100 1.3 200 1.1 400 1.2 1000 1.4 Repeatability of AC Output Voltage (Type A) 10000 0.8 Table 3. Uncertainty budget of the 400 mV range calibration in (ppm). Sources of Uncertainty Type of Uncertainty Uncertainty Value (ppm) Repeatability of o/p DC current (Type A) 0.2 U-Calibrator calibration certificate (Type B) 1.3 U-DMM calibration certificate (Type B) 3.0 U-Cables thermal emf (Type B) 2.9 Freq. (Hz) Value (ppm) 10 0.8 20 0.4 40 0.4 50 0.5 100 0.4 200 0.3 400 0.4 1000 0.6 Repeatability of δ (Type A) 10000 0.5 Freq. (Hz) Value (ppm) 10 1.7 20 1.4 40 1.2 50 1.6 100 1.1 200 0.6 400 1.3 1000 1.6 Repeatability of AC Output Voltage (Type A) 10000 0.9 Copyright © 2010 SciRes. EPE 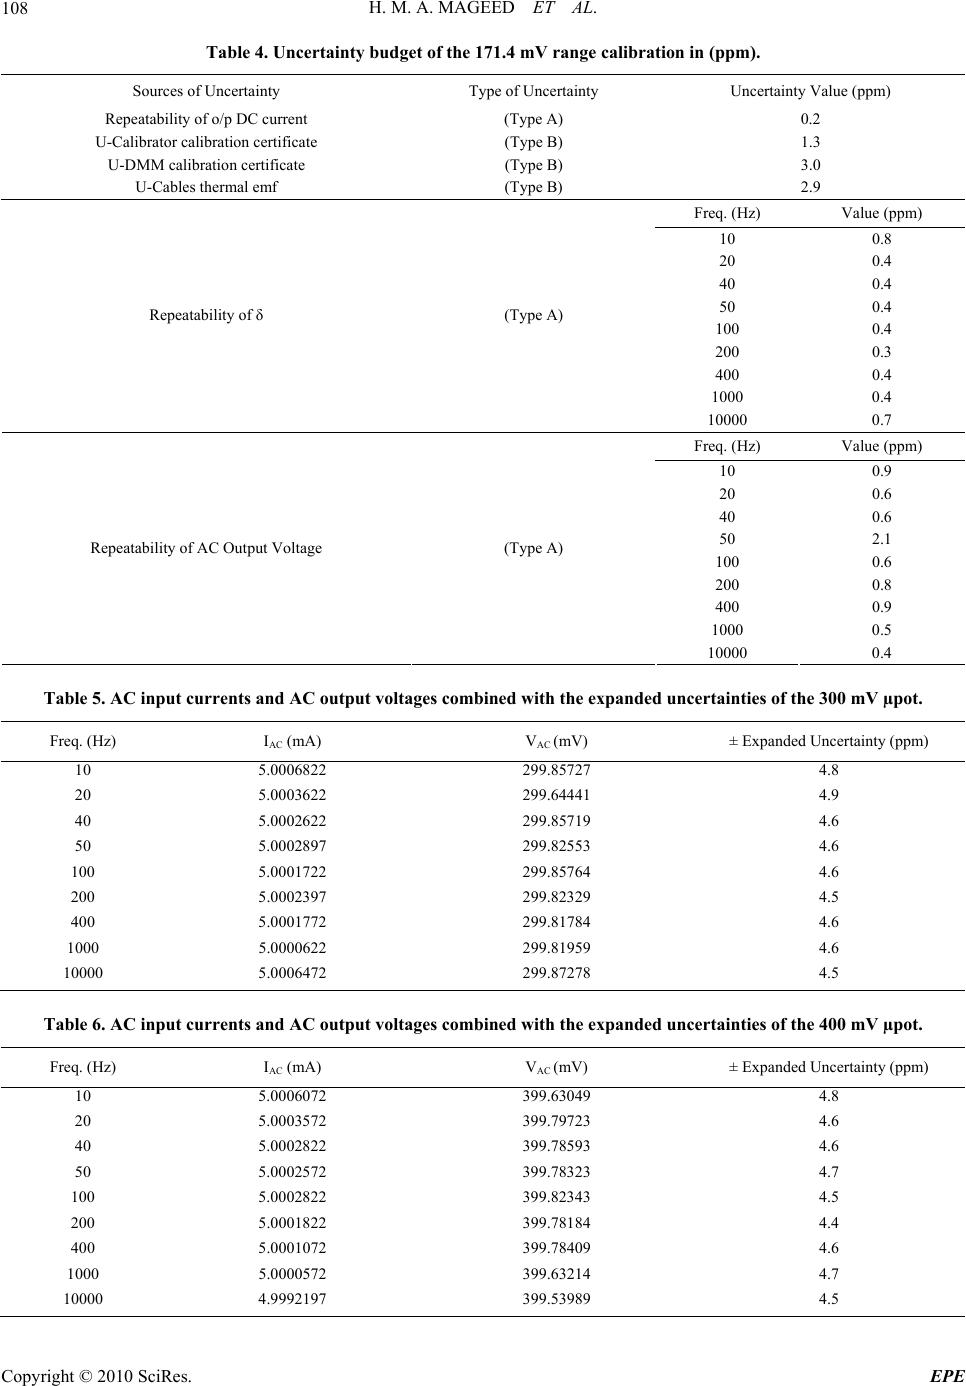 H. M. A. MAGEED ET AL. 108 Table 4. Uncertainty budget of the 171.4 mV range calibration in (ppm). Sources of Uncertainty Type of Uncertainty Uncertainty Value (ppm) Repeatability of o/p DC current (Type A) 0.2 U-Calibrator calibration certificate (Type B) 1.3 U-DMM calibration certificate (Type B) 3.0 U-Cables thermal emf (Type B) 2.9 Freq. (Hz) Value (ppm) 10 0.8 20 0.4 40 0.4 50 0.4 100 0.4 200 0.3 400 0.4 1000 0.4 Repeatability of δ (Type A) 10000 0.7 Freq. (Hz) Value (ppm) 10 0.9 20 0.6 40 0.6 50 2.1 100 0.6 200 0.8 400 0.9 1000 0.5 Repeatability of AC Output Voltage (Type A) 10000 0.4 Table 5. AC input currents and AC output voltages combined with the expanded uncertainties of the 300 mV µpot. Freq. (Hz) IAC (mA) VAC (mV) ± Expanded Uncertainty (ppm) 10 5.0006822 299.85727 4.8 20 5.0003622 299.64441 4.9 40 5.0002622 299.85719 4.6 50 5.0002897 299.82553 4.6 100 5.0001722 299.85764 4.6 200 5.0002397 299.82329 4.5 400 5.0001772 299.81784 4.6 1000 5.0000622 299.81959 4.6 10000 5.0006472 299.87278 4.5 Table 6. AC input currents and AC output voltages combined with the expanded uncertainties of the 400 mV µpot. Freq. (Hz) IAC (mA) VAC (mV) ± Expanded Uncertainty (ppm) 10 5.0006072 399.63049 4.8 20 5.0003572 399.79723 4.6 40 5.0002822 399.78593 4.6 50 5.0002572 399.78323 4.7 100 5.0002822 399.82343 4.5 200 5.0001822 399.78184 4.4 400 5.0001072 399.78409 4.6 1000 5.0000572 399.63214 4.7 10000 4.9992197 399.53989 4.5 Copyright © 2010 SciRes. EPE 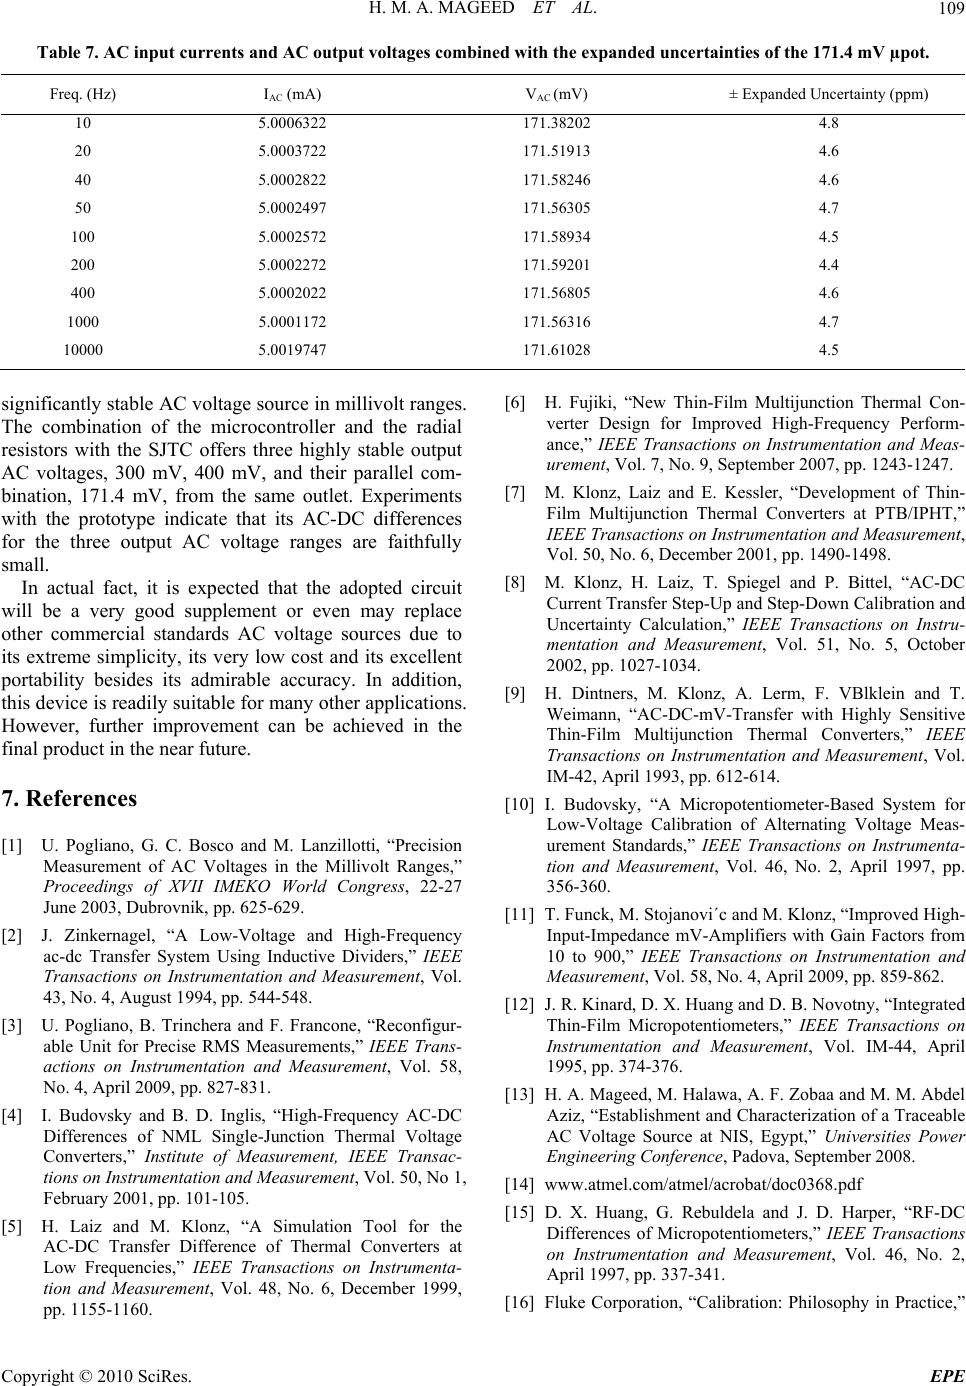 H. M. A. MAGEED ET AL. Copyright © 2010 SciRes. EPE 109 Table 7. AC input currents and AC output voltages combined with the expanded uncertainties of the 171.4 mV µpot. Freq. (Hz) IAC (mA) VAC (mV) ± Expanded Uncertainty (ppm) 10 5.0006322 171.38202 4.8 20 5.0003722 171.51913 4.6 40 5.0002822 171.58246 4.6 50 5.0002497 171.56305 4.7 100 5.0002572 171.58934 4.5 200 5.0002272 171.59201 4.4 400 5.0002022 171.56805 4.6 1000 5.0001172 171.56316 4.7 10000 5.0019747 171.61028 4.5 significantly stable AC voltage source in millivolt ranges. The combination of the microcontroller and the radial resistors with the SJTC offers three highly stable output AC voltages, 300 mV, 400 mV, and their parallel com- bination, 171.4 mV, from the same outlet. Experiments with the prototype indicate that its AC-DC differences for the three output AC voltage ranges are faithfully small. In actual fact, it is expected that the adopted circuit will be a very good supplement or even may replace other commercial standards AC voltage sources due to its extreme simplicity, its very low cost and its excellent portability besides its admirable accuracy. In addition, this device is readily suitable for many other applications. However, further improvement can be achieved in the final product in the near future. 7 . References [1] U. Pogliano, G. C. Bosco and M. Lanzillotti, “Precision Measurement of AC Voltages in the Millivolt Ranges,” Proceedings of XVII IMEKO World Congress, 22-27 June 2003, Dubrovnik, pp. 625-629. [2] J. Zinkernagel, “A Low-Voltage and High-Frequency ac-dc Transfer System Using Inductive Dividers,” IEEE Transactions on Instrumentation and Measurement, Vol. 43, No. 4, August 1994, pp. 544-548. [3] U. Pogliano, B. Trinchera and F. Francone, “Reconfigur- able Unit for Precise RMS Measurements,” IEEE Trans- actions on Instrumentation and Measurement, Vol. 58, No. 4, April 2009, pp. 827-831. [4] I. Budovsky and B. D. Inglis, “High-Frequency AC-DC Differences of NML Single-Junction Thermal Voltage Converters,” Institute of Measurement, IEEE Transac- tions on Instrumentation and Measurement, Vol. 50, No 1, February 2001, pp. 101-105. [5] H. Laiz and M. Klonz, “A Simulation Tool for the AC-DC Transfer Difference of Thermal Converters at Low Frequencies,” IEEE Transactions on Instrumenta- tion and Measurement, Vol. 48, No. 6, December 1999, pp. 1155-1160. [6] H. Fujiki, “New Thin-Film Multijunction Thermal Con- verter Design for Improved High-Frequency Perform- ance,” IEEE Transactions on Instrumentation and Meas- urement, Vol. 7, No. 9, September 2007, pp. 1243-1247. [7] M. Klonz, Laiz and E. Kessler, “Development of Thin- Film Multijunction Thermal Converters at PTB/IPHT,” IEEE Transactions on Instrumentation and Measurement, Vol. 50, No. 6, December 2001, pp. 1490-1498. [8] M. Klonz, H. Laiz, T. Spiegel and P. Bittel, “AC-DC Current Transfer Step-Up and Step-Down Calibration and Uncertainty Calculation,” IEEE Transactions on Instru- mentation and Measurement, Vol. 51, No. 5, October 2002, pp. 1027-1034. [9] H. Dintners, M. Klonz, A. Lerm, F. VBlklein and T. Weimann, “AC-DC-mV-Transfer with Highly Sensitive Thin-Film Multijunction Thermal Converters,” IEEE Transactions on Instrumentation and Measurement, Vol. IM-42, April 1993, pp. 612-614. [10] I. Budovsky, “A Micropotentiometer-Based System for Low-Voltage Calibration of Alternating Voltage Meas- urement Standards,” IEEE Transactions on Instrumenta- tion and Measurement, Vol. 46, No. 2, April 1997, pp. 356-360. [11] T. Funck, M. Stojanovi´c and M. Klonz, “Improved High- Input-Impedance mV-Amplifiers with Gain Factors from 10 to 900,” IEEE Transactions on Instrumentation and Measurement, Vol. 58, No. 4, April 2009, pp. 859-862. [12] J. R. Kinard, D. X. Huang and D. B. Novotny, “Integrated Thin-Film Micropotentiometers,” IEEE Transactions on Instrumentation and Measurement, Vol. IM-44, April 1995, pp. 374-376. [13] H. A. Mageed, M. Halawa, A. F. Zobaa and M. M. Abdel Aziz, “Establishment and Characterization of a Traceable AC Voltage Source at NIS, Egypt,” Universities Power Engineering Conference, Padova, September 2008. [14] www.atmel.com/atmel/acrobat/doc0368.pdf [15] D. X. Huang, G. Rebuldela and J. D. Harper, “RF-DC Differences of Micropotentiometers,” IEEE Transactions on Instrumentation and Measurement, Vol. 46, No. 2, April 1997, pp. 337-341. [16] Fluke Corporation, “Calibration: Philosophy in Practice,” 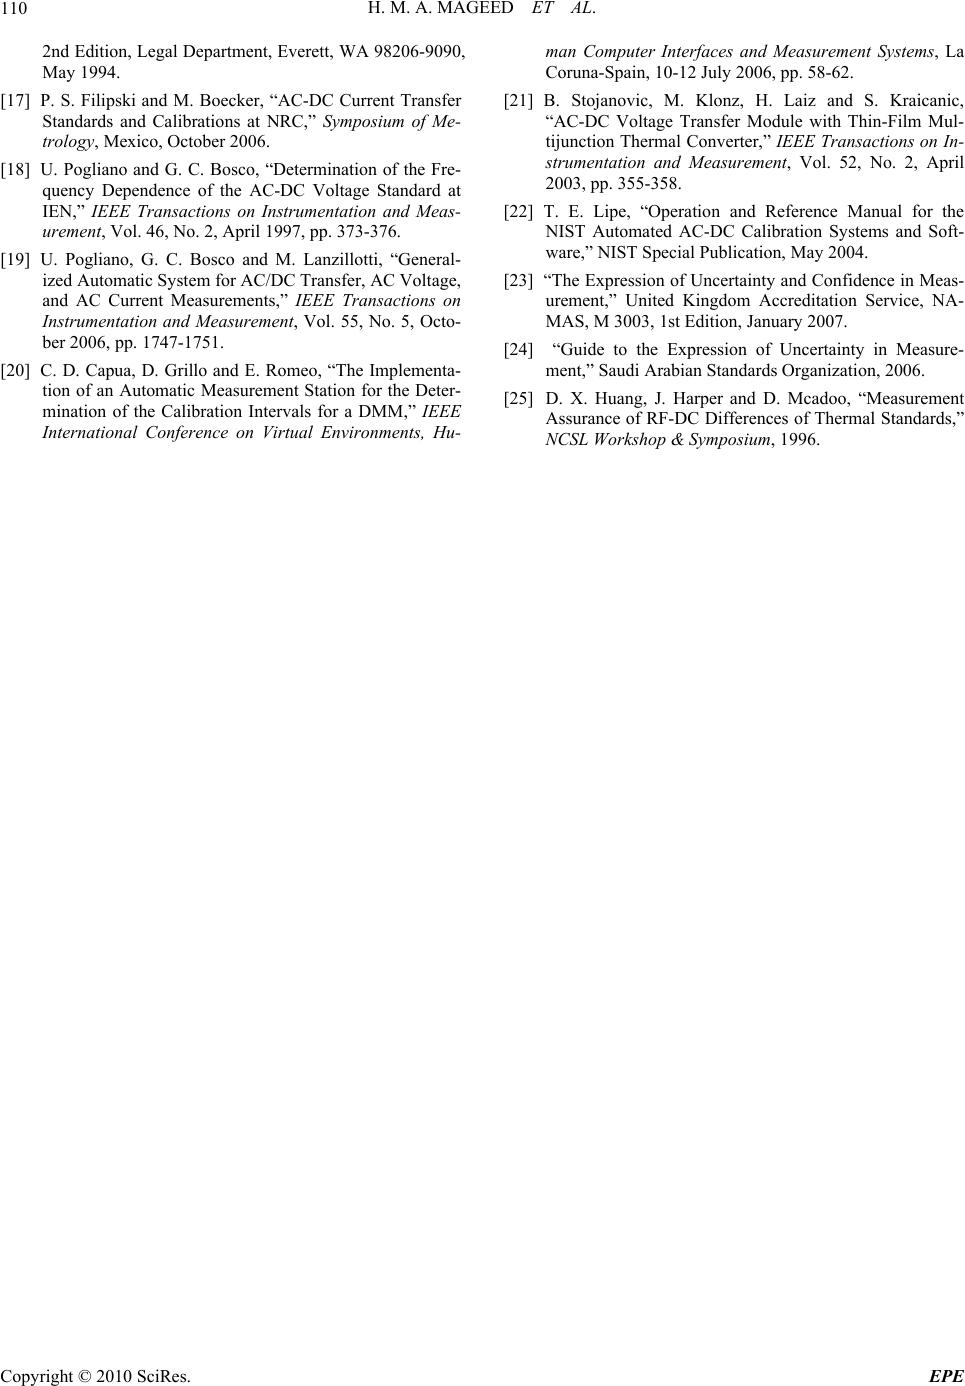 H. M. A. MAGEED ET AL. 110 2nd Edition, Legal Department, Everett, WA 98206-9090, May 1994. [17] P. S. Filipski and M. Boecker, “AC-DC Current Transfer Standards and Calibrations at NRC,” Symposium of Me- trology, Mexico, October 2006. [18] U. Pogliano and G. C. Bosco, “Determination of the Fre- quency Dependence of the AC-DC Voltage Standard at IEN,” IEEE Transactions on Instrumentation and Meas- urement, Vol. 46, No. 2, April 1997, pp. 373-376. [19] U. Pogliano, G. C. Bosco and M. Lanzillotti, “General- ized Automatic System for AC/DC Transfer, AC Voltage, and AC Current Measurements,” IEEE Transactions on Instrumentation and Measurement, Vol. 55, No. 5, Octo- ber 2006, pp. 1747-1751. [20] C. D. Capua, D. Grillo and E. Romeo, “The Implementa- tion of an Automatic Measurement Station for the Deter- mination of the Calibration Intervals for a DMM,” IEEE International Conference on Virtual Environments, Hu- man Computer Interfaces and Measurement Systems, La Coruna-Spain, 10-12 July 2006, pp. 58-62. [21] B. Stojanovic, M. Klonz, H. Laiz and S. Kraicanic, “AC-DC Voltage Transfer Module with Thin-Film Mul- tijunction Thermal Converter,” IEEE Transactions on In- strumentation and Measurement, Vol. 52, No. 2, April 2003, pp. 355-358. [22] T. E. Lipe, “Operation and Reference Manual for the NIST Automated AC-DC Calibration Systems and Soft- ware,” NIST Special Publication, May 2004. [23] “The Expression of Uncertainty and Confidence in Meas- urement,” United Kingdom Accreditation Service, NA- MAS, M 3003, 1st Edition, January 2007. [24] “Guide to the Expression of Uncertainty in Measure- ment,” Saudi Arabian Standards Organization, 2006. [25] D. X. Huang, J. Harper and D. Mcadoo, “Measurement Assurance of RF-DC Differences of Thermal Standards,” NCSL Workshop & Symposium, 1996. Copyright © 2010 SciRes. EPE |