Open Journal of Soil Science, 2012, 2, 55-63
http://dx.doi.org/10.4236/ojss.2012.21009 Published Online March 2012 (http://www.SciRP.org/journal/ojss)
55
Quantification of I nositol Hexa-Kis Phosphate in
Environmental Samples
Lynne P. Heighton1, Merle Zimmerman1, Clifford P. Rice2, Eton E. Codling2, John A. Tossell1,3,
Walter F. Schmidt2
1Department of Chemistry and Biochemistry, University of Maryland, College Park, USA; 2EMBUL ARS, USDA, Beltsville, USA;
3George Washington University, Department of Chemistry, Ashburn, USA.
Email: schmidtw@ba.ars.usda.gov
Received January 14th, 2012; revised January 19th, 2012; accepted January 31st, 2012
ABSTRACT
Phosphorous (P) is a major contributor to eutrophication of surface waters, yet a complete understanding of the P cycle
remains elusive. Inositol hexa-kis phosphate (IHP) is the primary form of organic (PO) in the environment and has been
implicated as an important sink in aquatic and terrestrial samples. IHP readily forms complexes in the environment due
to the 12 acidic sites on the molecule. Quantification of IHP in environmental samples has typically relied on harsh ex-
traction methods that limit understanding of IHP interactions with potential soil and aquatic complexation partners. The
ability to quantify IHP in - si tu at the pH of existing soils provides direct access to the role of IHP in the P cycle. Since it
is itself a buffer, adjusting the pH correspondingly alters charged species of IHP present in soil. Density Functional
Theory (DFT) calculations support the charged species assignments made based pKas associated with the IHP molecule.
Raman spectroscopy was used to generate pH dependent spectra of inorganic (PI) and IHP as well as (PO) from IHP and
(PI) in soil samples. Electro-spray ionization mass spectroscopy (ESI-MS) was used to quantify IHP-Iron complexes in
two soil samples using a neutral aqueous extraction.
Keywords: Phytic Acid; Inositol Hexkis Phosphate; Electrospray Mass Spectroscopy (ESI-MS); Density Functional
Theory (DFT); Raman Spectroscopy
1. Introduction
Increasingly it is understood that organic phosphorus (PO)
impacts environmental processes to a greater degree than
has historically been given credence which has resulted
in a lack of understanding of PO fate and transport when
compared to inorganic phosphate (PI) [1-5]. Inositol pho-
sphates specifically myo-inositol hex-kis phosphate (IHP)
or phytic acid is the most prevalent form of PO in soil
systems [6-9]. Phytate anions and inorganic phosphate
form complexes with metal cations that impact bioavaila-
bility of P and other trace nutrients in plants [10-13]. Ne-
gative impact occurs to open waterways from excessive
loading of P from agricultural land resulting in the sub-
sequent eutrophication. This process, as well as the inabi-
lity to trace biological conversion processes to and from
PI to PO in terrestrial and aquatic environments, could be
better understood and thereby impacted by the identifica-
tion and quantification of IHP and the metal-IHP com-
plexes [1,4,14]. IHP has been implicated both positively
and negatively in nutritional studies due to its ability to
complex metals and the inability of many animal species
to access the phosphorus from IHP [4,14-16]. The disso-
ciation of phytic acid results in acidic protons and a cor-
responding conjugate base. Each of the six phosphate
groups has two acidic protons disassociating from the
phytate anion at progressively higher pH and charge
[10,11]. At the molecular level, it is ambiguous whether
some, all or none of the six acidic sites have specific pKa
values, i.e. are equally acidic. Raman spectra of IHP have
been shown to differ with pH. This is consistent with the
non-equivalence among acidic P sites on IHP. Computa-
tional chemistry using Density Functional Theory (DFT)
has been successfully used to characterize physical pro-
perties of chemical structures from quantum mechanical
principles and could provide a molecular basis for cha-
racterizing the relative acidity of the IHP phosphate groups
[17].
Electro-spray ionization (ESI-MS) provides a unique
and precise method to investigate the parent ions of phy-
tate and phytate-cation complexes at multiple pH values
[18]. The procedure provides useful information about
phytate speciation in more complicated matrixes, as well
as in obtaining association constants required for model-
ing the fate of PO in complex environmental systems.
More broadly, adding multivalent cations (or anions) to
Copyright © 2012 SciRes. OJSS
Quantification of Inositol Hexa-Kis Phosphate in Environmental Samples
56
the mobile phase in ESI-MS can assist in identifying pre-
viously unassigned fragments from multi-charged anionic
(or cationic) species. As cations of iron are the most abun-
dant metal in soil systems, Fe+3 (and Fe+2) is (are) the
clear choice for investigation of in-situ IHP-metal com-
plexes.
2. Materials and Methods
Soil Sample History. Two Maryland soils, Matapeake
silt loam (B) and Evesboro sand (Q) were collected in
2000 for a previous publication and amended at that time
with 0.5% iron in order to determine the benefit of iron
in phosphate sequestration. The soils were analyzed for
carbon content, water Soluble P (mg/Kg), Bray & Kuntz
soil test (g/Kg), pH and organic C (g/Kg) as described
previously in Codling et al. 2000 [19]. The soil samples
were obtained from agricultural fields that have a thirty
year history of fertilization with poultry litter. Both soils
were known to be high in total P. The results of the soil
analyses from the original paper are summarized in Ta-
ble 1. The soil and iron amendment were stored at room
temperature, in the dark for 10 years before use in this
study.
Electrospray-Ionization Spectroscopy. Phytic acid do-
decasodium salt (IHP) (C6H6Na12O24P6), with a formula
weight of 798 purchased from Sigma Chemical (St. Louis,
MO) (Sigma P8810) and Iron (3) chloride hexahydrate
(FeCl3·6H2O) supplied form Sigma Aldrich Chemical (St.
Louis, MO) were used to prepare fractional species of iron
adducts of IHP at pH 6 in a ratio of 1.5 mM IHP to 3.0
mM ferric chloride (Fisher Scientific). The fractional spe-
cies of phytate (α) derived from pKa of IHP, as well as
the (α) of selected metal adducts of IHP were previously
reported in Heighton et al., 2008 [11]. Iron complexes of
IHP were investigated using a Waters Quattro LC with
Mass Lynx software. Instrumental parameters such as
cone and capillary voltage were adjusted to achieve ro-
bust spectra. In this case the capillary voltage was 3.05
kV and cone voltage was 63 V and the spectra were col-
lected in electrospray negative acquisition mode using
scan ranges from 180 to 206 m/z. Samples and standards
Table 1. Soil analysis of two agricultural soils from Mary-
land.
Soil Analysis Matapeake Evesboro
Soil Texture Silt Loam Sand
Water Soluble P (mg/Kg) 41 84
Bray & Kuntz Soil Test (g/Kg) 1.26 0.96
pH 4.6 5.6
Organic C (g/Kg) 18 29
were introduced by direct injection of 10 µl loop addi-
tions to the mobile phase (1% formic acid: methanol)
(70:30) flowing into the electrospray interface at the rate
of 0.3 ml/minute from a high pressure liquid chromatog-
raphy pump (HPLC). The peak at 198 m/z was used to
generate a standard curve with a correlation coefficient
of 0.99 and a linear range of 0.005 - 0.05 ppb. Five rep-
licates of each concentration were used to generate stan-
dard curves. Soil samples and 0.5% iron amended soil
(1.0 g) described above were extracted with 10 ml of pH
6 reverse osmosis (RO) water for 12 and 24 hours using
an end over end shaker, then centrifuged with a Beckman
J2-M1 at 10,000 rpm for 15 minutes at 25˚C. The sam-
ples were pH adjusted to pH 6.0 before and after extrac-
tion with concentrated hydrochloric acid (HCl) or con-
centrated sodium hydroxide (NaOH). The iron adducts of
IHP were quantified using the 198 m/z standard curve.
In a second experiment ethylene diamine-tetraacetic
acid (EDTA) ACS grade from Fisher Scientific with a
concentration of 0.5 mM was added to the each soil and
0.5% iron amended soil and extracted in the same man-
ner as the soil samples in the first experiment. These sam-
ples were also analyzed for the presence of the 198 m/z
cluster of peaks.
Statistical Analysis. The program Sigma Plot 11.2 [20]
was used to test for statistical differences in ESI-MS de-
rived concentration of IHP. An ANOVA was used ini-
tially to test for Normality and Equal Variance in the
control and 0.5% iron amended soils. The data did not
meet the requirements for equal variance (p < 0.050) [20].
A Friedman Repeated Measures of Variance on Ranks
with post hoc Tukey group pairings was used to test for
statistically significant differences in IHP concentration
among soils (Evesboro sand and Matapeake silt loam) and
treatments (soil controls, 0.5% Fe amendment and EDTA
extraction). Analyses were considered to be statistically
significant at p < 0.05.
Raman Spectroscopy. A Horiba Jorbin Yvon LabRAM
Raman Spectrophotometer equipped with a helium-neon
laser (632.8 nm excitation line) and a 532 nm diode laser
were used to measure the pH dependent Raman spectra
of inorganic and organic phosphate standards and soil
samples. Spectra were obtained using a 1 cm quartz cu-
vette or the confocal microscope in conjunction with
borosilicate slides with aluminum backing, and a charged
coupled detector cooled to –28˚C. The instrument was
calibrated using the 519 cm–1 line of silicon. Backscattered
radiation was collected with the optical slit set to 100 μm
and the pin hole set to 500 μm. The holographic grating
was set to 1800 grooves/mm.
IHP was prepared at 100 mM and filtered with a 0.47
μm glass micro-fiber filter (934-AH) from Whatman.
Aliquots of filtered phytic acid were pH adjusted with a
minimal amount of concentrated hydrochloric acid or
Copyright © 2012 SciRes. OJSS
Quantification of Inositol Hexa-Kis Phosphate in Environmental Samples
Copyright © 2012 SciRes. OJSS
57
sodium hydroxide to pH’s spanning pH 3.0 to pH 10.5 in
0.5 pH unit increments. Raman spectra were collected at
each pH interval. Monosodium phosphate (monobasic)
(NaH2PO4·H2O) with a formula weight of 137.99 was ob-
tained from J.T. Baker & Co. (Phillipsburg NJ) and so-
dium phosphate dibasic (Na2HPO4·2H20) Reagent plus >
99% purity from Fisher Scientific were used to prepare
10.0 ml of inorganic phosphate buffer with a concentra-
tion of 600 mM at pH intervals of 0.5 pH units from pH
3.0 to pH 10.5. Raman spectra were collected at each pH
interval. Concentration dependent spectra of phytic acid
were collected at pH 4.5 and pH 7.0.
Raman spectroscopy was also used to identify inor-
ganic and organic phosphate in the previous described soil
samples (Matapeake and Evesboro) (Table 1) A series of
spectra of each soil and each 0.5% iron amended soil
were taken as a function of pH. The soils were spiked with
either 100 mM of phytic acid or 600 mM of inorganic
phosphate. The PA spiked soils were compared to ferric
phytate slurry with a ratio of 300 mM Fe3+ to 100 mM
IHP using an aluminum backed slide.
Theoretical Raman Spectra. Computational calcula-
tions were conducted in support of the experimental Ra-
man spectra. The following calculations were used to ex-
plore the possible pH dependent spectral changes. As the
IHP (C12H6P6O24, the 12 exchangeable protons are not
included in the IHP designation) system was relatively
large, we started with a Hartree Fock [21] calculation with
a smaller basis set, 6-31G. B3LYP [22] calculations were
preformed on the same systems to confirm the stability
of the HF spectral results. Calculations were conducted
with Gaussian 03 [23]. The main three compounds which
we examined were H12IHP (fully protonated), H6IHP6–
(half deprotonated), and IHP12– (fully deprotonated).
These three were chosen to cover the four main states of
the phosphoric acid groups, fully protonated [H3PO4]0,
[H2PO4], [HPO4]2–, and fully ionized [PO4]3–. As these
particular species show the most differentiation in their
experimental spectra as well as population in vivo sys-
tems, they should allow us to cast the most light on the
experimental results. Initial calculations were gas phase
only, followed by explicit hydration with 6 water mole-
cules in each system. This was done successfully for
H6IHP6–·6H2O.
3. Results and Discussion
Experimental Raman Spectroscopy. The pH dependent
Raman spectrum of PI as orthophosphate (H3PO4) exhib-
its three titratable peaks between 800 and 1100 cm–1 (Fig-
ure 1).
These peaks changing as a function of pH can only be
attributed to the molecular response to the protonation/
deprotonation of orthophosphate as 24
is titrated to HPO
2
4
HPO
at pKa2 7.2. Two sharp peaks are apparent be-
tween pH 3.0 and pH 5.0 at Raman shifts of 867 and
1062 cm–1. These two peaks disappear at pH 7.0 as a
peak at Raman shift 976 cm–1 emerges at pH 5.0, growing
to full intensity at pH 7. Another transition appears at pH
10 as the spectral peak at Raman shift 976 cm–1 decreases
in intensity and a second Raman peak appears at spectral
shift 921 cm–1. This transition is likely associated with
the loss of the 4
HPO
proton at pKa3 12.35 as 4
HPO
is titrated to 3
4
PO
.
Figure 1. pH depende nt Raman spectra of inorganic phosphate (PI) as orthophosphate (600 mM) buffered, at pH from 3.5 to
pH 10.
Quantification of Inositol Hexa-Kis Phosphate in Environmental Samples
58
The pH dependent Raman spectra of PO as IHP exhib-
its a similar pattern of peaks and response to titration as
the PI spectra between 800 and 1100 cm–1, but differs
from the PI in several distinct ways (Figure 2). The first
difference is that the PI peak 863 cm–1 in the PO spectra is
shifted by 30 cm–1 to 832 cm–1. The second difference is
associated with the emergence of the peak at Raman shift
976 cm–1 which begins to appear in the IHP spectra at pH
6.5, much later than in the PI spectra in which it appears
at pH 5.0. Finally, the peak at 1062 cm–1 which disap-
pears in the PI Raman spectra at pH 7.0 never disappears
in the PO spectra indicating that is not associated with
titratable protons but instead part of the carbon structure
of IHP. This peak in the IHP spectra is broader and flat-
ter than the equivalent peak in the orthophosphate (PI)
sample indicating two unresolved peaks in the IHP sam-
ple and only one peak in the PI. This position is supported
by the theoretical data and discussed later. Notably, the
IHP spectra does not change substantially between pH
3.0 and pH 6.0 which is an indication of no or very small
conformational changes in the molecule. The additional
peaks in the Raman spectra of IHP are likely modes within
the molecule that are unaffected by the titration of the
phosphate groups on the molecule. The structure of IHP
in the form of C6H18P6O24 (H12IHP) was determined by is
provided in Figure 3.
Raman spectroscopy can be used to differentiate PI
from PO (as IHP) in standard solutions due to the differ-
ences in the pH dependent spectra of IHP and PI (Figure
1 and Figure 2). The detection limits for normal Raman
spectroscopy of PI and IHP have high concentrations,
rendering the technique of little use in environmental sam-
ples without a pre-concentration step (Figure 4).
Soil samples Matapeake silt loam and Evesboro sand
were examined using Raman spectroscopy at pH 4.5 by
Raman Spectroscopy and PO was found to be indistin-
guishable from PI using the current experimental condi-
tions (Figure 5). Addition of Ferric cation was found to
reduce the intensity of PO as IHP and PI in both soils.
Clearly, PO and PI sites simultaneously compete for the
same metal ions. At the molecular level, the specific sites
1PO, 2PO, 3PO, 4PO, 5PO and 6PO are not structurally
equivalent so each of the twelve protons attached to the
six P sites will not be identical in their ability to form
H3O+ ions.
Raman Spectra Derived from Theoretical Calcula-
tions. Normal vibrational spectroscopy provides lower de-
tection limits than gravimetric analysis does and greater
specificity toward forms of P than colorimetric analyses
does, but it does not provide enough sensitivity for de-
velopment of in-situ probes, which is the ultimate goal of
this work. A pre-concentration step is required to generate
relevant environmental data from normal Raman spec-
troscopy. An alternative to pre-concentration is surface
enhanced Raman spectroscopy. This method has the po-
tential to provide the sensitivity needed for in-situ probes,
while maintaining the ability to provide speciation of P in
unaltered or minimally altered environmental samples.
Figure 2. pH dependent Raman spec tra of organic phosphate (PO) as inositol hex-kis phosphate (IHP) (100 mM) at pH 3.0 to
pH 10.
Copyright © 2012 SciRes. OJSS
Quantification of Inositol Hexa-Kis Phosphate in Environmental Samples 59
Figure 3. Structure of Inositol hex-kis phosphate (IHP) as
C6H18P6O24 (H18IHP).
Intensity (cnt)
400 600800 1 0001 2001 4001 6001 8002 000
Raman Shift (cm
-1
)
100mM
50mM
10mM
5mM
1mM
831cm
1
971cm
1
1069cm
1
1628cm
1
1366cm
1
Figure 4. Raman intensity of organic phosphate (PO) as IHP
as a function of concentration (mM) at pH 7.
Figure 5. Raman spec tra of two high phosphorous soils (pH 4.5). Soil control and 0.5% iron amended soils were spiked with
IHP or orthophosphate.
The primary vibrational mode at 832 cm–1 is the hy-
drogen-bonding phosphate H atoms moving perpendicu-
lar to the axis of hydrogen bonding between adjacent
phosphate groups. The primary mode at 967 cm–1 appears
to be a symmetric stretch that appears when the phos-
phate is deprotonated, while the mode at 1100 cm–1 cor-
responds to an asymmetric stretch of the same groups.
The peaks near 1500 appear to be H atom bending. The
peaks around 1162 cm–1 correspond to various vibratio-
nal modes of the C6 ring in the center of the compound.
We can now compare our Raman data to experimental
spectra taken under various pH conditions, as shown in
Figures 2-5. Looking between the peaks seen experi-
mentally at low (acidic) pH 3, where the fully protonated
H12IHP would be predominant, and the peaks seen in
more neutral solutions near pH 7, we can first observe in
the experimental data that there is a trend where the peak
at 850 cm-1 shrinks, and a peak appears near 1000 cm–1.
Copyright © 2012 SciRes. OJSS
Quantification of Inositol Hexa-Kis Phosphate in Environmental Samples
60
This trend is duplicated in our theoretical data for the
explicitly solvated H6IHP–6·6H2O anion as calculated
with the HF/6-31G.
The peak slightly below 1000 cm–1 in the experimental
spectra is probably the phosphate symmetric stretching
mode shown by the singly deprotonated HPO3-R groups
in our calculation and shown in Figures 2 and 4. The peak
further down is the vibrational modes of the intramolecu-
larly hydrogen bonding protons on the phosphate groups
vibrating perpendicular to the bonds. This would explain
the near disappearance of the peak in the most basic con-
ditions, where the acidic groups would be fully deproto-
nated and this kind of mode would no longer be possible.
Finally, the peak just above 1000 cm–1 is related to the
vibrational modes of the central C6H6 ring, it remains for
the most part unchanged regardless of the external pH.
The modes between 1450 and 1600 cm–1 on our spectrum
appear to correspond to different bending modes of non-
bonding H atoms, mostly on the central C6 ring, although
they also include some motion of phosphate H atoms in
unfavorable directions. This might explain why the peaks
seen on the experimental spectrum in this area become
subdued under the most basic pH conditions.
The clear trends of where the Raman absorptions are
with relation to each other correspond closely to the ex-
perimental results, confirming the identities of the spe-
cies suspected by the experimenter. Theoretical vibratio-
nal modes provided additional insight into the sources of
each observed peak in the experimental measurement.
Currently, further efforts continue to model the solvated,
fully deprotonated IHP–12 system, and this additional in-
formation will be presented in a future paper. Future cal-
culations on explicitly solvated molecules of the fully
deprotonated IHP–12 should shed further light on the area
of the experimental spectrum in the 1200 - 1700 cm–1
area as well, as changes were observed there compared to
the H12IHP and H6IHP–6 systems examined here.
Electrospray Ionization Spectroscopy. The speciation
(α) of the IHP at pH 6 can be predicted from previously
published pKa data [10,11,18] to be a distribution of 3
sequentially charged species: (H4IHP–8),
8
65624
CHPO
7
65
624
CHPO
(H5IHP–7) and (H6IHP–6). The
majority (60%) of IHP at pH 6 is present as H5IHP–7. A
mass spectral peak is expected to be present at m/z of 93.
This peak represents H5IHP–7 with a mass of 653 amu
and a z = 7. The m/z is present in standards, but is pre-
dictably not observed in natural samples due to the abil-
ity of IHP to form strong complexes with metals.
6
65624
CHPO
Iron (Fe3+) complexes of IHP are readily formed and
produce ESI-MS spectra that are predictable and quanti-
fiable at ppb levels in standard solutions (Figure 6). The
spectral peaks at m/z 196, 198 and 200 as well as the total
ion count (TIC) over a range of 180 - 700 m/z were scru-
tinized for possible use in quantifying iron com- plexes
in soil samples. The peak at 198 m/z (Table 2), (Figure 6)
was used to identify iron complexes of IHP in two soil
samples Matapeake silt loam and Evesboro sand (Figure
7).
Concentration (ppm)
Figure 6. IHP-iron complex ESI-MS spectra. Standard curve at 198 m/z (inset).
Copyright © 2012 SciRes. OJSS
Quantification of Inositol Hexa-Kis Phosphate in Environmental Samples 61
Table 2. Phytic acid and ferric chloride at pH 6 ESI-MS peak
assignments.
pH 6 Peak Assignment z m/z m Charge
Fe56H2O2 –1 90 90 –1
C6H11O24P6 –7 93 653 –12 + 5
56
612 5 366
CHFeOP –7 160 1126 –12 + 15 – 10
56
612 5 376
CHFeOP –7 163 1142 –12 + 15 – 10
56
612 5 386
CHFeOP –7 165 1158 –12 + 15 – 10
56
612 5 366
CHFeOP *Cl –7 196 1126/7 + 35 –12 + 15 – 10
56
612 5 376
CHFeOP *Cl –7 198 1142/7 + 35 –12 + 15 – 10
56
612 5 386
CHFeOP *Cl
–7 200 1158/7 + 35 –12 + 15 – 10
Figure 7. ESI-mass spectra of Matapeake silt loam (upper
spectra) and Evesboro sand (lower spectra).
The concentration of IHP iron complexes quantified
from the 198 m/z show statistically measureable differ-
ences between Evesboro sand (Figure 8 Tukey group a)
and Matapeake silt loam (Figure 8 Tukey group b). No
difference was found between the soil control and the
0.5% iron amendments for either soil (Figure 8 Tukey
groups a and b).
EDTA extractions of both soil controls and respective
0.5% iron amendments were found to be statistically dif-
ferent (Figure 8 Tukey group c). Addition of EDTA to
the soil samples was found to eliminate m/z peaks at 196,
198 and 200.
Interestingly, in the case of iron at pH 2.8 and 6 spe-
cific, consistent and repeatable clusters are formed re-
gardless of the initial pH. Clusters centered at 163 and
Figure 8. A Friedman Repeated Measures Analysis of Vari-
ance on Ranks with post hoc Tukey groupings (a, b and c)
of Evesboro sand and Matapeake silt loam extracted with
water at pH 6 or EDTA at pH 13 and monitored with the
198 m/z ESI-MS spectral peak found statistical differences
between the median concentrations of Evesboro sand and
Matapeake silt loam (Tukey groups a and b), but did not
find statistical differences between the median concentra-
tions of each soil and their respective 0.5% iron amendment.
The median concentration values of the EDTA extractions
were found to be statistically different in both controls and
amendments of each soil (Tukey group c).
198 m/z are the dominate species in each spectra. The
distribution of IHP charge speciation is expected to pro-
duce m/z peaks that are dependent on the pH. At an ini-
tial pH of 2.8 the spectra does not exhibit the peak at m/z
of 93 as the pH 6 Fe-IHP spectra does. Instead the 2.8 pH
spectra exhibits different m/z as detailed previously in
Heighton et al., 2008 [18] with the exception of the 163
and 198 m/z clusters. IHP-Fe spectra at high pH exhibit
very different spectra than the pH 2.8 and pH 6.0 spectra.
IHP-Fe complexes can be expected to be very stable. Khan,
1999 [16] in UV-Vis spectrophotometric studies of IHP-
Fe found that dominate species at pH 3.0 and pH 5.0 was
Fe2IHP. This is consistent with the results that we detail
in Table 2 and in the experimental Raman spectra in
Figure 2. Using the iron in excess of IHP between pH
2.8 and pH 6 is likely governed by a kinetically stable
species with proton exchanging sites that are sterically
hindered or have variable exchange rates. This in either
case would lead to a delay in reaching chemical equilib-
rium. The use of formic acid in the mobile phase pro-
motes formation of chloride adducts in negative ion ESI
Copyright © 2012 SciRes. OJSS
Quantification of Inositol Hexa-Kis Phosphate in Environmental Samples
62
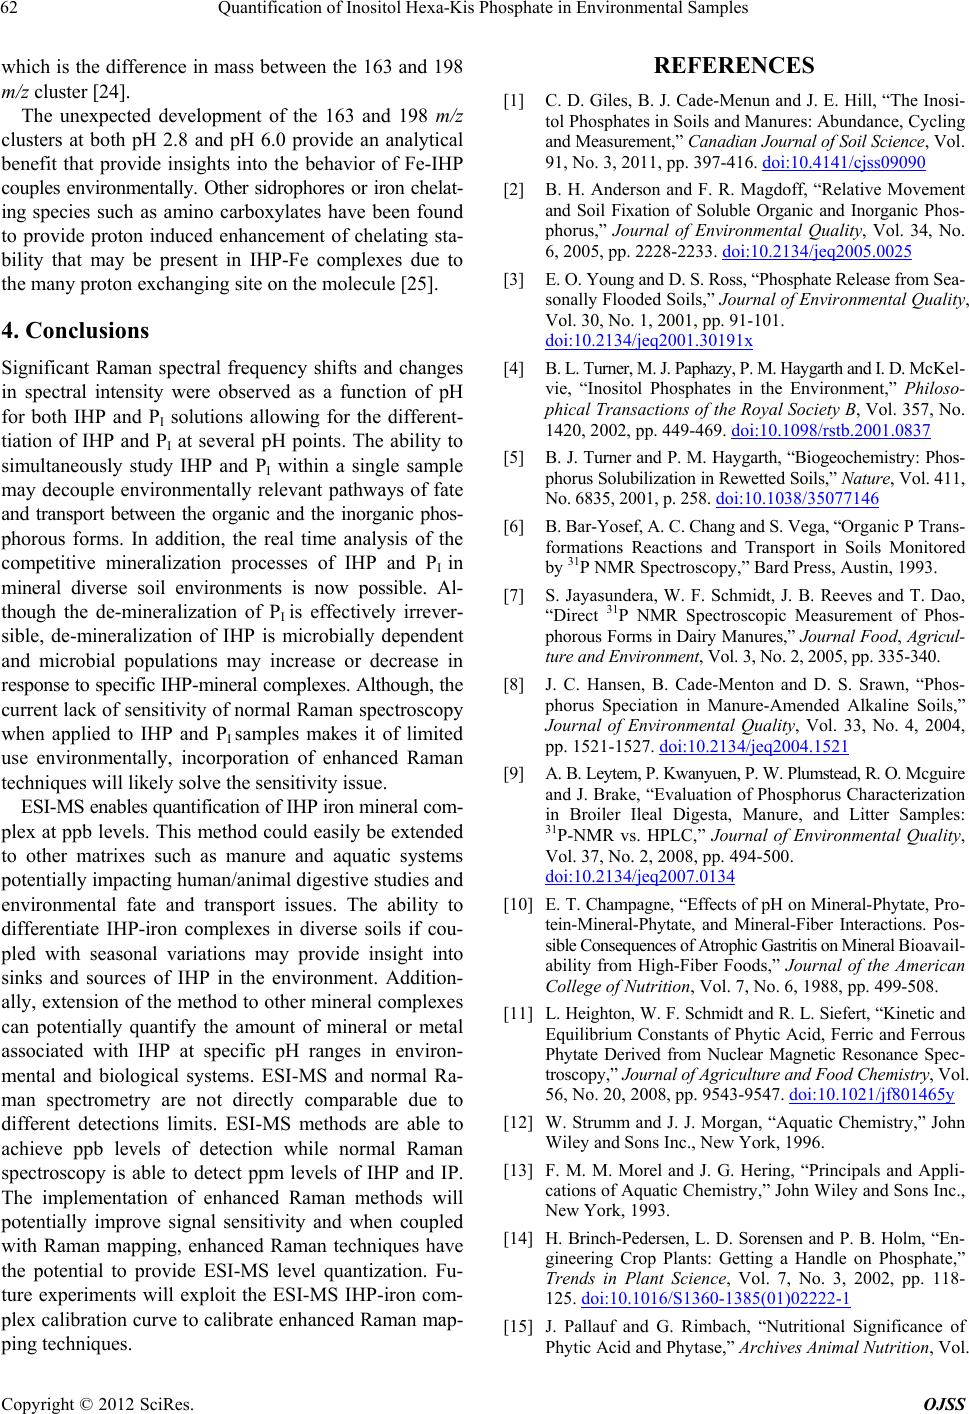
which is the difference in mass between the 163 and 198
m/z cluster [24].
The unexpected development of the 163 and 198 m/z
clusters at both pH 2.8 and pH 6.0 provide an analytical
benefit that provide insights into the behavior of Fe-IHP
couples environmentally. Other sidrophores or iron chelat-
ing species such as amino carboxylates have been found
to provide proton induced enhancement of chelating sta-
bility that may be present in IHP-Fe complexes due to
the many proton exchanging site on the molecule [25].
4. Conclusions
Significant Raman spectral frequency shifts and changes
in spectral intensity were observed as a function of pH
for both IHP and PI solutions allowing for the different-
tiation of IHP and PI at several pH points. The ability to
simultaneously study IHP and PI within a single sample
may decouple environmentally relevant pathways of fate
and transport between the organic and the inorganic phos-
phorous forms. In addition, the real time analysis of the
competitive mineralization processes of IHP and PI in
mineral diverse soil environments is now possible. Al-
though the de-mineralization of PI is effectively irrever-
sible, de-mineralization of IHP is microbially dependent
and microbial populations may increase or decrease in
response to specific IHP-mineral complexes. Although, the
current lack of sensitivity of normal Raman spectroscopy
when applied to IHP and PI samples makes it of limited
use environmentally, incorporation of enhanced Raman
techniques will likely solve the sensitivity issue.
ESI-MS enables quantification of IHP iron mineral com-
plex at ppb levels. This method could easily be extended
to other matrixes such as manure and aquatic systems
potentially impacting human/animal digestive studies and
environmental fate and transport issues. The ability to
differentiate IHP-iron complexes in diverse soils if cou-
pled with seasonal variations may provide insight into
sinks and sources of IHP in the environment. Addition-
ally, extension of the method to other mineral complexes
can potentially quantify the amount of mineral or metal
associated with IHP at specific pH ranges in environ-
mental and biological systems. ESI-MS and normal Ra-
man spectrometry are not directly comparable due to
different detections limits. ESI-MS methods are able to
achieve ppb levels of detection while normal Raman
spectroscopy is able to detect ppm levels of IHP and IP.
The implementation of enhanced Raman methods will
potentially improve signal sensitivity and when coupled
with Raman mapping, enhanced Raman techniques have
the potential to provide ESI-MS level quantization. Fu-
ture experiments will exploit the ESI-MS IHP-iron com-
plex calibration curve to calibrate enhanced Raman map-
ping techniques.
REFERENCES
[1] C. D. Giles, B. J. Cade-Menun and J. E. Hill, “The Inosi-
tol Phosphates in Soils and Manures: Abundance, Cycling
and Measurement,” Canadian Journal of Soil Science, Vol.
91, No. 3, 2011, pp. 397-416. doi:10.4141/cjss09090
[2] B. H. Anderson and F. R. Magdoff, “Relative Movement
and Soil Fixation of Soluble Organic and Inorganic Phos-
phorus,” Journal of Environmental Quality, Vol. 34, No.
6, 2005, pp. 2228-2233. doi:10.2134/jeq2005.0025
[3] E. O. Young and D. S. Ross, “Phosphate Release from Sea-
sonally Flooded Soils,” Journal of Environmental Quality,
Vol. 30, No. 1, 2001, pp. 91-101.
doi:10.2134/jeq2001.30191x
[4] B. L. Turner, M. J. Paphazy, P. M. Haygarth and I. D. McKel-
vie, “Inositol Phosphates in the Environment,” Philoso-
phical Transactions of the Royal Society B, Vol. 357, No.
1420, 2002, pp. 449-469. doi:10.1098/rstb.2001.0837
[5] B. J. Turner and P. M. Haygarth, “Biogeochemistry: Phos-
phorus Solubilization in Rewetted Soils,” Nature, Vol. 411,
No. 6835, 2001, p. 258. doi:10.1038/35077146
[6] B. Bar-Yosef, A. C. Chang and S. Vega, “Organic P Trans-
formations Reactions and Transport in Soils Monitored
by 31P NMR Spectroscopy,” Bard Press, Austin, 1993.
[7] S. Jayasundera, W. F. Schmidt, J. B. Reeves and T. Dao,
“Direct 31P NMR Spectroscopic Measurement of Phos-
phorous Forms in Dairy Manures,” Journal Food, Agricul-
ture and Environment, Vol. 3, No. 2, 2005, pp. 335-340.
[8] J. C. Hansen, B. Cade-Menton and D. S. Srawn, “Phos-
phorus Speciation in Manure-Amended Alkaline Soils,”
Journal of Environmental Quality, Vol. 33, No. 4, 2004,
pp. 1521-1527. doi:10.2134/jeq2004.1521
[9] A. B. Leytem, P. Kwanyuen, P. W. Plumstead, R. O. Mcguire
and J. Brake, “Evaluation of Phosphorus Characterization
in Broiler Ileal Digesta, Manure, and Litter Samples:
31P-NMR vs. HPLC,” Journal of Environmental Quality,
Vol. 37, No. 2, 2008, pp. 494-500.
doi:10.2134/jeq2007.0134
[10] E. T. Champagne, “Effects of pH on Mineral-Phytate, Pro-
tein-Mineral-Phytate, and Mineral-Fiber Interactions. Pos-
sible Consequences of Atrophic Gastritis on Mineral Bioavail-
ability from High-Fiber Foods,” Journal of the American
College of Nutrition, Vol. 7, No. 6, 1988, pp. 499-508.
[11] L. Heighton, W. F. Schmidt and R. L. Siefert, “Kinetic and
Equilibrium Constants of Phytic Acid, Ferric and Ferrous
Phytate Derived from Nuclear Magnetic Resonance Spec-
troscopy,” Journal of Agriculture and Food Chemistry, Vol.
56, No. 20, 2008, pp. 9543-9547. doi:10.1021/jf801465y
[12] W. Strumm and J. J. Morgan, “Aquatic Chemistry,” John
Wiley and Sons Inc., New York, 1996.
[13] F. M. M. Morel and J. G. Hering, “Principals and Appli-
cations of Aquatic Chemistry,” John Wiley and Sons Inc.,
New York, 1993.
[14] H. Brinch-Pedersen, L. D. Sorensen and P. B. Holm, “En-
gineering Crop Plants: Getting a Handle on Phosphate,”
Trends in Plant Science, Vol. 7, No. 3, 2002, pp. 118-
125. doi:10.1016/S1360-1385(01)02222-1
[15] J. Pallauf and G. Rimbach, “Nutritional Significance of
Phytic Acid and Phytase,” Archives Animal Nutrition, Vol.
Copyright © 2012 SciRes. OJSS
Quantification of Inositol Hexa-Kis Phosphate in Environmental Samples
Copyright © 2012 SciRes. OJSS
63
50, No. 4, 1997, pp. 301-319.
doi:10.1080/17450399709386141
[16] S. Y. Khan, “Effects of Dietary Fiber on the Bioavailabil-
ity of Trace Elements in the Body,” Ph.D. Thesis, Uni-
versity of Karachi, Karachi, 1999.
[17] J. B. Foresman and A. Frisch, “Exploring Chemistry with
Electronic Structure Methods,” 2nd Edition, Gaussian Inc.,
Pittsburg, 1996.
[18] L. Heighton, W. F. Schmidt, C. P. Rice and R. L. Siefert,
“Electrospray Ionization Mass Spectroscopy Shows Speci-
ation of Phytate to Be pH Dependent,” Journal of Food,
Agriculture and Environment, Vol. 6, No. 2, 2008, pp. 402-
407.
[19] E. E. Codling, R. L. Chaney and C. L. Mulchi, “Use of
Aluminum- and Iron-Rich Residues to Immobilize Phos-
phorus in Poultry Litter-Amended Soils,” Journal of En-
vironmental Quality, Vol. 29, No. 6, 2000, pp. 1924-1931.
[20] Anonymous, “Sigma Plot User’s Guide: Part 2—Statistics,”
Systat Software Inc., 2009.
[21] V. Barone and M. Cossi, “Quantum Calculation of Mo-
lecular Energies and Energy Gradients in Solution by a
Conductor Solvent Model,” The Journal of Physical Chem-
istry A, Vol. 102, No. 11, 1998, pp. 1995-2001.
doi:10.1021/jp9716997
[22] V. Barone, M. Cossi and J. Tomasi, “Geometry Optimi-
zation of Molecular Structures in Solution by the Po-
larizable Continuum Model,” Journal of Computational
Chemistry, Vol. 19, No. 4, 1998, pp. 404-417.
doi:10.1002/(SICI)1096-987X(199803)19:4<404::AID-J
CC3>3.0.CO;2-W
[23] M. Cossi, N. Rega, G. Scalamani and V. Barone, “Ener-
gies, Structures, and Electronic Properties of Molecules in
Solution with the C-PCM Solvation Model,” Journal of
Computational Chemistry, Vol. 24, No. 6, 2003, pp. 669-
681. doi:10.1002/jcc.10189
[24] J. Zhu and R. B. Cole, “Formation and Decompositions of
Chloride Adduct Ions, [M + Cl], in Negative Ion Elec-
trospray Ionization Mass Spectrometry,” Journal Ameri-
can Society for Mass Spectrometry, Vol. 11, No. 11, 2000,
pp. 932-941. doi:10.1016/S1044-0305(00)00164-1
[25] N. von Wiren, H. Khodr and R. C. Hider, “Hydroxylated
Phytosiderophore Species Possess an Enhanced Chelate
Stability and Affinity for Iron (III),” Plant Physiology,
Vol. 124, No. 3, 2000, pp. 1149-1157.
doi:10.1104/pp.124.3.1149