Paper Menu >>
Journal Menu >>
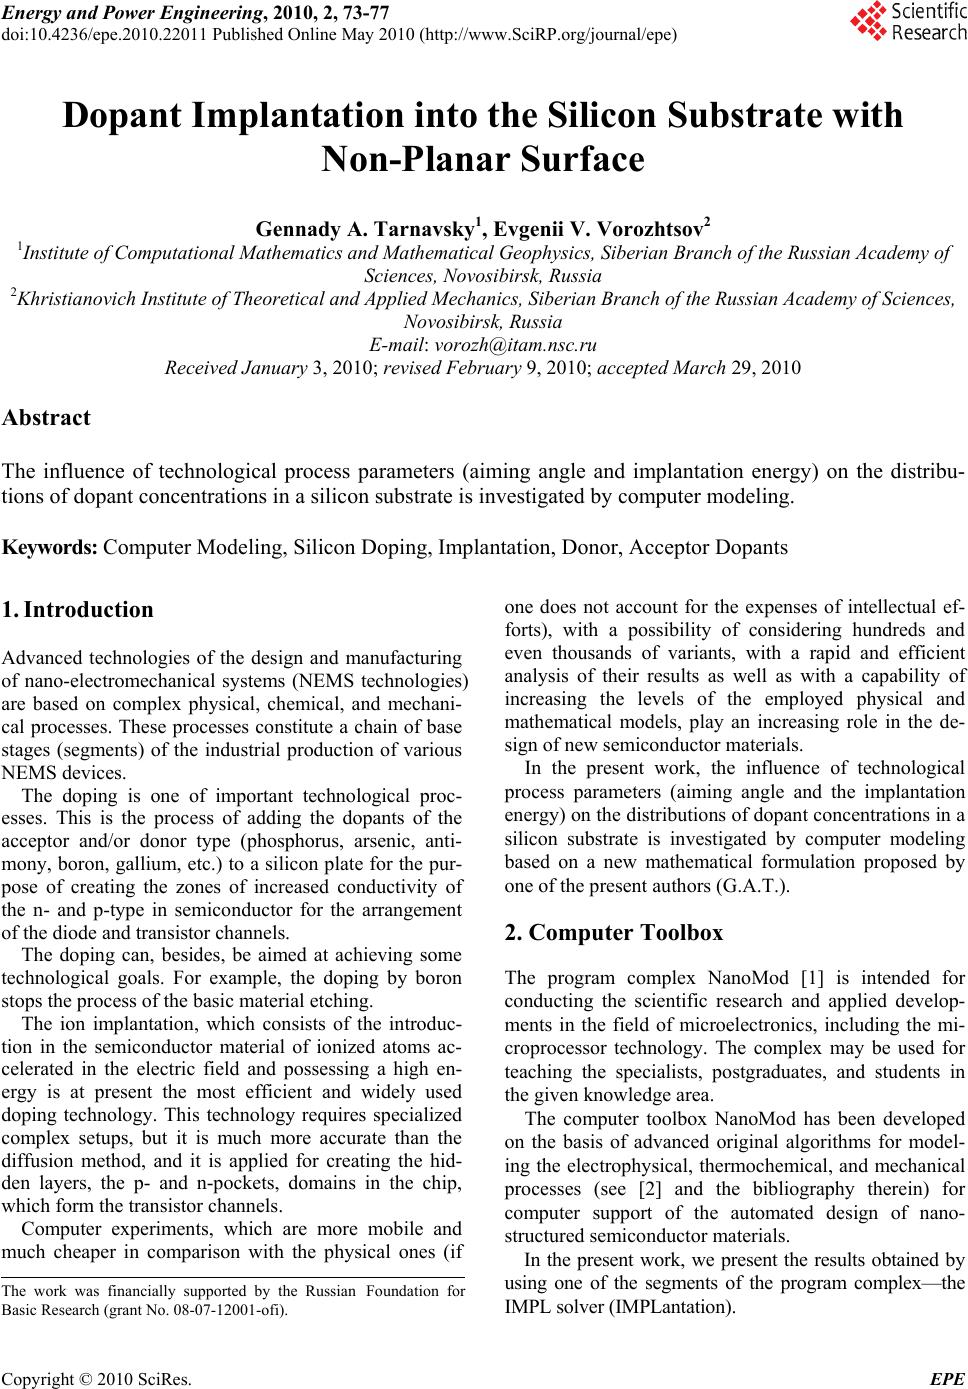 Energy and Power Engineering, 2010, 2, 73-77 doi:10.4236/epe.2010.22011 Published Online May 2010 (http://www.SciRP.org/journal/epe) Copyright © 2010 SciRes. EPE 73 Dopant Implantation into the Silicon Substrate with Non-Planar Surface Gennady A. Tarnavsky1, Evgenii V. Vorozhtsov2 1Institute of Computational Mathematics and Mathematical Geophysics, Siberian Branch of the Russian Academy of Sciences, Novosibirsk, Russia 2Khristianovich Institute of Theoretical and Applied Mechanics, Siberian Branch of the Russian Academy of Sciences, Novosibirsk, Russia E-mail: vorozh@itam.nsc.ru Received January 3, 2010; revised February 9, 2010; accepted March 29, 2010 Abstract The influence of technological process parameters (aiming angle and implantation energy) on the distribu- tions of dopant concentrations in a silicon substrate is investigated by computer modeling. Keywords: Computer Modeling, Silicon Doping, Implantation, Donor, Acceptor Dopants 1. Introduction Advanced technologies of the design and manufacturing of nano-electromechanical systems (NEMS technologies) are based on complex physical, chemical, and mechani- cal processes. These processes constitute a chain of base stages (segments) of the industrial production of various NEMS devices. The doping is one of important technological proc- esses. This is the process of adding the dopants of the acceptor and/or donor type (phosphorus, arsenic, anti- mony, boron, gallium, etc.) to a silicon plate for the pur- pose of creating the zones of increased conductivity of the n- and p-type in semiconductor for the arrangement of the diode and transistor channels. The doping can, besides, be aimed at achieving some technological goals. For example, the doping by boron stops the process of the basic material etching. The ion implantation, which consists of the introduc- tion in the semiconductor material of ionized atoms ac- celerated in the electric field and possessing a high en- ergy is at present the most efficient and widely used doping technology. This technology requires specialized complex setups, but it is much more accurate than the diffusion method, and it is applied for creating the hid- den layers, the p- and n-pockets, domains in the chip, which form the transistor channels. Computer experiments, which are more mobile and much cheaper in comparison with the physical ones (if one does not account for the expenses of intellectual ef- forts), with a possibility of considering hundreds and even thousands of variants, with a rapid and efficient analysis of their results as well as with a capability of increasing the levels of the employed physical and mathematical models, play an increasing role in the de- sign of new semiconductor materials. In the present work, the influence of technological process parameters (aiming angle and the implantation energy) on the distributions of dopant concentrations in a silicon substrate is investigated by computer modeling based on a new mathematical formulation proposed by one of the present authors (G.A.T.). 2. Computer Toolbox The program complex NanoMod [1] is intended for conducting the scientific research and applied develop- ments in the field of microelectronics, including the mi- croprocessor technology. The complex may be used for teaching the specialists, postgraduates, and students in the given knowledge area. The computer toolbox NanoMod has been developed on the basis of advanced original algorithms for model- ing the electrophysical, thermochemical, and mechanical processes (see [2] and the bibliography therein) for computer support of the automated design of nano- structured semiconductor materials. In the present work, we present the results obtained by using one of the segments of the program complex—the IMPL solver (IMPLantation). The work was financially supported by the Russian Foundation for Basic Research (grant No. 08-07-12001-ofi). 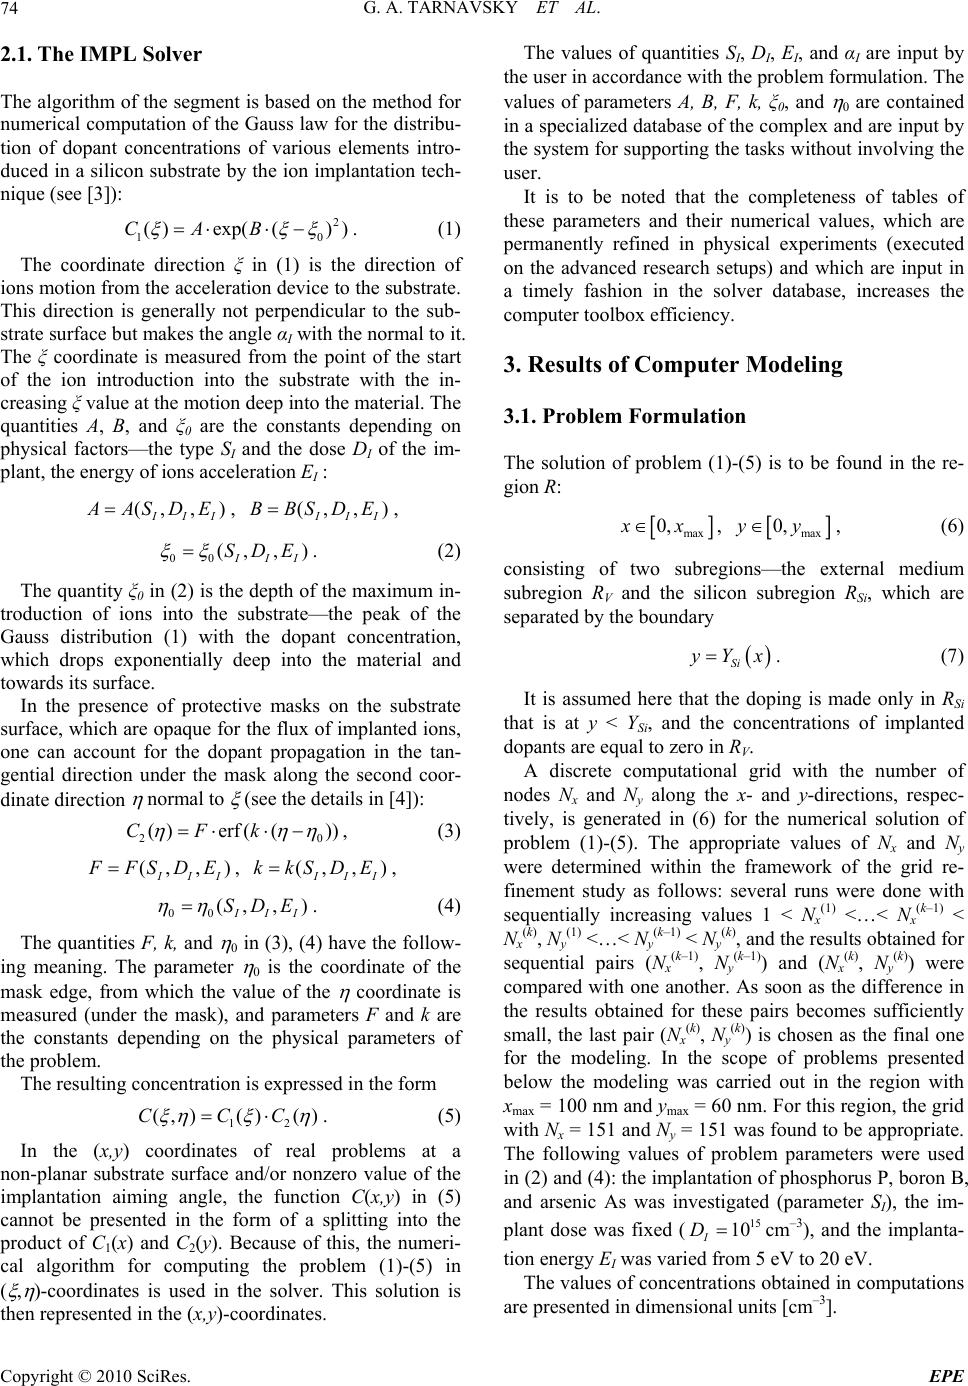 G. A. TARNAVSKY ET AL. 74 2.1. The IMPL Solver The algorithm of the segment is based on the method for numerical computation of the Gauss law for the distribu- tion of dopant concentrations of various elements intro- duced in a silicon substrate by the ion implantation tech- nique (see [3]): 2 10 ()exp(() )CAB . (1) The coordinate direction ξ in (1) is the direction of ions motion from the acceleration device to the substrate. This direction is generally not perpendicular to the sub- strate surface but makes the angle αI with the normal to it. The ξ coordinate is measured from the point of the start of the ion introduction into the substrate with the in- creasing ξ value at the motion deep into the material. The quantities A, B, and ξ0 are the constants depending on physical factors—the type SI and the dose DI of the im- plant, the energy of ions acceleration EI : (,, ) I II A ASD E, (,, ) I II BBSDE, 00 (,, ) I II SDE . (2) The quantity ξ0 in (2) is the depth of the maximum in- troduction of ions into the substrate—the peak of the Gauss distribution (1) with the dopant concentration, which drops exponentially deep into the material and towards its surface. In the presence of protective masks on the substrate surface, which are opaque for the flux of implanted ions, one can account for the dopant propagation in the tan- gential direction under the mask along the second coor- dinate direction normal to (see the details in [4]): 20 ()erf( ())CFk , (3) (,, ) I II F FSD E, (,, ) I II kkSDE, 00 (,, ) I II SDE . (4) The quantities F, k, and 0 in (3), (4) have the follow- ing meaning. The parameter 0 is the coordinate of the mask edge, from which the value of the coordinate is measured (under the mask), and parameters F and k are the constants depending on the physical parameters of the problem. The resulting concentration is expressed in the form 12 (,)() ()CCC . (5) In the (x,y) coordinates of real problems at a non-planar substrate surface and/or nonzero value of the implantation aiming angle, the function C(x,y) in (5) cannot be presented in the form of a splitting into the product of C1(x) and C2(y). Because of this, the numeri- cal algorithm for computing the problem (1)-(5) in ( , )-coordinates is used in the solver. This solution is then represented in the (x,y)-coordinates. The values of quantities SI, DI, EI, and αI are input by the user in accordance with the problem formulation. The values of parameters A, B, F, k, ξ0, and 0 are contained in a specialized database of the complex and are input by the system for supporting the tasks without involving the user. It is to be noted that the completeness of tables of these parameters and their numerical values, which are permanently refined in physical experiments (executed on the advanced research setups) and which are input in a timely fashion in the solver database, increases the computer toolbox efficiency. 3. Results of Computer Modeling 3.1. Problem Formulation The solution of problem (1)-(5) is to be found in the re- gion R: max 0,xx, max 0,yy, (6) consisting of two subregions—the external medium subregion RV and the silicon subregion RSi, which are separated by the boundary Si y Yx. (7) It is assumed here that the doping is made only in RSi that is at y < YSi, and the concentrations of implanted dopants are equal to zero in RV. A discrete computational grid with the number of nodes Nx and Ny along the x- and y-directions, respec- tively, is generated in (6) for the numerical solution of problem (1)-(5). The appropriate values of Nx and Ny were determined within the framework of the grid re- finement study as follows: several runs were done with sequentially increasing values 1 < Nx (1) <…< Nx (k–1) < Nx (k), Ny (1) <…< Ny (k–1) < Ny (k), and the results obtained for sequential pairs (Nx (k–1), N y (k–1)) and (Nx (k), N y (k)) were compared with one another. As soon as the difference in the results obtained for these pairs becomes sufficiently small, the last pair (Nx (k), Ny (k)) is chosen as the final one for the modeling. In the scope of problems presented below the modeling was carried out in the region with xmax = 100 nm and ymax = 60 nm. For this region, the grid with Nx = 151 and Ny = 151 was found to be appropriate. The following values of problem parameters were used in (2) and (4): the implantation of phosphorus P, boron B, and arsenic As was investigated (parameter SI), the im- plant dose was fixed (cm–3), and the implanta- tion energy EI was varied from 5 eV to 20 eV. 15 10 I D The values of concentrations obtained in computations are presented in dimensional units [cm–3]. Copyright © 2010 SciRes. EPE  G. A. TARNAVSKY ET AL. 75 Figure 1. Implantation of dopant donor and acceptor admixtures into the silicon Si substrate with planar surface. The proc- ess scheme (а), the distributions of the concentrations of the arsenic As (b) and boron B (c). Implantation energy 15 eV. Figure 2. Phosphorus P implantation into the silicon Si substrate with planar surface. Implantation energy 15 eV. Distribu- ions of concentrations of P in Si at the aiming angle of implantation 0° (а), 30° (b), and 60° (c). t 3.2. Implantation into the Silicon with Planar Surface Consider the results of problem solution at a constant value of in (7), the implantation energy 5 eV, and three doping types: As, B, and P. 35 Si Yx Figure 1 illustrates the results of computing the seg- ment. The implantation scheme and the distribution of the arsenic As and boron B concentrations in the silicon Si are shown. Note that for the same implantation energy, the pene- tration depth of B in Si is higher than the penetration depth of As in Si. The maximum of the As distribution takes place at y = 20 (at the depth of 15 nm from the sur- face), and in the case of B, it takes place at y = 0 (the depth of 35 nm). The maximum of the P concentration (Figure 2(а)) lies at the depth of 20 nm (y = 15). Thus, the phosphorus penetrates the silicon deeper than the arsenic for the same implantation energy, but it yields to boron in terms of this figure. The implanted layer width is the largest in the case of As, and it is the least in the case of B. The process of dopant diffusion with time spreads this distribution at a speed depending on several factors (the temperature, the crystal lattice type, etc.). Let us analyse the influence of the implantation aim- ing angle I . Figure 2 shows the results of computing the phosphorus implantation for the values 0 I ,, and 60 (Figures 2(a), (b), and (c), respectively). The angle 30 I is measured from coordinate lines x = const, in the given problem it is measured from the direction normal to the basic substrate surface. One can predict a priori that as a result of modeling the 2D problem, one must obtain the 1D structures of the distribution of concentrations C = f (y), and such a prob- lem statement is, besides the obtaining of scientific data, a test for the correctness of the functioning of the com- putational algorithm and the computer code implement- ing it. Computed results correspond to the predictions: the distributions of phosphorus concentrations depend only on the y-coordinate. The following fact takes place here: with increasing angle I , the penetration depth of P in Si drops, and it is naturally directly proportional to cos I , which is seen in Figure 2. The distribution functions , where , I Cy I is considered as a parameter, correlate with one another under the variation of I with small differences. So the function 60 ,C y has a narrower localiza- tion than 0,C y , and its maximum is by about 15% higher. The form and the digital values of function y30 ,C take the intermediate position between 0,C y and 60 ,Cy . The differences in functions are due to the proximity of the Si boundary to the y-coordinate of the maximum of the Gauss distribution (1), and the “tail” of this distri- bution is “cut off” by the substrate surface. 3.3. Implantation into a Substrate with Non-Planar Surface Consider the results of computer modeling of the phos- C opyright © 2010 SciRes. EPE  G. A. TARNAVSKY ET AL. 76 phorus P implantation into the silicon Si with a non-planar surface under the variation of the aiming an- gle I and the activation energy EI. Figure 3(a) shows the configuration (the sizes are in nm) of the Si base substrate with the grooves cut therein. The stage of the technological cycle of operations with such configurations often takes place at the formation of semiconductor materials with given electrophysical pro- perties of NEMS units, in particular, the elements of three-gate nano-transistors of SON designs (“silicon-on- nothing”, see, for example, [5,6]). Figures 3(b) and (c) show the distributions of C(x,y) for the values and , respectively. 0 I 60 At , the dopants form the domains with a nar- row localization, whose sizes are of the order of 5-10 nm and maxima of the penetration depth of about 7-8 nm (for the given implantation energy EI = 5 eV. Note that in the zones of deep grooves, the implant reaches the sub- strate lower edge (the bottom). 0 I At the implantation under a larger angle (Figure 3(c)) the doping domains naturally “turn” to the implant flow direction. 60 I At such a nano-relief of the surface, shadow zones arise in the substrate. So the concentration of P is insig- nificant in the left Si bump, and on the boards of the grooves and at the plate bottom, the concentration C(x,y) is nearly equal to zero. Figure 4 illustrates the influence of the implantation energy EI at a fixed aiming angle and the same nano-relief of the surface. An increase in EI from 5 eV (Figure 4(a)) to 10 eV (Figure 4(b)) and so on, up to 15 eV (Figure 4(c)) alters significantly the pattern of 30 I the P distribution in Si. The location, sizes, and intensity of doping spots prove to be variable. So, in particular, a doping domain arises at EI = 5 eV in the central bump. Although it has a low intensity and a small size, it is well noticeable. At EI = 10 eV, this domain is smeared significantly, and at EI = 15 eV, the central bump is “transparent” for the implant flux, which “passes” through it and locates in the left segment of the substrate configuration. The concentration of P in the left segment depends substantially on EI and alters from a small domain (Fig- ure 4(a)) to the formation of a vast zone (Figure 4(c)). The right segment of the substrate configuration, as the non-obscured one, is more conservative to the EI variation: the doping domain has here approximately equal sizes, but with increasing EI it naturally shifts deep into the substrate down to its very bottom (Figure 4(c)). Note in conclusion that the function C(x,y) determines the arrangement in Si of the zones of an elevated electric conductivity, in which the arrangement of the channels of nano-transistors is possible (see, for example, [6,7]). 3.4. Miniaturization of NEMS: Problems of Mathematical Modeling The improvement of industrial production of the elec- tronics and the passage, during the last 5 years, from the 130 nm technologies to 90 nm, 65 nm, 45 nm, 32 nm, and 22 nm technologies puts in foreground new very complex problems of the mathematical modeling of electrophysical, thermochemical, and mechanical proc- esses, which are used in these technologies, within the framework of a continuum model. So the computational region size of the problem R, (a) (b) (c) Figure 3. Phosphorus P implantation into the silicon Si substrate with a non-planar surface. The substrate configuration (а), distributions of the concentrations of P in Si at the aiming angle of implantation 0° (b) and 60° (c). Implantation energy 5 eV. (a) (b) (C) Figure 4. Phosphorus P implantation into the silicon Si substrate with non-planar surface. Distributions of the concentrations of P in Si at the aiming angle of implantation 30° and the implantation energy 5 eV (а), 10 eV (b), and 15 eV (c). Copyright © 2010 SciRes. EPE 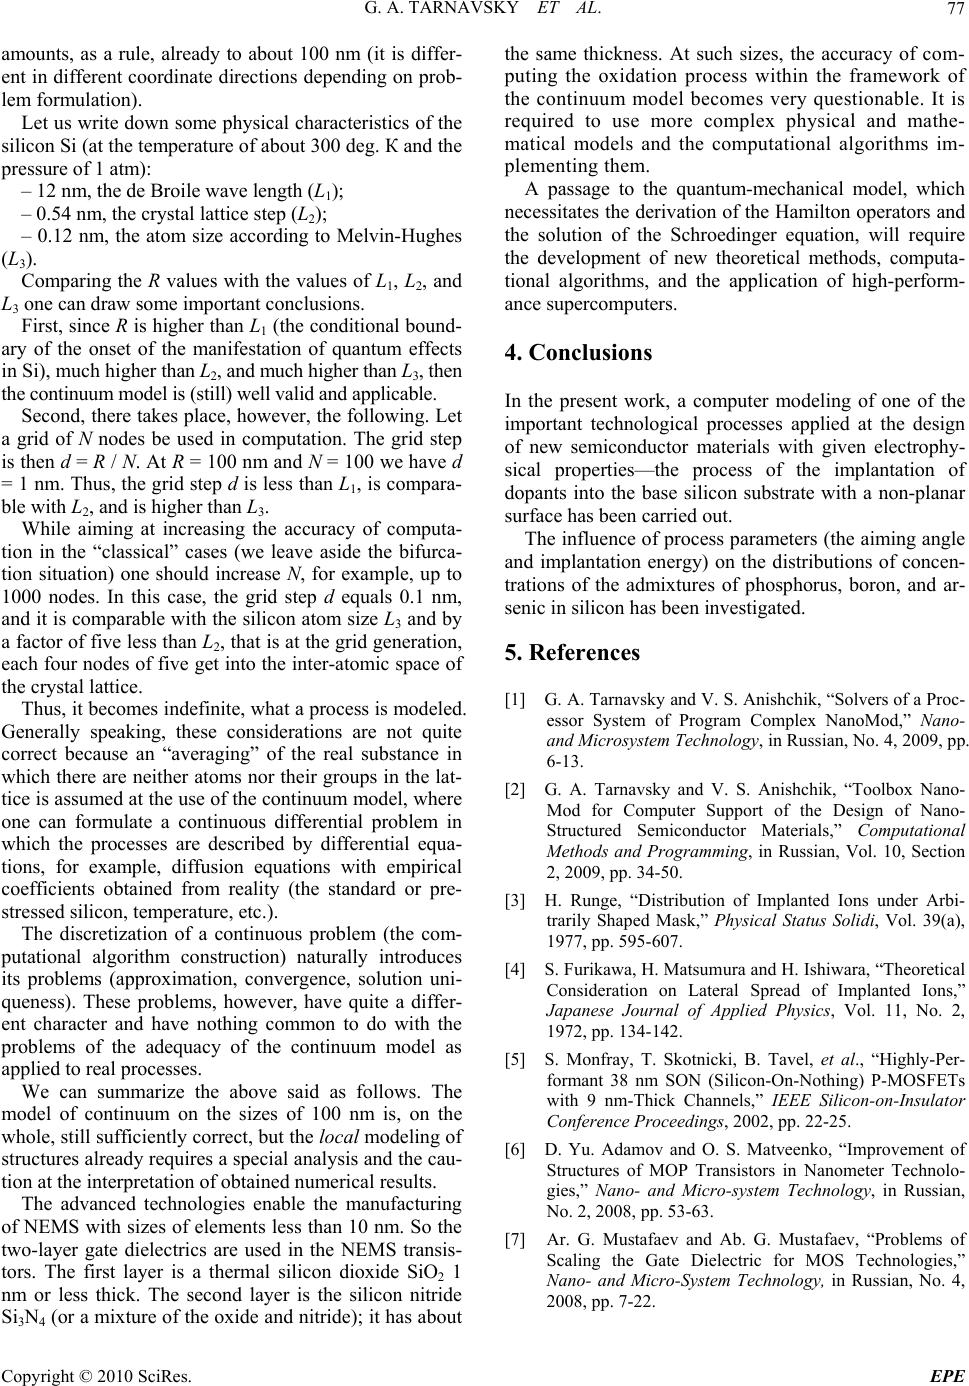 G. A. TARNAVSKY ET AL. 77 amounts, as a rule, already to about 100 nm (it is differ- ent in different coordinate directions depending on prob- lem formulation). Let us write down some physical characteristics of the silicon Si (at the temperature of about 300 deg. К and the pressure of 1 atm): – 12 nm, the de Broile wave length (L1); – 0.54 nm, the crystal lattice step (L2); – 0.12 nm, the atom size according to Melvin-Hughes (L3). Comparing the R values with the values of L1, L2, and L3 one can draw some important conclusions. First, since R is higher than L1 (the conditional bound- ary of the onset of the manifestation of quantum effects in Si), much higher than L2, and much higher than L3, then the continuum model is (still) well valid and applicable. Second, there takes place, however, the following. Let a grid of N nodes be used in computation. The grid step is then d = R / N. At R = 100 nm and N = 100 we have d = 1 nm. Thus, the grid step d is less than L1, is compara- ble with L2, and is higher than L3. While aiming at increasing the accuracy of computa- tion in the “classical” cases (we leave aside the bifurca- tion situation) one should increase N, for example, up to 1000 nodes. In this case, the grid step d equals 0.1 nm, and it is comparable with the silicon atom size L3 and by a factor of five less than L2, that is at the grid generation, each four nodes of five get into the inter-atomic space of the crystal lattice. Thus, it becomes indefinite, what a process is modeled. Generally speaking, these considerations are not quite correct because an “averaging” of the real substance in which there are neither atoms nor their groups in the lat- tice is assumed at the use of the continuum model, where one can formulate a continuous differential problem in which the processes are described by differential equa- tions, for example, diffusion equations with empirical coefficients obtained from reality (the standard or pre- stressed silicon, temperature, etc.). The discretization of a continuous problem (the com- putational algorithm construction) naturally introduces its problems (approximation, convergence, solution uni- queness). These problems, however, have quite a differ- ent character and have nothing common to do with the problems of the adequacy of the continuum model as applied to real processes. We can summarize the above said as follows. The model of continuum on the sizes of 100 nm is, on the whole, still sufficiently correct, but the local modeling of structures already requires a special analysis and the cau- tion at the interpretation of obtained numerical results. The advanced technologies enable the manufacturing of NEMS with sizes of elements less than 10 nm. So the two-layer gate dielectrics are used in the NEMS transis- tors. The first layer is a thermal silicon dioxide SiO2 1 nm or less thick. The second layer is the silicon nitride Si3N4 (or a mixture of the oxide and nitride); it has about the same thickness. At such sizes, the accuracy of com- puting the oxidation process within the framework of the continuum model becomes very questionable. It is required to use more complex physical and mathe- matical models and the computational algorithms im- plementing them. A passage to the quantum-mechanical model, which necessitates the derivation of the Hamilton operators and the solution of the Schroedinger equation, will require the development of new theoretical methods, computa- tional algorithms, and the application of high-perform- ance supercomputers. 4. Conclusions In the present work, a computer modeling of one of the important technological processes applied at the design of new semiconductor materials with given electrophy- sical properties—the process of the implantation of dopants into the base silicon substrate with a non-planar surface has been carried out. The influence of process parameters (the aiming angle and implantation energy) on the distributions of concen- trations of the admixtures of phosphorus, boron, and ar- senic in silicon has been investigated. 5 . References [1] G. A. Tarnavsky and V. S. Anishchik, “Solvers of a Proc- essor System of Program Complex NanoMod,” Nano- and Microsystem Technology, in Russian, No. 4, 2009, pp. 6-13. [2] G. A. Tarnavsky and V. S. Anishchik, “Toolbox Nano- Mod for Computer Support of the Design of Nano- Structured Semiconductor Materials,” Computational Methods and Programming, in Russian, Vol. 10, Section 2, 2009, pp. 34-50. [3] H. Runge, “Distribution of Implanted Ions under Arbi- trarily Shaped Mask,” Physical Status Solidi, Vol. 39(a), 1977, pp. 595-607. [4] S. Furikawa, H. Matsumura and H. Ishiwara, “Theoretical Consideration on Lateral Spread of Implanted Ions,” Japanese Journal of Applied Physics, Vol. 11, No. 2, 1972, pp. 134-142. [5] S. Monfray, T. Skotnicki, B. Tavel, et al., “Highly-Per- formant 38 nm SON (Silicon-On-Nothing) P-MOSFETs with 9 nm-Thick Channels,” IEEE Silicon-on-Insulator Conference Proceedings, 2002, pp. 22-25. [6] D. Yu. Adamov and O. S. Matveenko, “Improvement of Structures of MOP Transistors in Nanometer Technolo- gies,” Nano- and Micro-system Technology, in Russian, No. 2, 2008, pp. 53-63. [7] Ar. G. Mustafaev and Ab. G. Mustafaev, “Problems of Scaling the Gate Dielectric for MOS Technologies,” Nano- and Micro-System Technology, in Russian, No. 4, 2008, pp. 7-22. C opyright © 2010 SciRes. EPE |