 Open Journal of Soil Science, 2012, 2, 33-43 http://dx.doi.org/10.4236/ojss.2012.21006 Published Online March 2012 (http://www.SciRP.org/journal/ojss) 33 Assessment of Variability in the Quality of an Acrisol under Different Land Use Systems in Ghana Emmanuel Osadu Ghartey, Gabriel N. N. Dowuona*, Eric K. Nartey, Thomas A. Adjadeh, Innocent Y. D. Lawson Department of Soil Science, School of Agriculture, University of Ghana, Legon, Ghana. Email: *gdowuona30@hotmail.com Received November 10th, 2011; revised December 20th, 2011; accepted December 30th, 2011 ABSTRACT Three land use types (natural fallow, Leucaena leucocephala woodlot and cultivated plots) on a Ferric Acrisol in a semi-arid tropical zone of Ghana were compared to assess their effects on variability in selected soil properties and plant biomass accumulation. Organic carbon accumulation in the representative natural fallow profile was 22.7 g/kg, followed by 16.5 g/kg for the Leucaena woodlot and lastly 11.8 g/kg for the cultivated site. The mean bulk density of the natural fallow, Leucaena woodlot and cultivated sites were from 1.36 Mg/m3, 0.92 Mg/m3 and 1.33 Mg/m3 with corresponding range in mean weight diameter of 0.5 mm - 1.2 mm, 0.6 mm - 1.2 mm and 1.0 mm - 1.2 mm, respec- tively. The lower bulk density observed for the woodlot corresponds to increased total porosity, aeration, and root pro- liferation due to the stronger and extensive rooting system. Significant differences (P < 0.05) in bulk density, mean weight diameter (MWD), clay content, organic carbon and total nitrogen existed among the land use types. Variability in pH and bulk density of the surface soils was less than 15%, in the three land use types. Generally, clay content and exchangeable Na recorded the highest variability (≥36%). For the surface soils, exchangeable Na was very variable in the natural fallow. Exchangeable Na, Ca and K and total nitrogen were very variable in the Leucaena woodlot and the cultivated sites. Variability in clay content was very high in the cultivated soils only. The order cultivated land > Leu- caena woodlot > natural fallow was noted for properties with high variability (CV ≥ 36%). Plant biomass accumulation was 1834 kg/ha (natural fallow) and 830 kg/ha (Leucaena woodlot) indicating that natural fallows do not only maintain soil quality but they also decrease variability in soil properties which is desirable for soil productivity and quality. Keywords: Aggregate Stability; Bulk Density; Land Use; Mean Weight Diameter; Soil; Organic Carbon; Soil Variability; Woodlot 1. Introduction Soils are characterized by a high degree of variability due to the interplay of physical, chemical, biological and an- thropogenic processes that operate with different intensi- ties and at different scales [1]. These processes in turn in- fluence the nature and properties of soils. Therefore, know- ledge of soil properties is important in determining the best use to which a soil may be put [2]. Conversion of a native land use system to an agricultural system may cause drastic changes in the soil properties. These changes, either upgrading, sustaining, or degrading are dependent on land use as well as management practices. Also, some soil physical and chemical properties are adversely af- fected by the conversion of a particular land use system to another. For example, bulk density tends to increase significantly while plant available water capacity de- creases in cultivated soils due to limited rooting system and increased biological activities [3]. Acrisols, which are low activity clay soils, are the most cultivated and dominant soils in the coastal savanna zone of Ghana [4]. The organic matter content of some of these soils tends to decline rapidly under continuous cultiva- tion [5]. Linked with the loss of soil organic matter, is the decrease in some soil nutrients such as nitrogen and phos- phorus. In this respect, most land use systems in Sub-Sa- haran Africa can be described as unsustainable, owing to low nutrient resources and negative nutrient budgets [6]. Various land management systems have been proposed to address the low nutrient levels in tropical soils. Agro- forestry, a land use system which utilizes perennial woody leguminous tree species to produce biomass and recycle nutrients, is among the methods proposed for the impro- vement and maintenance of soil quality [7-9] apart from other traditional practices such as manuring, cover crop- ping, mulching and shifting cultivation [10]. Evidences *Corresponding author. Copyright © 2012 SciRes. OJSS 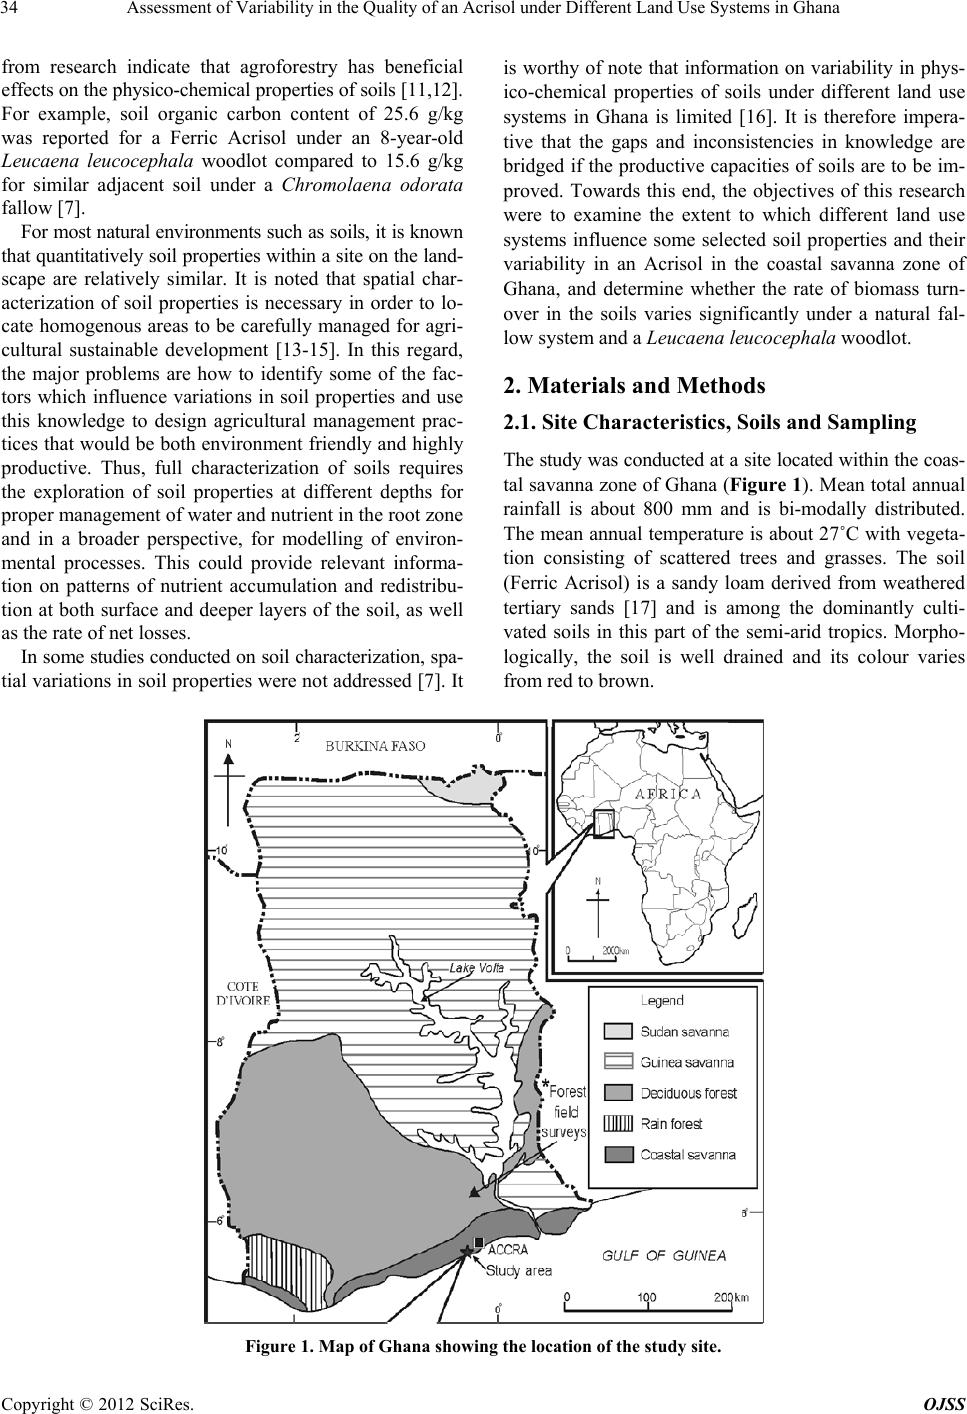 Assessment of Variability in the Quality of an Acrisol under Different Land Use Systems in Ghana 34 from research indicate that agroforestry has beneficial effects on the physico-chemical properties of soils [11,12]. For example, soil organic carbon content of 25.6 g/kg was reported for a Ferric Acrisol under an 8-year-old Leucaena leucocephala woodlot compared to 15.6 g/kg for similar adjacent soil under a Chromolaena odorata fallow [7]. For most natural environments such as soils, it is known that quantitatively soil properties within a site on the land- scape are relatively similar. It is noted that spatial char- acterization of soil properties is necessary in order to lo- cate homogenous areas to be carefully managed for agri- cultural sustainable development [13-15]. In this regard, the major problems are how to identify some of the fac- tors which influence variations in soil properties and use this knowledge to design agricultural management prac- tices that would be both environment friendly and highly productive. Thus, full characterization of soils requires the exploration of soil properties at different depths for proper management of water and nutrient in the root zone and in a broader perspective, for modelling of environ- mental processes. This could provide relevant informa- tion on patterns of nutrient accumulation and redistribu- tion at both surface and deeper layers of the soil, as well as the rate of net losses. In some studies conducted on soil characterization, spa- tial variations in soil properties were not addressed [7]. It is worthy of note that information on variability in phys- ico-chemical properties of soils under different land use systems in Ghana is limited [16]. It is therefore impera- tive that the gaps and inconsistencies in knowledge are bridged if the productive capacities of soils are to be im- proved. Towards this end, the objectives of this research were to examine the extent to which different land use systems influence some selected soil properties and their variability in an Acrisol in the coastal savanna zone of Ghana, and determine whether the rate of biomass turn- over in the soils varies significantly under a natural fal- low system and a Leucaena leucocephala woodlot. 2. Materials and Methods 2.1. Site Characteristics, Soils and Sampling The study was conducted at a site located within the coas- tal savanna zone of Ghana (Figure 1). Mean total annual rainfall is about 800 mm and is bi-modally distributed. The mean annual temperature is about 27˚C with vegeta- tion consisting of scattered trees and grasses. The soil (Ferric Acrisol) is a sandy loam derived from weathered tertiary sands [17] and is among the dominantly culti- vated soils in this part of the semi-arid tropics. Morpho- logically, the soil is well drained and its colour varies from red to brown. Figure 1. Map of Ghana showing the location of the study site. Copyright © 2012 SciRes. OJSS  Assessment of Variability in the Quality of an Acrisol under Different Land Use Systems in Ghana 35 Three land use systems all situated on the same soil were selected. These were 1) an over 60-year-old natural fallow site with indigenous plant species and a soil sur- face covered by a fairly thick layer of residue of leaves and twigs; 2) an adjacent plot with a history of continu- ous cultivation using conventional methods of farming for more than five decades; and 3) a 20-year-old Leu- caena leucocephala woodlot adjacent to the cultivated field but originally cultivated before its conversion to a woodlot for the collection of fuel wood (firewood); the surface was covered with a thin layer of leaf litter. One representative profile was dug on each land use system and characterized. A grid plot (10 m by 10 m) was de- marcated on each land use system and samples from the 0 - 20 cm depth were collected at 2 m along the vertical and horizontal axes. 2.2. Laboratory and Field Investigations Selected soil properties analyzed included particle size distribution, bulk density, aggregate stability, pH, orga- nic carbon, exchangeable bases and acidity, total nitrogen, and available phosphorus. Data on plant biomass were also collected in the field while mineralogical composi- tion of clay fraction of the soil profile was determined. The modified hydrometer method [18] was used to measure particle size distribution; while the clod method [19] was employed in the determination of bulk density. Aggregate stability was estimated by the dry sieving me- thod of Kemper and Rosenau [20] followed by calcula- tion of the mean weight diameter (MWD) of each aggre- gate [21]. Soil pH (1:1, soil:water and soil:0.01 M CaCl2) was measured using a Pancitronic MV 88 pH glass elec- trometer. The dry combustion method involving the use of the Carbon Analyzer (Eltra CS 500 Carbonator) was employed in the determination of organic carbon. Ex- changeable bases were determined by extraction with 1 M ammonium acetate (NH4OAc, pH 7) followed by ana- lyses for Ca and Mg by atomic absorption spectrometry and Na and K by flame photometry. Exchange acidity was determined using the KCl extraction method [22]. Total nitrogen was determined by the acid digestion Kjel- dahl method [23] whereas available phosphorus was de- termined by the method of Bray and Kurtz [24]. Minera- logical composition of the clay fraction of selected pro- file samples was determined by x-ray diffraction (CuKα) at the Laboratory of Department of Mineralogy, Natural History Museum, London, U.K. Total biomass accumulation for each treatment was determined to ascertain the contribution of plant litter to organic carbon accumulation and distribution. Litter fall from the native forest and woodlot plots was collected periodically for a two-month interval on three different occasions using 5 randomly placed 1 m × 1 m quadrants at each site. The amount of plant material including leaves and twigs collected at each respective site was weighed and biomass accumulation on a hectare basis was calcu- lated as: Biomassweight of litter 100 m100 marea of litter box (1) Data were not collected for the cultivated site because of the regular removal of vegetation during tillage in the cropping season and bush burning in the dry season. 2.3. Variability in Soil Properties Coefficient of variation (CV) was used to estimate the extent of variability in soil properties within each land use system. This was calculated as: CV%sz100 (2) where s is the standard deviation and z is the mean of population sample (36 samples for each study site). Ana- lysis of variance using the GenStat software package (ver- sion 9.0) was employed to assess significance of variabi- lity among the land use systems. The LSD procedure was conducted to compare the means of the soil properties at a probability level of 0.05. 3. Results and Discussion 3.1. Morphological Characteristics All the three pedons under the natural fallow (NF), wood- lot (WL) and cultivated land (CL) showed similar char- acteristics. They are well drained with surface granular structure, which changes to columnar below the surface and then breaks into strong angular blocky in the rest of the subsoil and subangular blocky in the C horizons. The granular structures were moderately finer in the surface horizons of the cultivated site than in the forest and wood- lot soils. The horizon boundary of the NF was clear and smooth, abrupt and smooth for WL and wavy for the CL. The wavy boundary of the surface horizons in the CL pedon could be due to the influence of tillage; ploughing could result in mixing and redistribution of soil particles whereas the clear smooth boundary of the horizons of the forest and woodlot pedons indicated less intense distur- bance. Distinct horizons coupled with the morphological features reflect advanced degree of profile development. The NF pedon generally had slightly hard and friable con- sistence, which became sticky, firm to very hard with depth. For the WL pedon, the consistency was slightly hard and friable becoming sticky and moderately hard with depth. In the CL pedon, consistency was very firm at the surface changing to sticky and hard and firm with depth. The colour of the soil was generally dominated by red- dish brown to bright reddish hues in all profiles. Soil co- lour in the profiles at the natural fallow, woodlot and the cultivated sites was generally dominated by reddish brown Copyright © 2012 SciRes. OJSS  Assessment of Variability in the Quality of an Acrisol under Different Land Use Systems in Ghana 36 to bright reddish hues except for the A1 horizon (forest fallow) and A horizons (woodlot soil), which were sli- ghtly darker, apparently due to the greater amounts of organic matter in the horizons. Mineralogical analysis showed that kaolinite is the dominant clay mineral with traces of goethite and haematite. It is therefore apparent that the reddish colours of the soils are from these two Fe-bearing minerals, which also suggest oxidizing condi- tions and good drainage due to the upland site of this soil. Furthermore, the presence of the iron oxide concretions in the subsoil (C horizon) of the profiles might have im- parted the reddish colour to the soil during profile forma- tion and development. The most important influence of Fe and Al oxides in soils is increased P and micronutrient adsorption capacity, resulting in decreased nutrient avai- lability to plants [25]. These oxides also influence soil phy- sical properties by stabilizing soil aggregates, in which the stable aggregates are heavily coated with them [26]. 3.2. Physical Properties Analytical data on selected soil physical properties in the three respective land use systems are provided in Table 1. The texture of the soils was generally sandy clay in the surface horizon and clayey in the B and C horizons. In pedon NF, the clay content increased from 37.5% in the A1 horizon to 55% in the C2 horizon. Conversely, sand content decreased from 54.8% in the A2 horizon to 36.5% in the C2 horizon. In pedon WL, clay content in- creased from 35% in the A1 horizon to 50% in the Bt horizon and then increased to 55% in the C2 horizon while the sand content decreased from 55.9% in the A1 horizon to 42.9% in the Btn horizon and then dropped to 35.8% in the C2 horizon. In pedon CL, the clay content increased from 33.0% in the Ap1 horizon to 58% in the Btn and C2 horizons whereas the sand content decreased from 57.8% in the Ap1 horizon to 35.5% in the C2 hori- zon. The mean clay content for the grid samples were 29.7%, 32.3% and 39.5% for the NF, WL and the CL sites, respectively (Table 2). For the profile samples, it is apparent that an inverse relationship exists between the amounts of sand and clay in the soils. Marked increases in the amounts of clay oc- curred with depth in the B horizon whiles the amount of sand decreased with depth down (Figure 2) indicating Table 1. Selected physical properties of the pedon under natural fallow. Horizon Depth BD† MWD‡ Particle size distribution Texture (cm) (Mg/m3) (mm) sand silt clay Natural fallow site A1 0 - 7 1.13 1.1 43.8 18.7 37.5 sandy clay A2 7 - 24 1.27 0.9 54.8 11.5 37.5 sandy clay Btn1 24 - 51 1.41 1.2 51.0 5.2 40.0 sandy clay Btn2 51 - 96 1.45 1.1 38.5 6.5 55.0 clay C1 96 - 150 1.54 0.5 39.0 8.0 53.0 clay C2 150 - 200 1.54 1.3 36.3 8.7 55.0 clay Woodlot site A1 0 - 7 1.04 0.8 55.9 9.1 35.0 sandy clay A2 7 - 27 1.30 1.2 54.3 5.7 40.0 sandy clay Btn1 27 - 60 1.37 0.9 43.1 6.9 50.0 sandy clay Btn2 60 - 120 1.50 0.6 42.9 7.1 50.0 clay C1 120 - 150 1.30 1.0 39.1 5.9 55.0 clay C2 150 - 200 1.18 1.2 35.8 9.2 55.0 clay Cultivated site Ap1 0 - 6 1.22 1.2 57.8 9.2 33.0 sandy clay Ap2 6 - 21 1.50 1.0 59.8 7.2 33.0 sandy clay Btn1 21 - 5 1.57 1.0 34.6 7.4 58.0 sandy clay Btn2 56 - 101 1.70 1.1 34.5 7.5 58.0 clay C1 101 - 139 1.73 1.1 36.8 8.2 55.0 clay C2 139 - 200 1.74 1.1 35.5 6.5 58.0 clay †BD = bulk density; ‡MWD = mean weight diameter. Copyright © 2012 SciRes. OJSS  Assessment of Variability in the Quality of an Acrisol under Different Land Use Systems in Ghana 37 Table 2. Mean values of soil properties (n = 36; at 0 - 20 cm depth) under different land use systems. Land use systems† Soil property Natural fallow Woodlot Cultivated Bulk density (Mg/m3) 1.36 ± 0.04 0.92 ± 0.05 1.33 ± 0.04 MWD (mm) 1.00 ± 0.02 0.88 ± 0.03 1.11 ± 0.03 % Clay 29.7 ± 0.4 32.3 ± 0.8 39.5 ± 0.8 pH (H2O) 5.81 ± 0.03 5.67 ± 0.04 5.59 ± 0.05 pH (CaCl2) 5.25 ± 0.03 5.11 ± 0.04 5.15 ± 0.03 Organic carbon (g/kg) 16.2 ± 0.4 11.4 ± 0.3 8.6 ± 0.2 Total nitrogen (g/kg) 1.13 ± 0.04 0.50 ± 0.04 0.65 ± 0.05 Available P (mg/kg) 7.46 ± 0.26 6.62 ± 0.28 8.17 ± 0.41 Exch. Ca (cmol/kg) 1.33 ± 0.07 0.70 ± 0.06 1.88 ± 0.14 Exch. Mg (cmol/kg) 1.33 ± 0.05 0.63 ± 0.03 1.03 ± 0.05 Exch. Na (cmol/kg) 0.29 ± 0.02 0.12 ± 0.01 0.16 ± 0.01 Exch. K (cmol/kg) 0.50 ± 0.03 0.50 ± 0.04 0.43 ± 0.03 † = data are mean values ± standard error. Figure 2. Distribution of clay and sand as a function of dep- th in the profiles under the natural fallow, woodlot and cul- tivated soil. clay enrichment and sand depletion in all three pedons. Furthermore, this trend indicated gradual breakdown of sand size materials to finer sizes. The high clay accumu- lation in the B horizon of all the three pedons might be indicative of clay movement from the horizon above it. The clay enrichment in the B horizon resulted in the for- mation of an argillic horizon in all the pedons. Similar results were reported by Dowuona [27] and Eze [28] for similar soils in the study area. Occurrence of illuviated clays might relate to presence of plant roots in the soils. Plant roots were found mainly in the surface layer from (0 - 40 cm) with fewer roots below the 40 cm depth. As noted by some authors elsewhere [29], this is an indica- tion of the presence of illuviated clays in the Bt horizon. The fairly similar texture of the soils at the three sites indicates uniformity with regard to soil development. Generally, the A horizons of all the soils showed a lower bulk density than the B horizons. The bulk density of the natural fallow (NF) ranged from 1.13 Mg/m3 in the A1 horizon to 1.54 Mg/m3 in the C2 horizon (Table 1). In the woodlot pedon, bulk density varied from 1.04 Mg/m3 in the A1 horizon to 1.50 Mg/m3 in the B2 whereas the values ranged from 1.22 Mg/m3 in the Ap1 horizon to 1.74 Mg/m3 in C2 horizon of CL pedon. Bulk density values were 1.33 ± 0.04 Mg/m3, 0.92 0.05 Mg/m3 and 1.36 ± 0.04 Mg/m3 for the surface (0 - 20 cm) soils at the cultivated, woodlot and natural fallow sites, respec- tively (Table 3). Statistical analyses indicated significant differences (0.05 level of probability) for bulk density values of the grid (surface) samples of the different land use systems. Table 3. Analysis of variance of the soil properties. Land use systems Soil property (5%) Natural Fallow† Woodlot† Cultivate†LSD Bulk density (Mg/m3) 1.36a 0.92b 1.33a 0.12 MWD (mm) 1.00b 0.88c 1.11a 0.06 Clay (%) 29.65c 32.29b 39.51a 1.50 pH (H2O) 5.81a 5.67b 5.59b 0.12 pH (CaCl2) 5.25a 5.11b 5.15b 0.10 Organic carbon (g/kg) 16.15a 11.36b 8.63c 0.84 Total nitrogen (g/kg) 1.13a 0.50c 0.65b 0.12 Available P (mg/kg) 7.46ab 6.62b 8.17a 0.91 Exch. Ca (cmol/kg) 1.33b 0.70c 1.88a 0.27 Exch. Mg (cmol/kg) 1.33a 0.63c 1.03b 0.13 Exch. Na (cmol/kg) 0.29a 0.12c 0.16b 0.04 Exch. K (cmol/kg) 0.50a 0.50a 0.43a 0.09 †Means followed by the same letters are not significantly different (signifi- cant differences at P < 0.05 in soil properties between land use types); num- ber of samples = 36; at 0 - 20 cm depth. Copyright © 2012 SciRes. OJSS  Assessment of Variability in the Quality of an Acrisol under Different Land Use Systems in Ghana 38 The lower bulk density in the surface horizons could be attributed to the relatively higher organic matter they contained. Conversely, the higher bulk density observed in the B horizons might be due to compaction and higher clay content. Bulk densities are generally higher in dee- per soil profiles probably as a result of compaction caused by overlying layers, lower organic matter contents, less aggregation and fewer roots as a result of root impedance [30]. Generally, the relatively lower bulk density levels in the NF and WL pedons were probably influenced by the extensive rooting system of the native trees and Leu- caena trees which also penetrated the subsoil. Presence of many medium biopores is an indication of increased biological activity which was common in the surface layer of the natural fallow soils; the pores were dominant in the woodlot but less prominent in the cropped soils. The pores might have influenced the differences in the bulk density and possibly total porosity of the soils under the native, woodlot and the cropped soils. The mean weight diameter (MWD) of aggregates ran- ged from 0.5 mm to 1.3 mm for the NF pedon, 0.8 mm to 1.2 mm for the WL pedon and 1.0 mm to 1.2 mm for the cultivated sites (Table 1). For the surface soils, the MWD values values were of 1.0 ± 0.02 mm, 0.88 ± 0.03 mm and 1.11 ± 0.03 mm, respectively, for the natural fallow, woodlot and cultivated sites (Table 3). Significant dif- ferences existed among the three land use systems. The greater MWD value in the natural fallow relative to the woodlot could be attributed to the cover provided by tree canopy and binding action of plant roots. The relatively larger soil aggregates at the cultivated site may be due to campaction caused by continuous tillage. Chaudhary and Sandhu [31] reported that variation in aggregate size could be due to differences in texture and structure brought about by tillage, compaction, cropping, and other management events. 3.3. Chemical Properties The pH (water) ranged from 5.3 to 6.5, indicative of sli- ghtly acidic conditions (Table 4). The A horizons of the Table 4. Selected chemical properties of the pedon under natural fallow. Exchangeable bases Horizon Depth pH† pH ΔpH OC† TN†Avail P†.Ca Mg K Na TEB† Al H ECEC†B.S† (cm) (H2O) (CaCl2) --- g/kg --- (mg/kg)------------------------cmol/kg ---------------------------- (%) Natural fallow site A1 0 - 7 5.7 4.6 1.1 22.7 1.4 9.5 1.8 0.9 0.8 0.3 3.8 0.04 0.01 3.9 98.7 A2 7 - 24 5.6 4.8 0.7 12.4 1.2 5.1 0.6 0.8 0.3 0.4 2.1 0.09 0.03 2.2 94.6 Btn1 24 - 51 5.3 4.7 0.7 9.3 1.1 2.8 0.5 0.4 0.1 0.4 1.5 0.22 0.08 1.7 88.2 Btn2 51 - 96 5.6 4.5 1.1 8.3 0.9 2.7 0.5 0.4 0.1 0.5 1.5 0.50 0.04 2.0 73.5 C1 96 - 150 5.6 4.6 1.0 7.3 0.7 2.3 0.4 0.6 0.1 0.4 1.5 0.36 0.07 1.9 77.7 C2 150 - 200 5.8 4.4 1.4 6.6 0.8 1.7 0.4 0.2 0.1 0.3 1.0 0.54 0.08 1.6 61.7 Woodlot site A1 0 - 7 5.6 5.0 0.6 16.5 1.3 8.8 0.6 1.1 0.9 0.3 3.0 0.04 0.02 3.0 97.9 A2 7 - 27 5.8 4.8 1.0 9.5 1.1 3.8 0.6 0.6 0.3 0.3 1.8 0.11 0.03 1.9 92.8 Btn1 27 - 60 5.9 4.8 1.1 6.0 0.7 2.7 0.8 0.5 0.3 0.5 1.9 0.24 0.05 2.2 86.8 Btn2 60 - 120 6.0 4.8 1.2 5.3 0.5 2.5 0.6 0.9 0.1 0.6 2.2 0.17 0.03 2.4 91.7 C1 120 - 150 6.0 4.5 1.5 4.0 0.4 1.4 0.5 0.6 0.1 0.3 1.5 0.43 0.04 2.0 76.1 C2 150 - 200 6.0 4.5 1.5 3.4 0.3 1.0 0.4 0.5 0.1 0.3 1.3 0.53 0.04 1.9 69.5 Cultivated site Ap1 0 - 6 5.7 5.4 0.3 11.8 0.6 11.20.5 0.4 0.6 0.2 1.7 0.03 0.03 1.8 96.6 Ap2 6 - 21 6.0 4.9 1.0 8.5 0.8 4.1 0.8 0.7 0.2 0.2 1.9 0.05 0.02 2.0 96.4 Btn1 21 - 56 6.1 5.0 1.1 5.9 0.8 2.9 1.4 1.8 0.1 0.4 3.7 0.08 0.06 3.8 96.3 Btn2 56 - 101 6.4 5.3 1.1 4.7 0.7 2.0 1.3 1.7 0.1 0.6 3.7 0.10 0.02 3.8 96.8 C1 101 - 139 6.3 5.3 1.0 3.9 0.9 1.7 1.3 1.6 0.1 0.3 3.3 0.04 0.02 3.4 98.2 C2 139 - 200 6.5 4.9 1.6 3.8 0.8 0.7 1.1 1.6 0.1 0.3 3.1 0.19 0.04 3.3 93.1 †ΔpH = pH (H2O) − pH (CaCl2) [1:1]; Avail P. = available phosphorus; ECEC = effective cation exchange capacity; OC = Organic carbon; TN = total nitrogen; TEB = total exchangeable bases; B.S = base saturation. Copyright © 2012 SciRes. OJSS  Assessment of Variability in the Quality of an Acrisol under Different Land Use Systems in Ghana 39 three pedons gave pH values that were nearly uniform. In each profile, pH varied minimally. The change in pH va- lues (ΔpH = pH water – pH CaCl2) was positive for all three land use types, indicating a net negative charge on the colloidal surfaces of the soil [32]. These pH levels were similar to those reported in previous studies [27,28] for similar soils elsewhere. Exchangeable bases in all the pedons were very low (below 4 cmol/kg) with Ca and Mg accounting for greater portion of exchange sites which reflected the high base saturation. Effective cation ex- change capacity is very low due the dominance of low activity clays. Organic carbon, total nitrogen and available phosphor- rus contents were highest in the A horizon and then de- creased with depth in all the three pedons except nitrogen content in the cultivated soils (Figure 3). The NF profile recorded the highest organic carbon content, which re- duced from 22.7 g/kg in the A1 horizon to 6.6 g/kg in the C2 horizon. In pedon WL, organic carbon varied from 16.5 g/kg in the A1 horizon to 3.4 g/kg in the C2 horizon. Similarly, in pedon CL, organic carbon content reduced from 11.8 g/kg in the Ap1 horizon to 3.8 g/kg in the C2. The mean respective OC content for the surface samples at the NF, WL and CL sites were 16.2 ± 0.4 g/kg, 11.4 ± 0.3 g/kg and 8.6 ± 0.2 g/kg (Table 2). The NF, WL and CL sites had mean nitrogen contents of 1.13 ± 0.04 g/kg, 0.50 ± 0.04 g/kg and 0.65 ± 0.05 g/kg, respectively. It is apparent that total nitrogen content of the natural fallow soil was significantly higher than those of the woodlot and cultivated sites. Changes in organic carbon and nitro- gen contents among the different land use systems were minimal in the subsoil of the pedons compared to the sur- face soils, indicating that the surface soil layers was most affected by different land use systems. Yifru and Taye [33] noted higher nitrogen content in natural forest soils than in cultivated soils in southeastern Ethiopia. The differences may be attributed to losses from plant uptake at the cultivated site and low build up under the woodlot. Differences in OC content among the sites were significant (Table 3). Available P content of the surface soils (0 - 20 cm) varied from a mean value of 7.46 ± 0.26 mg/kg (NF), 6.62 ± 0.28 mg/kg (WL) and 8.17 ± 0.41 mg/kg (CL). The low levels of available P confirm the inherent low P fertility status of the soil as noted in other studies elsewhere [28]. 3.4. Management-Induced Changes in Soil Properties As noted in the Sections 3.1 to 3.3, organic carbon, ag- gregate stability and bulk density were the soil properties which were responsive to land use change, especially in the surface soils. Soil organic carbon (SOC) in the natu- ral fallow soil was the highest followed by the woodlot and the cultivated land. Generally, the trend in organic carbon content was in the order NF > WL > CL (Figure 4). The highest SOC in the natural forest fallow might be due to greater addition of organic materials to this soil. Lower rate of accumulation due to continuous tillage operation accounts for the relatively lower SOC at the cultivated site. These observations are consistent with find- ings of other studies elsewhere where greater SOC con- tents were recorded in virgin or forest lands compared to cultivated lands [33-36] possibly due to increased de- composition and mineralization of organic materials [37]. Riezebos and Loerts [38] observed that clearing of fo- rests for crop production invariably resulted in a loss of soil organic matter because of the removal of large quan- tities of biomass during land clearing, a reduction in the quantity and quality of organic inputs added to the soil and increased soil organic matter decomposition rates. Figure 3. Changes in organic carbon, total nitrogen and available phosphorus as a function of depth in the profiles the under natural fallow, woodlot and cultivated soil. Copyright © 2012 SciRes. OJSS  Assessment of Variability in the Quality of an Acrisol under Different Land Use Systems in Ghana 40 Figure 4. Organic carbon distribution with depth in the pro- files under the natural fallow, woodlot and cultivated soil. Higher decomposition rates associated with these condi- tions are due to enhanced biological activity caused by soil mixing from tillage and higher temperatures from in- creased soil exposure [39]. The reduction in organic car- bon content was gradual in the cultivated and woodlot soils as compared to that of the natural forest land. This may be due to mixing up of soil in the surface by tillage or the burrowing actions of soil fauna in the cultivated and woodlot pedons. The significantly high amount of total nitrogen (TN) contents recorded for the NF pedon as opposed to the WL pedon might be due to the higher biomass accumula- tion in the surface horizons of the NF pedon. It is noted elsewhere that total tree harvesting caused three-fold re- moval of soil nutrients, including nitrogen, under con- ventional tillage practices [40]. In addition to losses from biomass removal, soil nutrients can also be lost from the cultivated sites by increased soil nutrient immobilization and leaching when little vegetation is present for nutrient uptake [41]. The MWD interrelated well with organic carbon in all the land use types (Table 3). The higher organic carbon content of the natural fallow was associated with higher aggregate stability. It therefore appears that the NF site would be the most resistant to degradation and erosion. Improvement in soil structure due to high organic carbon content under L. leucocephala provided a favourable mi- croclimate, which might enhance micro fauna activities, thereby leading to soil water holding capacity enhance- ment and nutrient recycling by beneficial biological or- ganism. Also, the microclimate provided by the L. leu- cocephala trees might have allowed other fauna to bur- row into the soil and promoted good soil structures lead- ing to better aeration and root development. The obser- vations in this study are in conformity with the findings of similar studies elsewhere [42-43]. The significant differences in organic matter among the land use types could be due to the different levels of bio- mass accretion. The relationship between organic matter, bulk density level and soil structure could be moderated by cultivation [44]. According to Seubert et al. [45] and Allen [46] soil compaction from tillage practices often results in a decline in macro-porosity, higher susceptibil- ity to erosion, and decreased hydraulic conductivity [47]. It is therefore likely that the cultivated soils could be sub- ject to these hazards in the long term leading to perma- nent land degradation. 3.5. Plant Biomass Accumulation Data on plant litter accumulation indicated that the natu- ral fallow accumulated greater amount of plant litter (Ta- ble 5). Biomass accumulation per hectare during the stu- dy period on the natural fallow (5610 kg/ha) was more than twice that of the woodlot (2560 kg/ha). On an an- nual and area basis, the 1830 kg/ha biomass translates into 11.22 tons of litter/ha/yr while the annual rate of accumulation in the woodlot was 5.12 tons of litter/ha/yr. These levels of litter accretion were comparable to those recorded by Dowuona et al. [7] in some Acrisols else- where in the coastal savanna zone of Ghana. Although the quality of litter was not determined in this study, Dowuona et al. [7] noted that C/N ratios of 5.1 to 6.6 for Leucaena litter suggested a favourable decomposition of organic material to increase soil organic matter content. As noted by Lal [11], soil organic matter rejuvenates de- graded soils, increases biomass production and reduces the rate of enrichment of atmospheric CO2. It is, there- fore likely that the natural fallow and woodlot land use systems present sustainable options for maintaining soil productivity. 3.6. Variability in Soil Properties Data on calculated coefficient of variation are presented in Table 6. The classification system of Wilding and Drees [48] based on the relative values of the percent coefficient of variability (% CV) was adopted to deter- mine the extent of variability in selected soil properties under the different land use types. The coefficient of va- riation is dimensionless hence values from one parameter to the others can be compared. A coefficient of variation value of 0 - 15, 16 - 35, and ≥36 represents little (group I), moderate (group II) and high variability (group III), respectively. Coefficient of variation, which is an approximation of heterogeneity of the sampling site, was compared among the three land use types. Majority of soil properties in the natural fallow classified as groups I and II. For the wood- lot, groups I, II and III were noticeable. In the cultivated Copyright © 2012 SciRes. OJSS  Assessment of Variability in the Quality of an Acrisol under Different Land Use Systems in Ghana 41 Table 5. Biomass accretion under the natural fallow and woodlot land sites. Land use Weight of plant litter collected† Biomass P1 P2 P3 ----------------(kg)----------------- (kg/ha) Natural fallow (NF) 0.192 0.183 0.186 5610 Woodlot (WL) 0.089 0.082 0.085 2560 † = mean of 5 samples. Table 6. Variation in soil properties (n = 36; at 0 - 20 cm depth) within land use sy ste m s. CV† group in land use systems Soil property Natural Fallow Woodlot Cultivated pH (H2O) I I I pH (CaCl2) I I I Organic carbon (g/kg) I II I Total Nitrogen (g/kg) II III III Available P (mg/kg) II II II Exchangeable Ca (cmol/kg) II III III Exchangeable Mg (cmol/kg) II II II Exchangeable Na (cmol/kg) III III III Exchangeable K (cmol/kg) II III III Bulk density (Mg/m3) I I I MWD (mm) I II II % Clay II I III †I = CV < 15%; II = CV 15% - 35%; III = CV ≥ 36%. soils, however, groups II and III were more prominent. The woodlot had four soil properties (total nitrogen, ex- changeable Ca, exchangeable Na and exchangeable K) that were very variable (group III). Lastly, five soil prop- erties namely, total nitrogen, exchangeable Ca, ex- changeable Na, exchangeable K, and clay content were very variable (group III) at the cultivated site. It is ap- parent that the natural fallow plot was more homogenous than the other land use systems. Only exchangeable Na was very vari- able (group III) in the natural fallow soil. These results suggest that soils under the natural fal- low showed improvements (or better fertility build-up) and decrease in variability in soil properties. The large variability in soil properties under the cultivated soil is the result of disturbance from tillage and uptake by plants. 4. Conclusion Changes in land use type had significant effect on char- acteristics of the soil studied. Variations in organic car- bon, nitrogen, bulk density and aggregate stability among different land use systems were minimal in the subsoil as compared to the surface soil layer of all the pedons, in- dicating the impact that the different land use practices had on these properties. Cultivation caused decreases in soil organic matter and aggregate stability and increase in bulk density. Conversion of native lands to agricultural systems may cause drastic changes in soil properties, thereby inducing variability. This suggests the need for sustainable cropping systems such as addition of organic matter and crop residues and crop rotation to mitigate the negative impact of cultivation. Agroforestry using fast growing leguminous trees improves build of organic matter and development of good soil structure. Natural fallows do not only improve soil fertility but also de- creases soil variability which is desirable for both practi- cal and experimental agriculture. Cropping in between forest trees may be a feasible and sustainable method of improving crop production while conserving soil produc- tivity. 5. Acknowledgements The authors wish to thank the Technical staff at the De- partment of Soil Science and the Ecological Laboratory, University of Ghana for the assistance during the labora- tory investigations. We are grateful to Dr. Bill Dubbin, Department of Mineralogy, Natural History Museum, London, U.K., for the support in mineralogical analyses of selected soil samples in their Laboratory. REFERENCES [1] P. Goovaerts, “Geostatistical Tools for Characterizing the Spatial Variability of Microbiological and Physico-Chemical Soil Properties,” Biology Fertilizers and Soil, Vol. 27, No. 4, 1998, pp. 315-334. doi:10.1007/s003740050439 [2] A. A. Amusan, A. K. Shitu, W. O. Makinde and O. Ore- wole, “Assessment of Changes in Selected Soil Properties under Different Land Use in Obafemi Awolowo Univer- sity Community, Ile-Ife, Nigeria,” Electronic Journal of Environmental Agriculture, Food Chemistry, Vol. 5, No. 1, 2006, pp. 1178-1184. [3] W. E. Larson and F. J. Pierce, “The Dynamics of Soil Quality as a Measure of Sustainable Management,” In: J. W. Doran, D. C. Coleman, D. F. Bezdicek and B. A. Stew- art, Eds., Defining Soil Quality for a Sustainable Envi- ronment, Soil Science Society of America Special Pub- lication, Madison, 1994, pp. 37-70. [4] G. N. N. Dowuona, I. A. Taina and R. J. Heck, “Porosity Analysis of Two Acrisols by X-Ray Computed Microto- mography,” Soil Science, Vol. 174, No. 11, 2009, pp. 583- 893. doi:10.1097/SS.0b013e3181c2a90b [5] B. T. Kang, “Alley Cropping: Past Achievements and Fu- ture Directions,” Agroforestry Systems, Vol. 23, No. 2-3, 1993, pp. 141-155. doi:10.1007/BF00704912 Copyright © 2012 SciRes. OJSS  Assessment of Variability in the Quality of an Acrisol under Different Land Use Systems in Ghana 42 [6] C. M. A. Smaling, L. O. Fresco and A. de Jager, “Classi- fying. Monitoring and Improving Nutrient Stocks and Flows in African Agriculture,” AMBIO, Vol. 25, No. 8, 1996, pp. 492-496. [7] G. N. N. Dowuona, A. R. Mermut, S. G. K. Adiku, E. Nartey and I. Tete-Mensah, “Improvement in the Quality of Soils under Agroforestry Practice in Ghana,” In: G. Renard, A. Neef, K. Becker and M. von Oppen, Eds., Soil Fertility Management in West Africa Land Use Systems, Margraf Verlag, Weikersheim, 1998, pp. 251-258. [8] D. E. Mercer and S. Pattanayak, “Agroforestry Adoption by Small Holders,” In: Sills E. and K. Abt, Eds., Forests in a Market Economy, Kluwer, Dordrecht, 2003, pp. 283- 300. [9] D. E. Mercer, “Adoption of Agroforestry Innovations in the Tropics: A Review,” Agroforestry Systems, Vol. 61- 62, No. 1-3, 2004, pp. 311-328. doi:10.1023/B:AGFO.0000029007.85754.70 [10] P. H. Nye and D. Stephens, “Soil Fertility,” In: J. B. Wills, Ed., Agriculture and Land Use in Ghana, Oxford Univer- sity Press, London, 1962, pp. 127-143. [11] R. Lal, “Soil Carbon Sequestration to Mitigate Climate Change,” Geoderma, Vol. 123, No. 1-2, 2004, pp. 1-22. doi:10.1016/j.geoderma.2004.01.032 [12] A. D. Arowolo, “Alley Farming and Sustainable Agricul- ture” Proceedings of Annual Conference of IRDI Re- search and Development Network, Vol. 2, No. 4, 2007, pp. 27-28, 44-48. [13] A. B. McBratney and M. J. Pringle, “Estimating Average and Proportional Variograms of Soil Properties and their Potential Use in Precision Agriculture,” Precision Agri- culture, Vol. 1, No. 2, 1999, pp. 125-152. doi:10.1023/A:1009995404447 [14] A. Castrignano, M. Mazzoncini and L. Giugliarini “Spa- tial Characterization of Soil Properties,” Advances in GeoEcology, Vol. 31, 2002, pp. 105-111. [15] Y. Jafar, S. Mahboub, F. Hamed, K. Najafali, E. Mostafa and B. Majid, “Spatial Variability of Soil Fertility Proper- ties for Precision Agriculture in Southern Iran,” Journal of Applied Sciences, Vol. 8, No. 9, 2008, pp. 1642-1650. doi:10.3923/jas.2008.1642.1650 [16] G. N. N. Dowuona, L. Atsivor and S. G. K. Adiku, “A Multi-Criteria Evaluation of Three Land Use Systems in Ghana,” In: G. Renard, S. Krieg, P. Lawrence and M. Von Oppen, Eds., Farmers and Scientists in a Changing En- vironment: Assessing Research in West Africa, Margraf Verlag, Weikersheim, 2000, pp. 157-162. [17] H. Brammer, “Soils,” In: J. B. Wills, Ed., Agriculture and Land Use in Ghana, Oxford University Press, London, 1962, pp. 88-126. [18] P. R. Day, “Particle and Particle Size Analysis,” In: C. A. Black, Ed., Methods of Soil Analysis, Agronomy No. 9, Part I, American Society of Agronomy, Madison, 1965, pp. 545-567. [19] G. R. Blake and K. H. Hartge, “Bulk Density,” In: A. Klute, Ed., Methods of Soil Analysis, Part 1—Physical and Mineralogical Methods, American Society of Agronomy- Soil Science Society of America, Madison, 1986, pp. 363- 382. [20] W. D. Kemper and R. C. Rosenau, “Aggregate Stability and Size Distribution,” In: A. Klute, Ed., Methods of Soil Analysis, Part 1—Physical and Mineralogical Methods, American Society of Agronomy-Soil Science Society of America, Madison, 1986, pp. 425-442. [21] D. Hillel, “Introduction to Environmental Physics,” El- sevier Academic Press, Amsterdam, 2004. [22] G. W. Thomas, “Extractable Cations,” In: A. L. Page, R. H. Miller and D. Keeney, Eds., Methods of Soil Analysis, Part 2—Chemical and Biochemical Methods, American Society of Agronomy-Soil Science Society of America, Madison, 1982, pp. 159-165. [23] J. M. Bremner and C. S. Mulvaney, “Nitrogen—Total,” In: A. L. Page, R. H. Miller and D. Keeney, Eds., Meth- ods of Soil Analysis, Part 2—Chemical and Biochemical Methods, American Society of Agronomy-Soil Science Society of America, Madison, 1982, pp. 595-622. [24] R. H. Bray and L. T. Kurtz, “Determination of Total Or- ganic and Available Forms of Phosphorus in Soils,” Soil Science, Vol. 59, No. 1, 1945, pp. 39-46. doi:10.1097/00010694-194501000-00006 [25] H. Tiessen, M. K. Abekoe, L. H. Salcedo and E. Owusu- Bennoah, “Reversibility of Phosphate Sorption by Fer- ruginous Nodules,” Plant and Soil, Vol. 153, No. 1, 1993, pp. 113-124. doi:10.1007/BF00010550 [26] P. M. Huang, “Ionic Factors Affecting Aluminum Trans- formations and the Impact on Soil and Environmental Sciences,” University of Saskatchewan, Saskatoon, 1988. [27] G. N. N. Dowuona, “Correlation of the Ghanaian System of Soil Classification with other International Systems,” Master’s Thesis, University of Ghana, Legon, 1985. [28] P. N. Eze, “Characterization, Classification and Pedogenesis of Soils on a Legon Catena in the Accra Plains, Ghana,” Master’s Thesis, University of Ghana, Legon, 2008. [29] V. M. Dang and D. W. Anderson, “Application of Soil Tax- onomy Classification to Northern Vietnam,” Vietnamese Soil Science, Vol. 13, 2000, pp. 15-23. [30] N. C. Brady and R. R. Weil, “The Nature and Property of Soils,” 12th Edition, Prentice-Hall Inc., New Jersey, 1999. [31] T. N. Chaudhary and K. S. Sandhu, “Soil Physical Envi- ronment and Root Growth,” Advances in Soil Science, Vol. 1, 1983, pp. 1-43. [32] K. H. Tan, “Principles of Soil Chemistry,” Marcel Dekker Inc., New York, 1982. [33] A. Yifru and B. Taye, “Effects of Landuse on Soil Or- ganic Carbon and Nitrogen in Soil of Bale, Southeastern Ethiopia,” Tropical and Subtropical Agroecosystems, Vol. 14, No. 1, 2011, 229-235. [34] F. Caravaca, G. Masciandaro, and B. Ceccanti, “Land Use in Relation to Soil Chemical and Biochemical Properties in a Semiarid Mediterranean Environment,” Soil and Tillage Research, Vol. 68, No. 1, 2002, pp. 23-30. doi:10.1016/S0167-1987(02)00080-6 [35] D. D. Malo, T. E. Schumacher and J. J. Doolittle, “Long- Term Cultivation Impacts on Selected Soil Properties in the Northern Great Plains,” Soil and Tillage Research, Vol. 81, No. 2, 2005, pp. 277-291. Copyright © 2012 SciRes. OJSS  Assessment of Variability in the Quality of an Acrisol under Different Land Use Systems in Ghana Copyright © 2012 SciRes. OJSS 43 doi:10.1016/j.still.2004.09.015 [36] G. Heluf and N. Wakene, “Impact of Land Use and Man- agement Practices on Chemical and Properties of Some Soils of Bako Area, Western Ethiopia,” Ethiopian Journal of Natural Resources, Vol. 8, No. 2, 2006, pp. 177-197. [37] G. Guggenberger, W. Zech and R. J. Thomas, “Lignin and Carbohydrate Alteration in Particle Size Separates of an Oxisol under Tropical Pastures Following Native Sa- vanna,” Soil Biology and Biochemistry, Vol. 27, No. 12, 1995, pp. 1629-1638. doi:10.1016/0038-0717(95)00080-X [38] H. T. Riezebos and A. C. Loerts, “Influence of Land Use Change and Tillage Practices on Soil Organic Matter in Southern Brazil and Eastern Paraguay,” Soil and Tillage Research, Vol. 49, No. 3, 1998, pp. 271-275. doi:10.1016/S0167-1987(98)00176-7 [39] R. G. Barber, “Soil Degradation in Tropical Low Lands of Santa Cruz, Eastern Bolivia,” Land Degradation and Rehabilitation, Vol. 6, No. 2, 1995, pp. 95-107. doi:10.1002/ldr.3400060204 [40] J. H. Patrick and D. W Smith, “Forest Management and Nutrient Cycling in Eastern Hardwoods,” Northeast For- estry Experimental Station, Broomall, 1975. [41] G. D. Mroz, M. F. Jurgensen and D. J. Frederick, “Soil Nutrient Changes following Whole Tree Harvesting on Three-Northern Hardwood Sites,” Soil Science Society of America Journal, Vol. 49, No. 6, 1985, pp. 1552-1557. doi:10.2136/sssaj1985.03615995004900060044x [42] J. Six, E. T. Elliott and K. Paustian, “Aggregate and Soil Organic Matter Dynamics under Conventional and No- Tillage Systems,” Soil Science Society of America Jour- nal, Vol. 63, No. 5, 1999, pp. 1350-1358. doi:10.2136/sssaj1999.6351350x [43] I. Celik, “Land-Use Effects on Organic Matter and Physi- cal Properties of Soil in a Southern Mediterranean High- land of Turkey,” Soil and Tillage Research, Vol, 83, No. 2, 2005, pp. 270-277. doi:10.1016/j.still.2004.08.001 [44] R. Lal, “Tropical Ecology and Physical Edaphology,” John Wiley & Sons, Chichester, 1987 [45] C. E. Seubert, P. A. Sanchez and C. Valverde, “Effects of Land Clearing Methods on Soil Properties of an Ultisol and Crop Performance in the Amazon Jungle of Peru,” Tropical Agriculture, Trinidad, Vol. 54, 1977, pp. 307-321. [46] J. Allen, “Soil Response to Forest Clearing in the United States and in the Tropics: Geological and Biological Fac- tors,” Biotropica, Vol. 17, No. 1, 1985, pp. 15-27. doi:10.2307/2388373 [47] E. J. A. Spaans, G. A. M. Baltissen, J. Bouma, R. Miedema, A. L. E. Lansu, D. Schoonderbeek and W. G. Wielemaker, “Changes in Physical Properties of Young and Old Vol- canic Surface Soils in Costa Rica after Clearing of Tropi- cal Rain Forest,” Hydrological Processes, Vol. 3, No. 4, 1989, pp. 383-392. doi:10.1002/hyp.3360030409 [48] L. P. Wilding and L. R. Drees, “Spatial Variability and Pedology,” In: L. P. Wilding, N. E. Smeck and G. F. Hall, Eds., Pedogenesis and Soil Taxonomy I: Concepts and Interactions, Elsevier, Amsterdam, 1983, pp. 83-116.
|