Paper Menu >>
Journal Menu >>
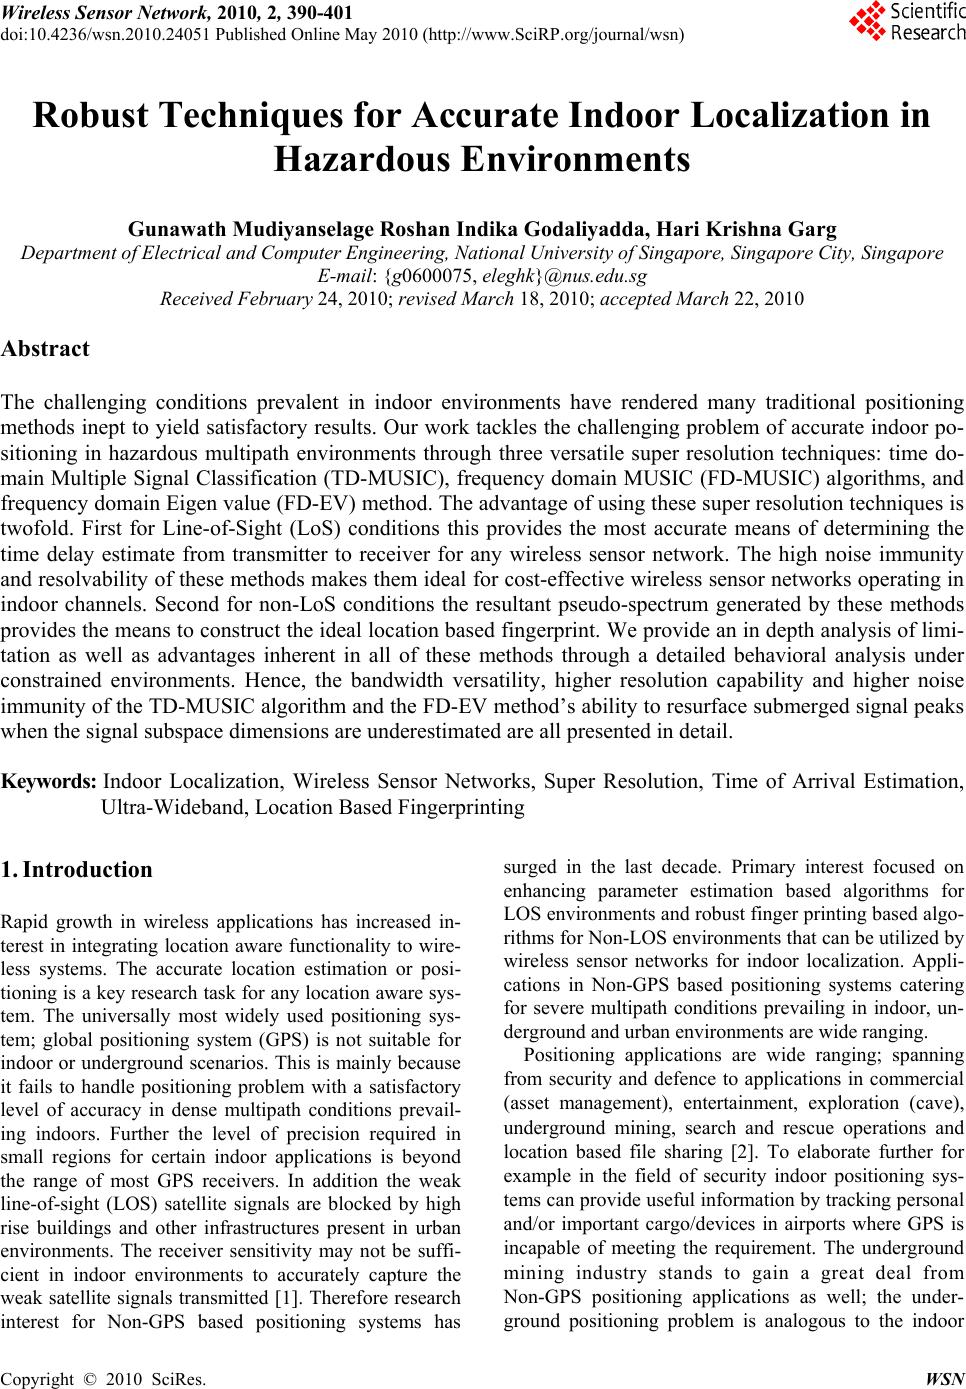 Wireless Sensor Network, 2010, 2, 390-401 doi:10.4236/wsn.2010.24051 Published Online May 2010 (http://www.SciRP.org/journal/wsn) Copyright © 2010 SciRes. WSN Robust Techniques for Accurate Indoor Localization in Hazardous Environments Gunawath Mudiyanselage Roshan Indika Godaliyadda, Hari Krishna Garg Department of Electrical and Computer Engineering, National University of Singapore, Singapore City, Singapore E-mail: {g0600075, eleghk}@nus.edu.sg Received February 24, 2010; revised March 18, 2010; acce pted M arch 22, 2010 Abstract The challenging conditions prevalent in indoor environments have rendered many traditional positioning methods inept to yield satisfactory results. Our work tackles the challenging problem of accurate indoor po- sitioning in hazardous multipath environments through three versatile super resolution techniques: time do- main Multiple Signal Classification (TD-MUSIC), frequency domain MUSIC (FD-MUSIC) algorithms, and frequency domain Eigen value (FD-EV) method. The advantage of using these super resolution techniques is twofold. First for Line-of-Sight (LoS) conditions this provides the most accurate means of determining the time delay estimate from transmitter to receiver for any wireless sensor network. The high noise immunity and resolvability of these methods makes them ideal for cost-effective wireless sensor networks operating in indoor channels. Second for non-LoS conditions the resultant pseudo-spectrum generated by these methods provides the means to construct the ideal location based fingerprint. We provide an in depth analysis of limi- tation as well as advantages inherent in all of these methods through a detailed behavioral analysis under constrained environments. Hence, the bandwidth versatility, higher resolution capability and higher noise immunity of the TD-MUSIC algorithm and the FD-EV method’s ability to resurface submerged signal peaks when the signal subspace dimensions are underestimated are all presented in detail. Keywords: Indoor Localization, Wireless Sensor Networks, Super Resolution, Time of Arrival Estimation, Ultra-Wideband, Location Based Fingerprinting 1. Introduction Rapid growth in wireless applications has increased in- terest in integrating location aware functionality to wire- less systems. The accurate location estimation or posi- tioning is a key research task for any location aware sys- tem. The universally most widely used positioning sys- tem; global positioning system (GPS) is not suitable for indoor or underground scenarios. This is mainly because it fails to handle positioning problem with a satisfactory level of accuracy in dense multipath conditions prevail- ing indoors. Further the level of precision required in small regions for certain indoor applications is beyond the range of most GPS receivers. In addition the weak line-of-sight (LOS) satellite signals are blocked by high rise buildings and other infrastructures present in urban environments. The receiver sensitivity may not be suffi- cient in indoor environments to accurately capture the weak satellite signals transmitted [1]. Therefore research interest for Non-GPS based positioning systems has surged in the last decade. Primary interest focused on enhancing parameter estimation based algorithms for LOS environments and robust finger printing based algo- rithms for Non-LOS environments that can be utilized by wireless sensor networks for indoor localization. Appli- cations in Non-GPS based positioning systems catering for severe multipath conditions prevailing in indoor, un- derground and urban environments are wide ranging. Positioning applications are wide ranging; spanning from security and defence to applications in commercial (asset management), entertainment, exploration (cave), underground mining, search and rescue operations and location based file sharing [2]. To elaborate further for example in the field of security indoor positioning sys- tems can provide useful information by tracking personal and/or important cargo/devices in airports where GPS is incapable of meeting the requirement. The underground mining industry stands to gain a great deal from Non-GPS positioning applications as well; the under- ground positioning problem is analogous to the indoor 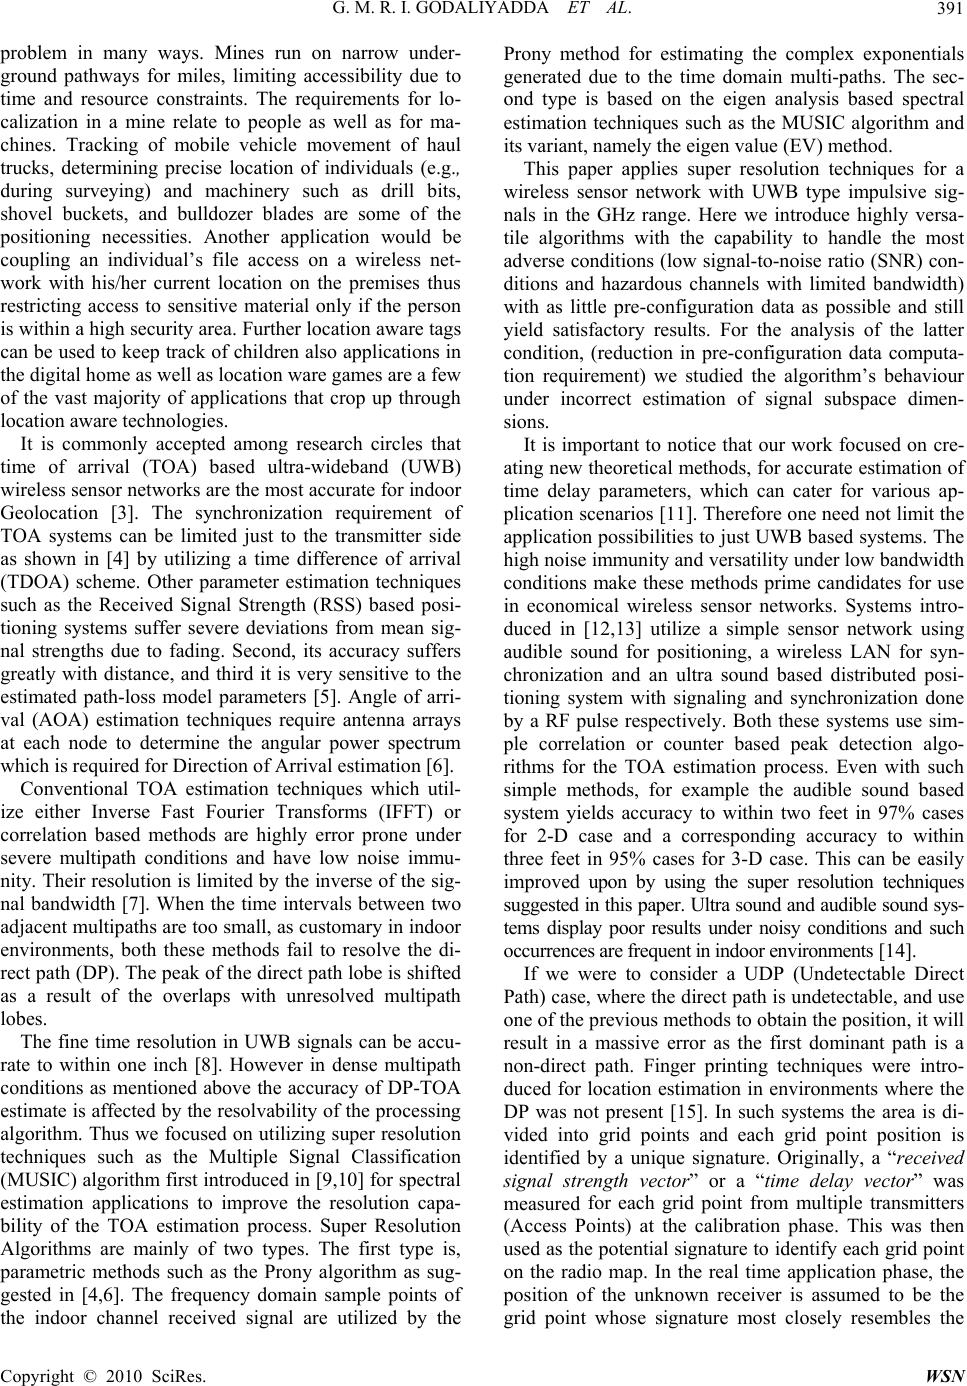 G. M. R. I. GODALIYADDA ET AL.391 problem in many ways. Mines run on narrow under- ground pathways for miles, limiting accessibility due to time and resource constraints. The requirements for lo- calization in a mine relate to people as well as for ma- chines. Tracking of mobile vehicle movement of haul trucks, determining precise location of individuals (e.g., during surveying) and machinery such as drill bits, shovel buckets, and bulldozer blades are some of the positioning necessities. Another application would be coupling an individual’s file access on a wireless net- work with his/her current location on the premises thus restricting access to sensitive material only if the person is within a high security area. Further location aware tags can be used to keep track of children also applications in the digital home as well as location ware games are a few of the vast majority of applications that crop up through location aware technologies. It is commonly accepted among research circles that time of arrival (TOA) based ultra-wideband (UWB) wireless sensor networks are the most accurate for indoor Geolocation [3]. The synchronization requirement of TOA systems can be limited just to the transmitter side as shown in [4] by utilizing a time difference of arrival (TDOA) scheme. Other parameter estimation techniques such as the Received Signal Strength (RSS) based posi- tioning systems suffer severe deviations from mean sig- nal strengths due to fading. Second, its accuracy suffers greatly with distance, and third it is very sensitive to the estimated path-loss model parameters [5]. Angle of arri- val (AOA) estimation techniques require antenna arrays at each node to determine the angular power spectrum which is required for Direction of Arrival estimation [6]. Conventional TOA estimation techniques which util- ize either Inverse Fast Fourier Transforms (IFFT) or correlation based methods are highly error prone under severe multipath conditions and have low noise immu- nity. Their resolution is limited by the inverse of the sig- nal bandwidth [7]. When the time intervals between two adjacent multipaths are too small, as customary in indoor environments, both these methods fail to resolve the di- rect path (DP). The peak of the direct path lobe is shifted as a result of the overlaps with unresolved multipath lobes. The fine time resolution in UWB signals can be accu- rate to within one inch [8]. However in dense multipath conditions as mentioned above the accuracy of DP-TOA estimate is affected by the resolvability of the processing algorithm. Thus we focused on utilizing super resolution techniques such as the Multiple Signal Classification (MUSIC) algorithm first introduced in [9,10] for spectral estimation applications to improve the resolution capa- bility of the TOA estimation process. Super Resolution Algorithms are mainly of two types. The first type is, parametric methods such as the Prony algorithm as sug- gested in [4,6]. The frequency domain sample points of the indoor channel received signal are utilized by the Prony method for estimating the complex exponentials generated due to the time domain multi-paths. The sec- ond type is based on the eigen analysis based spectral estimation techniques such as the MUSIC algorithm and its variant, namely the eigen value (EV) method. This paper applies super resolution techniques for a wireless sensor network with UWB type impulsive sig- nals in the GHz range. Here we introduce highly versa- tile algorithms with the capability to handle the most adverse conditions (low signal-to-noise ratio (SNR) con- ditions and hazardous channels with limited bandwidth) with as little pre-configuration data as possible and still yield satisfactory results. For the analysis of the latter condition, (reduction in pre-configuration data computa- tion requirement) we studied the algorithm’s behaviour under incorrect estimation of signal subspace dimen- sions. It is important to notice that our work focused on cre- ating new theoretical methods, for accurate estimation of time delay parameters, which can cater for various ap- plication scenarios [11]. Therefore one need not limit the application possibilities to just UWB based systems. The high noise immunity and versatility under low bandwidth conditions make these methods prime candidates for use in economical wireless sensor networks. Systems intro- duced in [12,13] utilize a simple sensor network using audible sound for positioning, a wireless LAN for syn- chronization and an ultra sound based distributed posi- tioning system with signaling and synchronization done by a RF pulse respectively. Both these systems use sim- ple correlation or counter based peak detection algo- rithms for the TOA estimation process. Even with such simple methods, for example the audible sound based system yields accuracy to within two feet in 97% cases for 2-D case and a corresponding accuracy to within three feet in 95% cases for 3-D case. This can be easily improved upon by using the super resolution techniques suggested in this paper. Ultra sound and audible sound sys- tems display poor results under noisy conditions and such occurrences are frequent in indoor environments [14]. If we were to consider a UDP (Undetectable Direct Path) case, where the direct path is undetectable, and use one of the previous methods to obtain the position, it will result in a massive error as the first dominant path is a non-direct path. Finger printing techniques were intro- duced for location estimation in environments where the DP was not present [15]. In such systems the area is di- vided into grid points and each grid point position is identified by a unique signature. Originally, a “received signal strength vector” or a “time delay vector” was measured for each grid point from multiple transmitters (Access Points) at the calibration phase. This was then used as the potential signature to identify each grid point on the radio map. In the real time application phase, the position of the unknown receiver is assumed to be the grid point whose signature most closely resembles the Copyright © 2010 SciRes. WSN 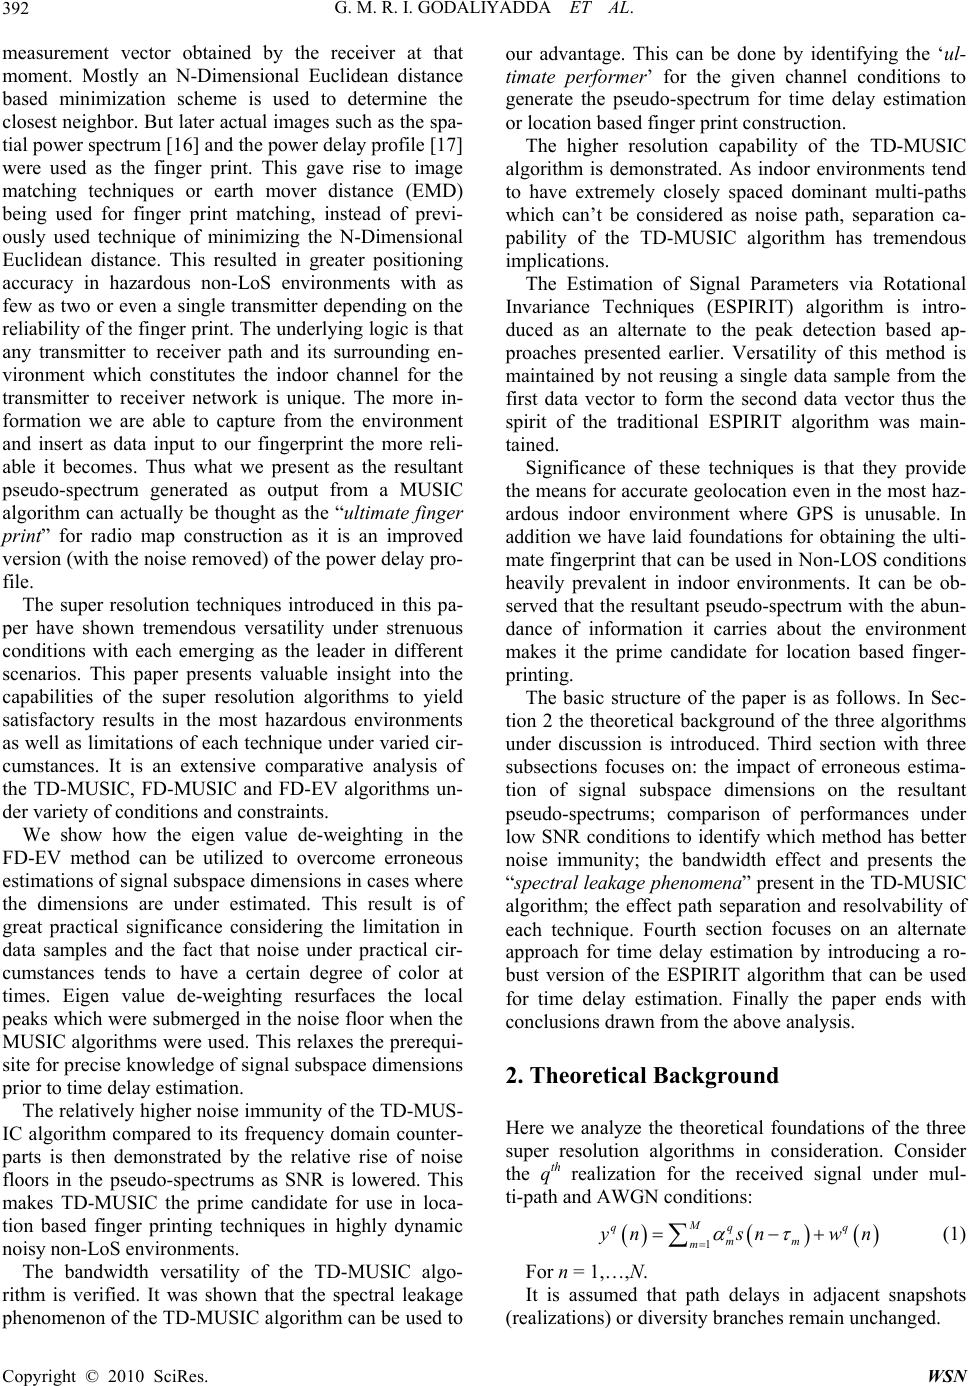 G. M. R. I. GODALIYADDA ET AL. 392 q measurement vector obtained by the receiver at that moment. Mostly an N-Dimensional Euclidean distance based minimization scheme is used to determine the closest neighbor. But later actual images such as the spa- tial power spectrum [16] and the power delay profile [17] were used as the finger print. This gave rise to image matching techniques or earth mover distance (EMD) being used for finger print matching, instead of previ- ously used technique of minimizing the N-Dimensional Euclidean distance. This resulted in greater positioning accuracy in hazardous non-LoS environments with as few as two or even a single transmitter depending on the reliability of the finger print. The underlying logic is that any transmitter to receiver path and its surrounding en- vironment which constitutes the indoor channel for the transmitter to receiver network is unique. The more in- formation we are able to capture from the environment and insert as data input to our fingerprint the more reli- able it becomes. Thus what we present as the resultant pseudo-spectrum generated as output from a MUSIC algorithm can actually be thought as the “ultimate finger print” for radio map construction as it is an improved version (with the noise removed) of the power delay pro- file. The super resolution techniques introduced in this pa- per have shown tremendous versatility under strenuous conditions with each emerging as the leader in different scenarios. This paper presents valuable insight into the capabilities of the super resolution algorithms to yield satisfactory results in the most hazardous environments as well as limitations of each technique under varied cir- cumstances. It is an extensive comparative analysis of the TD-MUSIC, FD-MUSIC and FD-EV algorithms un- der variety of conditions and constraints. We show how the eigen value de-weighting in the FD-EV method can be utilized to overcome erroneous estimations of signal subspace dimensions in cases where the dimensions are under estimated. This result is of great practical significance considering the limitation in data samples and the fact that noise under practical cir- cumstances tends to have a certain degree of color at times. Eigen value de-weighting resurfaces the local peaks which were submerged in the noise floor when the MUSIC algorithms were used. This relaxes the prerequi- site for precise knowledge of signal subspace dimensions prior to time delay estimation. The relatively higher noise immunity of the TD-MUS- IC algorithm compared to its frequency domain counter- parts is then demonstrated by the relative rise of noise floors in the pseudo-spectrums as SNR is lowered. This makes TD-MUSIC the prime candidate for use in loca- tion based finger printing techniques in highly dynamic noisy non-LoS environments. The bandwidth versatility of the TD-MUSIC algo- rithm is verified. It was shown that the spectral leakage phenomenon of the TD-MUSIC algorithm can be used to our advantage. This can be done by identifying the ‘ul- timate performer’ for the given channel conditions to generate the pseudo-spectrum for time delay estimation or location based finger print construction. The higher resolution capability of the TD-MUSIC algorithm is demonstrated. As indoor environments tend to have extremely closely spaced dominant multi-paths which can’t be considered as noise path, separation ca- pability of the TD-MUSIC algorithm has tremendous implications. The Estimation of Signal Parameters via Rotational Invariance Techniques (ESPIRIT) algorithm is intro- duced as an alternate to the peak detection based ap- proaches presented earlier. Versatility of this method is maintained by not reusing a single data sample from the first data vector to form the second data vector thus the spirit of the traditional ESPIRIT algorithm was main- tained. Significance of these techniques is that they provide the means for accurate geolocation even in the most haz- ardous indoor environment where GPS is unusable. In addition we have laid foundations for obtaining the ulti- mate fingerprint that can be used in Non-LOS conditions heavily prevalent in indoor environments. It can be ob- served that the resultant pseudo-spectrum with the abun- dance of information it carries about the environment makes it the prime candidate for location based finger- printing. The basic structure of the paper is as follows. In Sec- tion 2 the theoretical background of the three algorithms under discussion is introduced. Third section with three subsections focuses on: the impact of erroneous estima- tion of signal subspace dimensions on the resultant pseudo-spectrums; comparison of performances under low SNR conditions to identify which method has better noise immunity; the bandwidth effect and presents the “spectral leakage phenomena” present in the TD-MUSIC algorithm; the effect path separation and resolvability of each technique. Fourth section focuses on an alternate approach for time delay estimation by introducing a ro- bust version of the ESPIRIT algorithm that can be used for time delay estimation. Finally the paper ends with conclusions drawn from the above analysis. 2. Theoretical Background Here we analyze the theoretical foundations of the three super resolution algorithms in consideration. Consider the qth realization for the received signal under mul- ti-path and AWGN conditions: 1 M qq mm m y nsnw n (1) For n = 1,…,N. It is assumed that path delays in adjacent snapshots (realizations) or diversity branches remain unchanged. Copyright © 2010 SciRes. WSN 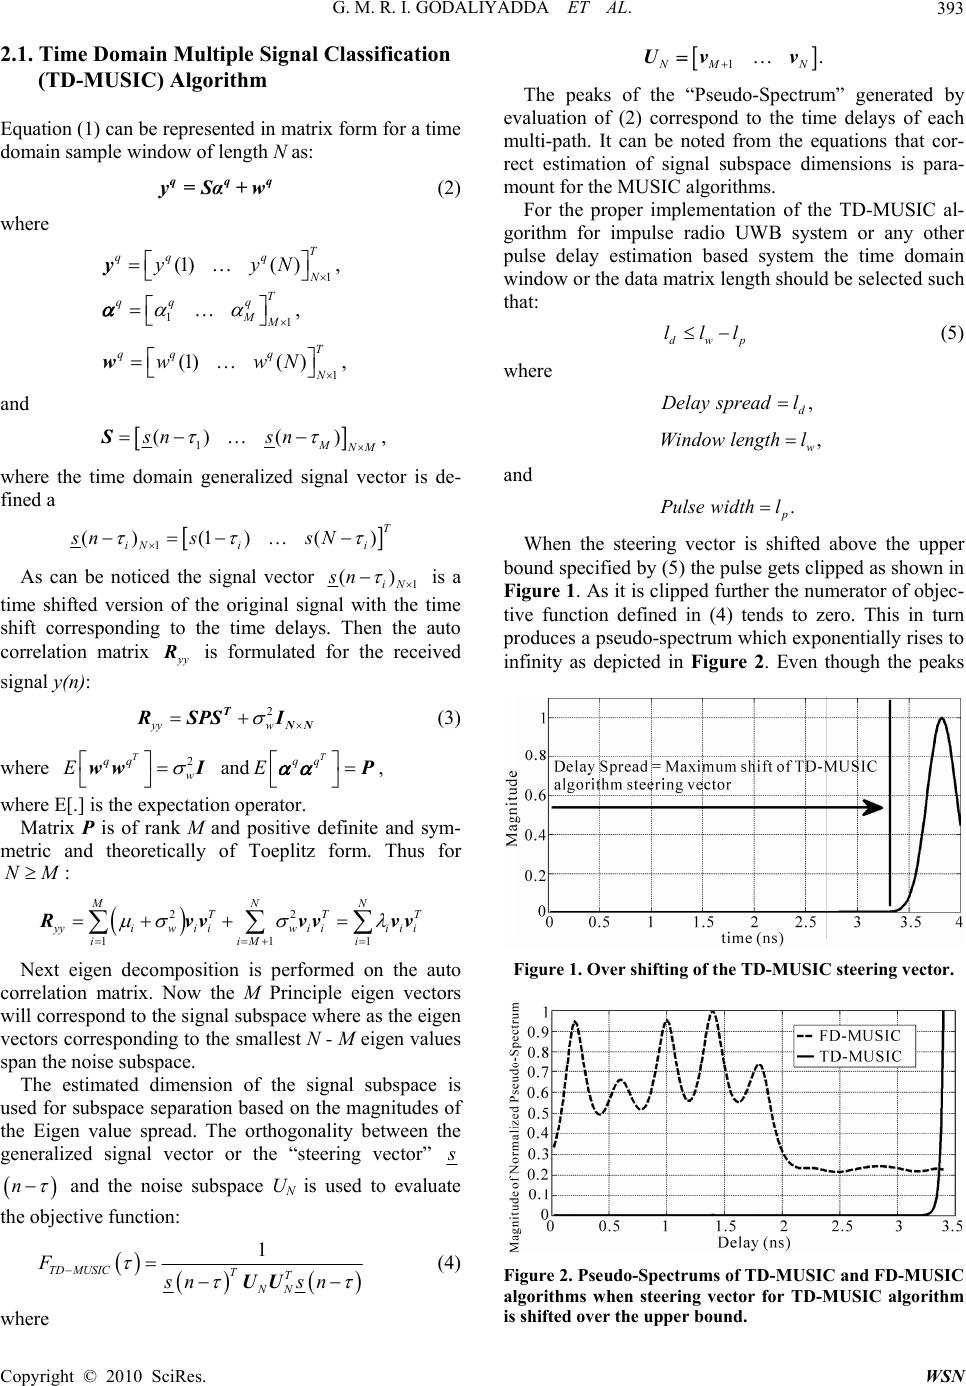 G. M. R. I. GODALIYADDA ET AL.393 q 2.1. Time Domain Multiple Signal Classification (TD-MUSIC) Algorithm Equation (1) can be represented in matrix form for a time domain sample window of length N as: qq y=Sα+w (2) where 1 (1)( ,)T qq q N yyN y 11, T qq q MM 1 (1)( ,)T qq q N wwN w and 1 ()( ) MNM sn sn S, where the time domain generalized signal vector is de- fined a 1 ()(1)( ) T iN ii ns sNs As can be noticed the signal vector 1 () iN sn is a time shifted version of the original signal with the time shift corresponding to the time delays. Then the auto correlation matrix is formulated for the received signal y(n): yy R 2 yy w T NN RSPSI (3) where 2 T qq w E ww I andT qq E P , where E[.] is the expectation operator. Matrix P is of rank M and positive definite and sym- metric and theoretically of Toeplitz form. Thus for :NM 22 11 MN TT 1 N T y yiw iiwiiiii iiMi Rvvvv vv Next eigen decomposition is performed on the auto correlation matrix. Now the M Principle eigen vectors will correspond to the signal subspace where as the eigen vectors corresponding to the smallest N - M eigen values span the noise subspace. The estimated dimension of the signal subspace is used for subspace separation based on the magnitudes of the Eigen value spread. The orthogonality between the generalized signal vector or the “steering vector” s n and the noise subspace UN is used to evaluate the objective function: 1 TD MUSICTT NN Fsn sn UU (4) 1. NM NUv v The peaks of the “Pseudo-Spectru” generated by ev p m aluation of (2) correspond to the time delays of each multi-path. It can be noted from the equations that cor- rect estimation of signal subspace dimensions is para- mount for the MUSIC algorithms. For the proper implementation of the TD-MUSIC al- gorithm for impulse radio UWB system or any other pulse delay estimation based system the time domain window or the data matrix length should be selected such that: dw lll (5) where and When the steering vector is shifted above the upper bo , d Delay spreadl , w Window lengthl . p Pulse widthl und specified by (5) the pulse gets clipped as shown in Figure 1. As it is clipped further the numerator of objec- tive function defined in (4) tends to zero. This in turn produces a pseudo-spectrum which exponentially rises to infinity as depicted in Figure 2. Even though the peaks Figure 1. Over shifting of the TD-MUSIC steering vector. Figure 2. Pseudo-Spectrums of TD-MUSIC and FD-MUSIC algorithms when steering vector for TD-MUSIC algorithm is shifted over the upper bound . where Copyright © 2010 SciRes. WSN  G. M. R. I. GODALIYADDA ET AL. 394 e data ect Following similar analysis as was done for TD-MUSIC algorithm with the only difference being that th is do that correspond to the multi-paths are produced by the TD-MUSIC algorithm at correct locations, for delay values above the upper bound specified by (5) the mag- nitude of the pseudo-spectrum rapidly rises to infinity thereby making the local peaks negligible. Therefore the window length should be selected according to the con- dition specified in (5). Cyclic wraparound for the steer- ing vector is not possible as it creates a false sense of periodicity as well as gives rise to initial ambiguity problems similar to the ones present in GPS systems. 2.2. Frequency Domain Multiple Signal Classification (FD-MUSIC) Algorithm By considering the Fourier transform of (1) as th or: v 2 1 m Mjf qq m m YfSfe wf (6) e analysis ne in the frequency domain we can define the steer- ing vector and objective function as below for the FD- MUSIC algorithm: 1 2 1i jf i Sfe s 2 1 , ki jf kk Sf e and 1 FD MUSICHH iNNi Fss UU (7) 2.3. Frequency Domain Eigen Value (FD-EV) Method m, n ede-weighting was first suggested in [18] To rspurious nature of the pseudo-spectrueduce the igen value a for the evaluation of the objective function as given below: 1 1 FD F 1 EV HNH ikki kM k sv vs It is worthwhile to mention that for the first ti eigen value de-weighting process was identified to have an (8) me the additional benefit under our study. It provided means of correctly resolving all multipaths for cases where the number of signal subspace dimensions was underesti- mated. Detailed analysis of results will appear in later sections. Figure 3 summarizes the basic steps involved in the procedure. Figure 3. Flow chart of basic super resolution TOA estima- tion algorithm. trums’ as s as well the “actual shape” of the pseudo-spectrum is put under 3. Results of the Behavioral Analysis The analysis relies on the use of ‘Pseudo-Spec the final output. The placement of the local peak as scrutiny. This enables even the minute changes in shape of the pseudo-spectrum to be captured under changes in certain variables. In practical applications even when the theoretical peaks are placed correctly due to the pseu- do-spectrum shape not being pronounced enough at the local peaks, obtaining the local maxima in a peak detec- tion process maybe tedious and error prone. In addition resultant pseudo-spectrums are to be explored as possible location based fingerprints for radio map construction. This places even more importance on shape of the pseudo-spectrum than if we were to utilize it as a mere time delay estimation tool. Normalization was done as below for comparative analysis among the algorithms. By defining the normalization as below it is ensured that no shape deformation takes place due to normalization. max NORM F FF (9) 3.1. Impact of Erroneous Estimat Dimensions olut is the number of multi-path compo- ents (M). Theoretically ‘M’ is obtained via the ACM. ion of Subspace A critical parameter in TOA estimation using super res- ion techniques n The eigen decomposition of yy R yields an Eigen spread of N eigen values. From these the smallest (N – M) eigen values are all equal to 2 w , thise power spectral den- sity. The larger M eigen values correspond to the number of signal multipath components, thus enabling us to sep- arate the signal eigen vectors from the noise eigen vec- tors. In practice when a limited number of data samples are available, and the noise has a certain degree of color, the noise eigen values tend to be all different, making it difficult to obtain M easily using the above approach. e no Copyright © 2010 SciRes. WSN  G. M. R. I. GODALIYADDA ET AL.395 ria sp Therefore researchers have looked for alternate meth- ods to determine M with better accuracy. For example the Rissanen minimum descriptive length (MDL) crite ecified in [19] is such a method. The MDL criterion for estimation of ‘M’ is given by 1 12, 2 i L i ik Lk kL klogM where 1 1 log log1 WLk LLk ik MDL k 01 iiL ion matrix are in etermined by the v , the eigen vales of the auto correlat descending order. The value of R conditi ation of e dimensions are underestimated as two. D tions. What was most interesting to no addition for scenarios where the signal subspace dimen- M is dalue [0, 1]kL which mi- nimizes the MDL. This can be computationally extensive and moreover does not guarantee 100% accuracy. Given sound bandwidth and SNons the FD- EV method is able to resolve all multi-paths correctly even in case where there is an erroneous underestim signal subspace dimensions. This relaxes the accuracy requirement for estimation of M considerably for most practical scenarios. In addition this can be used as a check to verify whether the estimation of M was done properly prior to running the MUSIC algorithms. In our simulation we used a case where 5 dominant signal paths are present at equi-distances. This was done under sound bandwidth (above 4 GHz) and SNR (above 5 dB) condi- tions. It is important to note that we have assumed the minimum separation between two dominant multi-paths to be 0.4 ns for a pulse width of roughly 1 ns. The versa- tility of each method with respect to noise, spectral leakage, bandwidth, and path separation is analyzed in later sections. As illustrated in Figure 4 the MUSIC algorithms fails to resolve the five dominant multi-paths present when signal subspac ue to the eigen value de-weighting in the FD-EV me- thod; the ‘submerged local peak s of the p seudo-sp ectrum corresponding to the dominant multi-paths resurface above the noise floor’. The impact of estimated signal subspace dimensions on the obtained ‘delay profile sig- nature’ are further highlighted in Figures 5-7 where pseudo-spectrum changes for each method is mapped separately for variation of signal subspace dimensions from zero to five. As expected only the FD-EV method pseudo-spectrum was not affected considerably by the signal subspace dimension fluctua te was that FD-EV was able to resolve multipaths to a reasonable degree of accuracy even without a subspace separation. As the SNR, bandwidth and dimensions were lowered, the accuracy of the peak locations declined. In sions were over estimated from 5 to 100 (for same chan- nel conditions) all methods were able to identify five dominant paths correctly. Yet the MUSIC algorithms showed no signs of pseudo-spectrum shape changes or peak location fluctuations as the signal subspace dimensions Figure 4. Comparison of normalized pseudo-spectrums when number of signal vectors is under estimated as 2. (For sound BW and SNR conditions). Figure 5. Variation of normalized pseudo-spectrums for FD-MUSIC algorithm when signal subspace dimensions are varied from 0 to 5. Figure 6. Variation of normalized pseudo-spectrums for FD-EV algorithm when signal subspace dimensions are varied from 0 to 5. Copyright © 2010 SciRes. WSN  G. M. R. I. GODALIYADDA ET AL. 396 Figure 7. Variation of normalized pseudo-spectrums for TD-MUSIC algorithm when signal subspace dimensions are varied from 0 to 5. were increased over 5. In fact the normalized MUSIC algorithms pseudo-spectrums were near identical under the said variations. The FD-EV method however dis- played a shape and peak placement fluctuation (see Fig- ure 8). It can further be stated that this fluctuation is similar to the random variations displayed by the FD-EV method in Figure 10 when signal sub space dimensions were under estimated. The claim that the eigen value de-weighting renders the FD-EV method unable to co- herently respond to signal subspace dimension variations is further reinforced. Sound bandwidth and SNR condi- tions were maintained to isolate variations occurring due oise sed systems the ise separation capability is an accurate multi path profile of e transmitter to receiver channel. The noise maybe the ec- tiv to signal subspace dimension variations. 3.2. Impact of N The impact SNR conditions have on the pseudo-spectrum ‘shape’ and ability of the algorithm to resolve the mul- ti-paths under low SNR conditions is a measurement of the method’s ‘noise immunity’. Noise immunity be- comes the underlying criterion for selection if we were to use less expensive signaling techniques such as ultra sound or audible sound for positioning applications. For example it is stated in [14] that broadband as well as narrowband ultrasound positioning systems display poor performance under ultrasonic noise which occurs due to people’s everyday actions as they employ simple corre- lator based techniques for time of flight estimation. On the other hand even for UWB ba signal processing tool’s no essential for generating th result of interfering dynamic scatterers present at the real-time application stage which were absent during the calibration stage of a location based fingerprinting posi- tioning system. The accurate multi-path profile in turn can be used as the most accurate means of obtaining a ‘location based fingerprint’ for localization on a radio map for non-LoS scenarios. First we will consider (in Figure 9) a pseudo-spectrum obtained at good SNR (around 10 dB) as a control for comparison. In addition good bandwidth (above 4 GHz) and correct estimation of signal subspace dimensions (= 5) are assumed. Now the SNR is lowered to 1 dB and -5 dB resp ely in Figures 10 and 11. As can be observed the rela- tive rise in the noise floor in the frequency domain meth- ods verifies the better noise immunity of the TD-MUSIC Figure 8. Variation of normalized pseudo-spectrums for FD-EV algorithm when signal subspace dimensions are varied from 5 to 100. Figure 9. Comparison of pseudo-spectrums for SNR = 10 dB. Figure 10. Comparison of pseudo-spectrums for SNR = 1 dB. Copyright © 2010 SciRes. WSN  G. M. R. I. GODALIYADDA ET AL.397 Figure 11. Comparison of pseudo-spectrums for SNR = –5 dB. tion error prone, but also shifts the local peaks to incorrect locations. Thus making TD-MUSIC the prime candidate for high noise-low cost and Non-LOS location based finger printing applications. 3.3. Impact of Spectral Leakage and Bandwidth The versatility of each algorithm under varying effective channel bandwidth above noise floor was then tested. Figures 12-14 illustrate the shape deformation of the respective pseudo-spectrums when the bandwidth is var- ied. As can be noted from Figure 12, the TD-MUSIC e 2 GHz; and is able to resolve all five paths and stimate time delays accurately even under bandwidths for bandwidths below GHz as illustrated in Figure 14. This clearly illustrates algorithm. The relative rise in the noise floor not only makes the local peaks less pronounced thus making peak detec algorithm under goes hardly any shape deformation abov e below 2 GHz. Whereas the FD-MUSIC algorithm is only able to accurately resolve the multi-paths above a band- width of 3 GHz, even then it places the local peaks in- correctly as shown in Figure 13. The FD-EV method fares the worst when bandwidth is lowered as it is unable to resolve the multipaths correctly 5 the bandwidth versatility of the TD-MUSIC algorithm. It an clearly be observed how the local peaks become lessc and less pronounced for the frequency domain methods as bandwidth is lowered. Next in our analysis the steering vector sn pulse spread of the TD-MUSIC algorithms was varied. The shape deformations of the resultant pseudo-spectrums generated were analyzed. The algorithm which utilizes a steering vector whose pulse spread is varied by a (+/–) ‘x’ amount to evaluate the objective function defined in (4) was tagged as the (+/–: x) deviant of the TD-MUSIC algorithm in our terminology. It was observed for low bandwidths below 1.5 GHz for each channel condition there exists an ‘ultimate per- former’ that is not the original TD-MUSIC algorithm but a positive deviant of the algorithm. For each channel Figure 12. Variation of normalized pseudo-spectrums for TD-MUSIC algorithm under bandwidth change. Figure 13. Variation of normalized pseudo-spectrums for FD-MUSIC algorithm under bandwidth change. Figure 14. Variation of normalized pseudo-spectrums for FD-EV algorithm under bandwidth change. condition, there exists a modified version of the steer- ing vector, which best replicates the transmitted signal that was assumed to have been sent according to the TD- MUSIC algorithm’s point of view due to the spec- tral leakage effect. When the SNR is lowered or the signal subspace dimensions are erroneously estimated this behavior becomes even more apparent. This phe- nomena tagged the “Spectral leakage effect” exists due Copyright © 2010 SciRes. WSN  G. M. R. I. GODALIYADDA ET AL. 398 to noise leakage in the subspace separation phase. The leaked noise is accounted as part of the signal by the TD-MUSIC algorithm thereby expecting the transmit- ted signal to be a deviated version of the actual signal that was sent. This behavior can be utilized to our advantage as for bandwidth below 1.5 GHz the (+) deviants of the TD- MUSIC algorithm actually outperforms the original TD-MUSIC algorithm. In addition it was observed ear- lier that for this bandwidth range the frequency domain methods yield erroneous results. This is verified by Fig- ure 15 where it can clearly be seen that the (+2) deviant of the TD-MUSIC algorithm not only outperforms its frequency domain counterparts but also the original nd is one of the under- tion technique e TD-MUSIC algorithm as well. .4. Impact Due to Path Separation 3 A key criterion to be considered when determining the performance of any multi-path resolution techniques is its path resolvability itself. There can be many ap- proaches to determine which algorithm has the best res- olution. Our approach is to identify which method con- tinues to accurately resolve all multi-paths correctly when the path separation between two multi-paths is gradually decreased. To make sure other variables do not come into play in this study we have kept the effective bandwidth above the noise floor as well as the SNR itself at friendly levels. It was also assumed that the signal subspace dimensions were accurately estimated. It needs to be noted that an effective multi-path reso- lution comprises of two key steps. First the algorithm should be able to identify the existence of two separate signal paths. This is ensured when there is evidence of two separately identifiable peaks present in the resultant pseudo-spectrum. Secondly for the process to be deemed complete the peaks must be placed at the correct loca- tions corresponding to the relevant time delays. This is a fundamental criterion in resolution because as was stated earlier the ‘peak shift’ that takes place due to adjacent aths causes an estimation error ap lying reasons for opting to a super resolu n the first place. i The path separation between the second and the third peaks was varied for our analytical purposes. It was noted that for a path separation of 0.4 ns both MUSIC algorithms were able to resolve and place the local peaks correctly. The FD-EV method did resolve the paths but there was a slight error in the peak placement, thereby eliminating it as primary candidate for resolvability. Our earlier control experiment depicted in Figure 9 can be used to confirm this. As the path separation is lowered down to 0.3 ns it becomes clearly visible that the TD-MUSIC algorithm has the edge when it comes to path resolvability. Figure 16 demonstrates how the TD-MUSIC algorithm is th Figure 15. Comparison of pseudo-spectrums for channel BW of 1.25 GHz. Figure 16. Comparison of pseudo-spectrums for Path Se- paration of 0.3 ns. only one able to place the peaks correctly while on top of resolving them. Its frequency domain counter parts are only able to identify the existence of two separate peaks yet are unable to place them accurately at the correct delay points. Finally at 0.2 ns separation it can be observed from Figure 17 that only the TD-MUSIC algorithm is able to TD-MUSIC method is not only able to entify but also place the peaks at the correct locations while the other two methods cannot even detect two paths speaks volumes about its resolution capability. It should be further stated that the TD-MUSIC positive deviants (+1) and (+2) were also able to resolve both peaks under these conditions. 4. Espirit as a Tool for Toa Estimation In [20,21], the ESPIRIT algorithm was introduced as an alternative method to the MUSIC super resolution algo- rithm, in the direction of arrival estimation problems for array-based systems. It has the virtue of not relying on a peak detection process for parameter estimation. The resolve the two closely spaced paths. The fact that even at this point the id Copyright © 2010 SciRes. WSN  G. M. R. I. GODALIYADDA ET AL.399 Figure 17. Comparison of pseudo-spectrums for path sepa- ration of 0.2 ns. downside is that it can only be used in an impulsive re- onse case or if the signal spectrumsp is flat in the fre- ccurate can’t enerate the visual output that is required for a delay quency sampling region. In addition it isn’t as a n estimation tool as the MUSIC algorithms anda g profile based fingerprint. Here a versatile form of the ESPIRIT algorithm was suggested as a possible alterna- tive for TOA estimation. This was done by making sure that the data vectors, Xand Y, were constructed by using odd and even frequency samples from the impulse response spectra thus making sure none of the data sam- ples used for X were reused for Y relations . Defining the data vectors as such guarantees the hip specified be- tween XX C and XY C in [21] when the original ESPI- RIT algorithm was formulated. This is proven below. This confirms that the suggested method below is in the same spirit as the original ESPIRIT algorithm, with the displacement between the two identical subarray systems equated to a frequency shift in our method. Consider channel impulse response as: 1 p L kk hta t 0k where . k j kk ae The Fourier transform of ht is 0 pk k k Hf ae 12 Ljf . Let the received signal be: Δ() o X fnfxn , and consider the number of sample points L to be even. Let us define the data vectors 1 2 13 1 T L Xx xxL (10) and 1 2 24 T L xxYL (11) Thus, the qth realization of the data vector X can be written as, . qqq odd aXVW (12) where x 01 0 0 2Δ 2Δ 23Δ L oP o 0 1 000 1 23Δ 2L -1Δ2L1Δ 2 , L P LP jff jff jf f ee e p jf f jf fjff LL e ee V 1 01 p T LL aa a 1 P a, and 1 2 13 1. T L odd ww wL W Similarly as above data vector Y can be as expressed qqq even YV aW (13) where 0 e Y 1 p PP LL 2Δ 2Δ 0 , 0L jf jf e and 1 2 13 1 T L even wwwL . W Thus, the two correlation matrices are of the form: , H qq H XY H E RXYAVV and 2 H qq H w XX E R XX VAVI where . Now taking the covariance: []EqqH Aaa 2 w XX H XX CR IVAV (14) and H XY Y H X VCRAV (15) As the matrices and a 0,21] using tnergen Vectors of the Matrix Pencil XX C he Ge XY C alized Ei re of the same form as in [2 , XX XY CC e delay parameters can be obtained. To meet this end a total least squares the tim Copyright © 2010 SciRes. WSN  G. M. R. I. GODALIYADDA ET AL. 400 (TLS) approach can be used as suggested in [20]. TLS- ESPIRIT approach for obtaining DOA parameters can be used by constructing . T Y ZX ate solution to th This can be con- sidered as an alterne MUSIC algorithm peak detection is deemed too complex for a pa- ter estimation based positioning system to be used in an LOS environment. 5. In this paper we have conducted an in detaivioral super resolution techniques under varied en- ments to identify the strengths and limits of these techniques. In addition to the advantages these methods offer compared to the traditional time delay estimation techniques, it was concluded that each method has its ues. The eige-EV method enables it to resurface multi-paths that submerged in the noise floor when t used. The TD-MUSIC algorithm emerged as der in terms of noise immunity. The spectral lea- kage in the TD-MUSIC algorithm vantage at low bandwidths to yield better result m steecto idate for use his research is supported by a research grant from f Singapore, grant number: R-263- 00-436-112. arevic, K. Witrisal and Z. Irahhauten, “Analysis of a UWB Indoor Positioning Signal Strength,” Proceedings ing, Navigation and Com- LAN Systems Using Prony Algorithm,” Pro- ceedings of 4th Workshop on Positioning, Navigation and n (WPNC’07), Hannover, 22 March 2007, ,” Proceedings of -1419. r Positioning Sys- itous Computing Environment,” Proceedings of s on Mobile Computing, Vol. 5, No. 5, May dio Com- when rame Conclusions l beha analysis of viron own virtn value de-weighting of the FD were [7] A. H. Quazi, “An Overview on the Time Delay Estimate in Active and Passive Systems for Target Localization,” IEEE Transactions on Acoustics, Speech & Signal Proc- essing, Vol. 29, No. 3, June 1981, pp. 527-533. [8] C. D. Wann and S. H. Hsu, “Estimation and Analysis of Signal Arrival Time for UWB Systems he MUSIC algo- rithms were the lea was used to our ad- s by IEEE 60th Vehicular Technology Conference (VTC’04), Los Angeles, Vol. 5, 26-29 September 2004, pp. 3560- 3564. odifications to thering ver. The versatility of the TD-MUSIC algorithm under bandwidth fluctuations was confirmed. The TD-MUSIC algorithms ability to resolve extremely closely spaced adjacent multi-paths was proven. An ESPIRIT model was presented for time delay estimation without a peak detection process. The resul- tant pseudo-spectrum of the MUSIC algorithm was iden- tified as the prime candas a location based fingerprint in Non-LOS conditions. 6. Acknowledgements T Na- tional University o tems Using Audible Sound,” Proceedings of 2nd IEEE Consumer Communication and Networking Conference (CCNC’05), Las Vegas, 3-6 January 2005, pp. 348-353. [13] Y. Fukuju, M. Minami, H. Morikawa and T. Aoyama, “DOLPHIN: An Autonomous Indoor Positioning System in Ubiqu 0 7. References [1] I. F. Progri, W. Ortiz, W. R. Michalson and J. Wang, “The Performance and Simulation of an OFDMA Pseu- dolite Indoor Geolocation System,” Proceedings of 19th International Technical Meeting of the Satellite Division of the Institute of Navigation (ION GNSS’06), Fort Worth, 25-26 September 2006, pp. 3149-3162. [2] K. Pahlavan, X. Li and J. P. Makela, “Indoor Geolocation Science and Technology,” IEEE Communications Maga- zine, Vol. 40, No. 2, February 2002, pp. 112-118. [3] B. Alavi and K. Pahlavan, “Analysis of Undetected Di- rect Path in Time of Arrival Based UWB Indoor Geolo- cation,” Proceedings of IEEE 62nd Vehicular Technology Conference (VTC’05), Dallas, Vol. 4, 25-28 September 2005, pp. 2627-2631. [4] D. Cyganski, J. Orr and W. R. Michalson, “A Mul- ti-Carrier Technique for Precision Geolocation for In- door/Multipath Environments,” Proceedings of 16th In- ternational Technical Meeting of the Satellite Division of the Institute of Navigation (ION GPS/GNSS), Portland, 9-12 September 2003, pp. 1069-1073. 5] T. Gigl, G. J. M. Janssen, V. Dizd[ System Based on Received of 4th Workshop on Position munication (WPNC’07), Hannover, 22 March 2007, pp. 97-101. [6] I. A. Ibraheem and J. Schoebel, “Time of Arrival Predic- tion for W Communicatio pp. 29-32. [9] S. L. Marple, “Digital Spectral Analysis with Applications,” Prentice-Hall, Englewood Cliffs, 1987. [10] S. M. Kay and S. L. Marple, “Spectrum Analysis – A Modern Perspective,” Proceedings of the IEEE, Vol. 69, No. 11, 1981, pp. 1380 [11] G. M. R. I. Godaliyadda and H. K. Garg, “Versatile Al- gorithms for Accurate Indoor Geolocation,” Proceedings of 16th International Conference on Digital Signal Proc- essing (DSP’09), Santorini, 5-7 July 2009, pp. 1115-1120. [12] A. Mandal, C. V. Lopes, T. Givargis, A. Haghighat, R. Jurdak and P. Baldi, “Beep: 3D Indoo IEEE Workshop on Software Technologies for Future Embedded Systems, Hakodate, 15-16 May 2003, pp. 53-56. [14] M. Hazas and A. Hopper, “Broadband Ultrasonic Loca- tion Systems for Improved Indoor Positioning,” IEEE Transaction 2006, pp. 536-547. [15] M. Kanaan and K. Pahlavan, “CN-TOAG: A New Algo- rithm for Indoor Geolocation,” Proceedings of 15th IEEE Symposium on Personal, Indoor and Mobile Ra munications (PIMRC’04), Barcelona, Vol. 3, 5-8 Sep- tember 2004, pp. 1906-1910. [16] K. Sayrafian-Pour and D. Kaspar, “Indoor Positioning Using Spatial Power Spectrum,” Proceedings of 16th Copyright © 2010 SciRes. WSN  G. M. R. I. GODALIYADDA ET AL. Copyright © 2010 SciRes. WSN 401 ymposium on Personal, Indoor and Mobile PRIT-Estimation of Signal otation Methods – ESPRIT,” IEEE Inter- IEEE SRadio [19] M. Wax and T. Kailath, “Detection of Signals by Infor- mation Theoretic Criteria,” IEEE Transactions on Acous- tics, Speech & Signal Pro cessing , Vol. 33, No. 2, April 1985, pp. 387-392. [20] R. Roy and T. Kailath, “ES Communications (PIMRC’05), Berlin, Vol. 4, 11-14 Sep- tember 2005, pp. 2722-2726. [17] A. Chehri, P. Fortier and P. M. Tardif, “Geolocation for UWB Networks in Underground Mines,” Proceedings of IEEE Annual Wireless and Microwave Technology Con- ference (WAMICON’06), Clearwater Beach, December 2006, pp. 1-4. [18] D. H. Johnson and S. R. De Graaf, “Improving the Reso- lution Bearing in Passive Sonar Arrays by Eigen Value Analysis,” IEEE Transactions on Acoustics, Speech & Signal Processing, Vol. 3, No. 4, August 1982, pp. 638- 647. Parameters via Rotational Invariance Techniques,” IEEE Transactions on Acoustics, Speech & Signal Processing, Vol. 37, No. 7, July 1989, pp. 984-995. [21] R. Roy and T. Kailath, “Direction-of-Arrival Estimation by Subspace R national Conference on Acoustics, Speech & Signal Pro- cessing (ICASSP’86), Tokyo, Vol. 11, 7-11 April 1986, pp. 2495-2498. |