Paper Menu >>
Journal Menu >>
 Wireless Sensor Network, 2010, 2, 365-372 doi:10.4236/wsn.2010.24048 Published Online May 2010 (http://www.SciRP.org/journal/wsn) Copyright © 2010 SciRes. WSN Detection Proposal Schemes for Spectrum Sensing in Cognitive Radio Nawaf Hadhal Kamil, Xiuhua Yuan Wuhan National Laboratory for Optoelectronics, College of Optoelectronics Science and Engineering, Huazhong University of Science and Technology, Wuhan, China E-mail: nawafhathal@yahoo.com Received February 4, 2010; revised February 22, 2010; accepted March 11, 2010 Abstract The most important components of the cognitive radio concept is its ability to measure, sense and learn. One also should be aware of the parameters related to the radio channel characteristics and the availability of spectrum and power. In cognitive radio technology, primary users can be defined as the users who have the highest priority on the usage of a specific part of the spectrum. Secondary users, have lower priority, and should not cause any interference to the primary users when using the technology. Therefore, the secondary users need to have certain cognitive radio capabilities, such as sensing the spectrum to check whether it is being used by primary user or not, and changing the radio parameters to exploit the unused part of the spec- trum. In this paper we proposed a new approach for spectrum sensing, In the first approach the primary sig- nal is known so we use the code value with match filter to detect the primary user, on the other hand, when the primary user signal is unknown we proposed a new strategy for energy detection in both non-cooperation and cooperation schemes. Then we will prove by simulation results that the new approach is better than the conventional energy detection. Keywords: Cognitive Radio, Spectrum Sensing, Spectrum Performance 1. Introduction Spectrum sensing is an exceptionally important task in a cognitive radio system. The transmissions of licensed users have to be reliably detected: Thus, spectrum sens- ing is the first step towards adaptive transmission in free spectral bands. Without causing any interference to the primary user, the secondary system has to be spectrum aware to exploit the available spectrum efficiently. There are certainly a number of approaches that can be used to check whether the primary user signal is present or not, but the only autonomous and flexible approach is based on measurements of the actual occupancy in given loca- tion and time [1]. Spectrum sensing could add robustness and responsiveness to changes in the environment be- cause it provides real-time feedback. Therefore, we argue that spectrum sensing should be considered as an impor- tant part of any cognitive radios system. Wireless sys- tems today are characterized by wasteful static spectrum allocations, fixed radio functions, and limited network coordination. Some systems in unlicensed bands have achieved great spectrum efficiency but are faced with an increasing interference that limits network capacity and scalability [2]. When the ultimate cognitive radio is con- sidered, it is a more general term that involves obtaining the spectrum usage characteristics across multiple di- mensions such as time, space, frequency, and code. However, this requires more powerful signal analysis technique because of the additional computational com- plexity. Even though there are many kinds of primary user systems, the cognitive radio’s knowledge of their characteristics and requirements for interference protec- tion can be abstracted by a few generally applicable pa- rameters. Three critical requirements for sensing radio are the detection time and the detection probability and the minimum detectable signal level. The required detec- tion time and probability of detection are set by the pri- mary user tolerances to QoS degradation. While these are two conflicting requirements, the cognitive radio system goal is to minimize detection time in order to increase the time available to use the channel [3]. In spectrum sensing many techniques exist to detect the primary user, two of the most practical techniques being energy detec- tion and match filter detection. Spectrum sensing is still 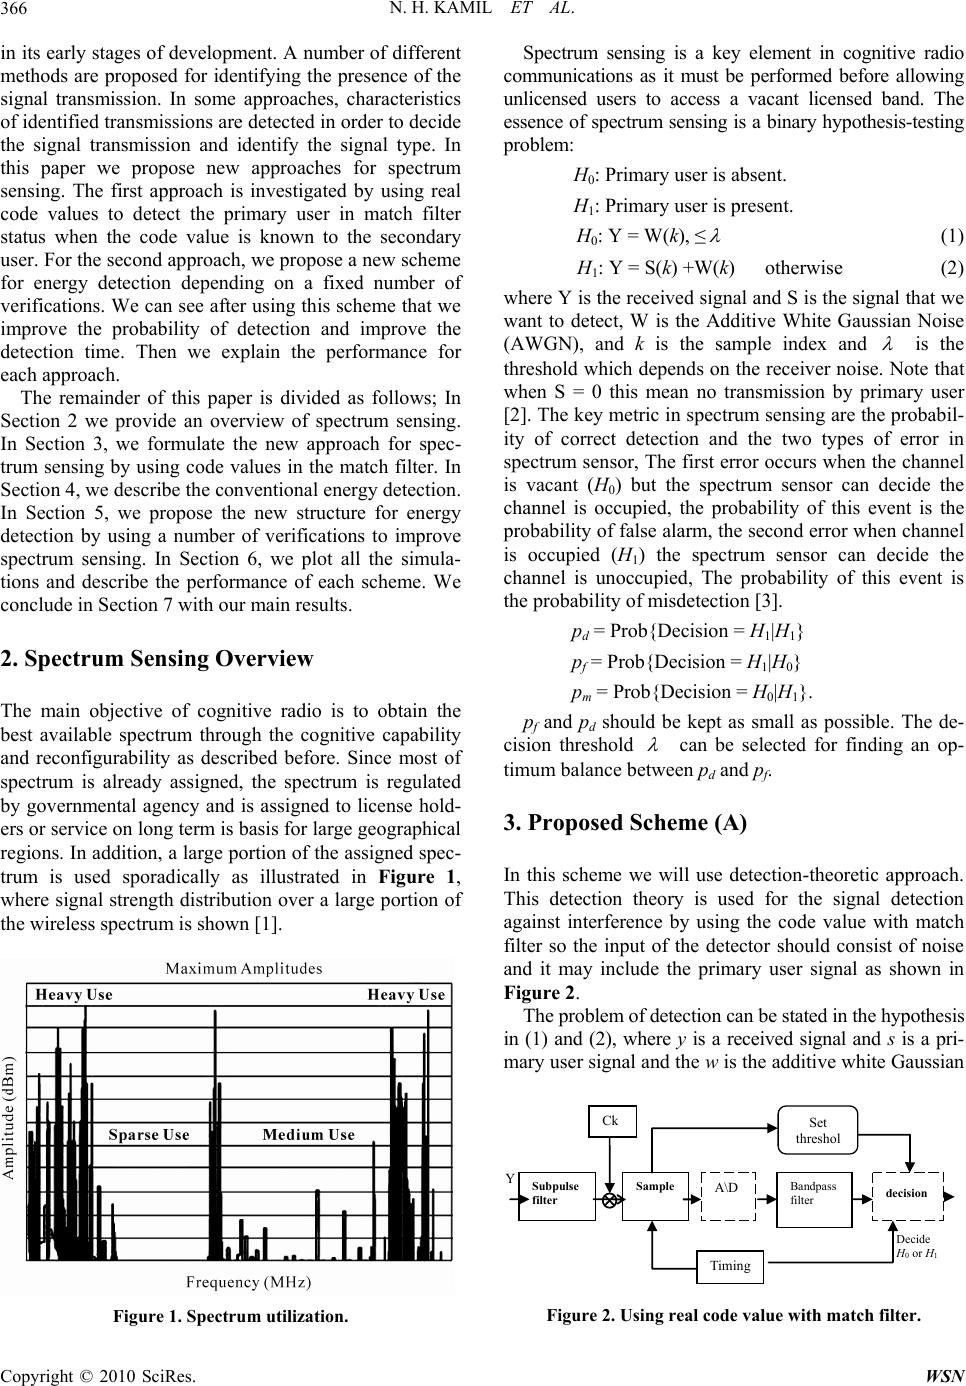 N. H. KAMIL ET AL. 366 in its early stages of development. A number of different methods are proposed for identifying the presence of the signal transmission. In some approaches, characteristics of identified transmissions are detected in order to decide the signal transmission and identify the signal type. In this paper we propose new approaches for spectrum sensing. The first approach is investigated by using real code values to detect the primary user in match filter status when the code value is known to the secondary user. For the second approach, we propose a new scheme for energy detection depending on a fixed number of verifications. We can see after using this scheme that we improve the probability of detection and improve the detection time. Then we explain the performance for each approach. The remainder of this paper is divided as follows; In Section 2 we provide an overview of spectrum sensing. In Section 3, we formulate the new approach for spec- trum sensing by using code values in the match filter. In Section 4, we describe the conventional energy detection. In Section 5, we propose the new structure for energy detection by using a number of verifications to improve spectrum sensing. In Section 6, we plot all the simula- tions and describe the performance of each scheme. We conclude in Section 7 with our main results. 2. Spectrum Sensing Overview The main objective of cognitive radio is to obtain the best available spectrum through the cognitive capability and reconfigurability as described before. Since most of spectrum is already assigned, the spectrum is regulated by governmental agency and is assigned to license hold- ers or service on long term is basis for large geographical regions. In addition, a large portion of the assigned spec- trum is used sporadically as illustrated in Figure 1, where signal strength distribution over a large portion of the wireless spectrum is shown [1]. Figure 1. Spectrum utilization. Spectrum sensing is a key element in cognitive radio communications as it must be performed before allowing unlicensed users to access a vacant licensed band. The essence of spectrum sensing is a binary hypothesis-testing problem: H0: Primary user is absent. H1: Primary user is present. H0: Y = W(k), ≤ (1) H1: Y = S(k) +W(k) otherwise (2) where Y is the received signal and S is the signal that we want to detect, W is the Additive White Gaussian Noise (AWGN), and k is the sample index and is the threshold which depends on the receiver noise. Note that when S = 0 this mean no transmission by primary user [2]. The key metric in spectrum sensing are the probabil- ity of correct detection and the two types of error in spectrum sensor, The first error occurs when the channel is vacant (H0) but the spectrum sensor can decide the channel is occupied, the probability of this event is the probability of false alarm, the second error when channel is occupied (H1) the spectrum sensor can decide the channel is unoccupied, The probability of this event is the probability of misdetection [3]. pd = Prob{Decision = H1|H1} pf = Prob{Decision = H1|H0} pm = Prob{Decision = H0|H1}. pf and pd should be kept as small as possible. The de- cision threshold can be selected for finding an op- timum balance between pd and pf. 3. Proposed Scheme (A) In this scheme we will use detection-theoretic approach. This detection theory is used for the signal detection against interference by using the code value with match filter so the input of the detector should consist of noise and it may include the primary user signal as shown in Figure 2. The problem of detection can be stated in the hypothesis in (1) and (2), where y is a received signal and s is a pri- mary user signal and the w is the additive white Gaussian Decide H 0 or H 1 Ck Subpulse filter Sample A\D Bandpass filter decision Timing Set threshol Y Figure 2. Using real code value with match filter. Copyright © 2010 SciRes. WSN 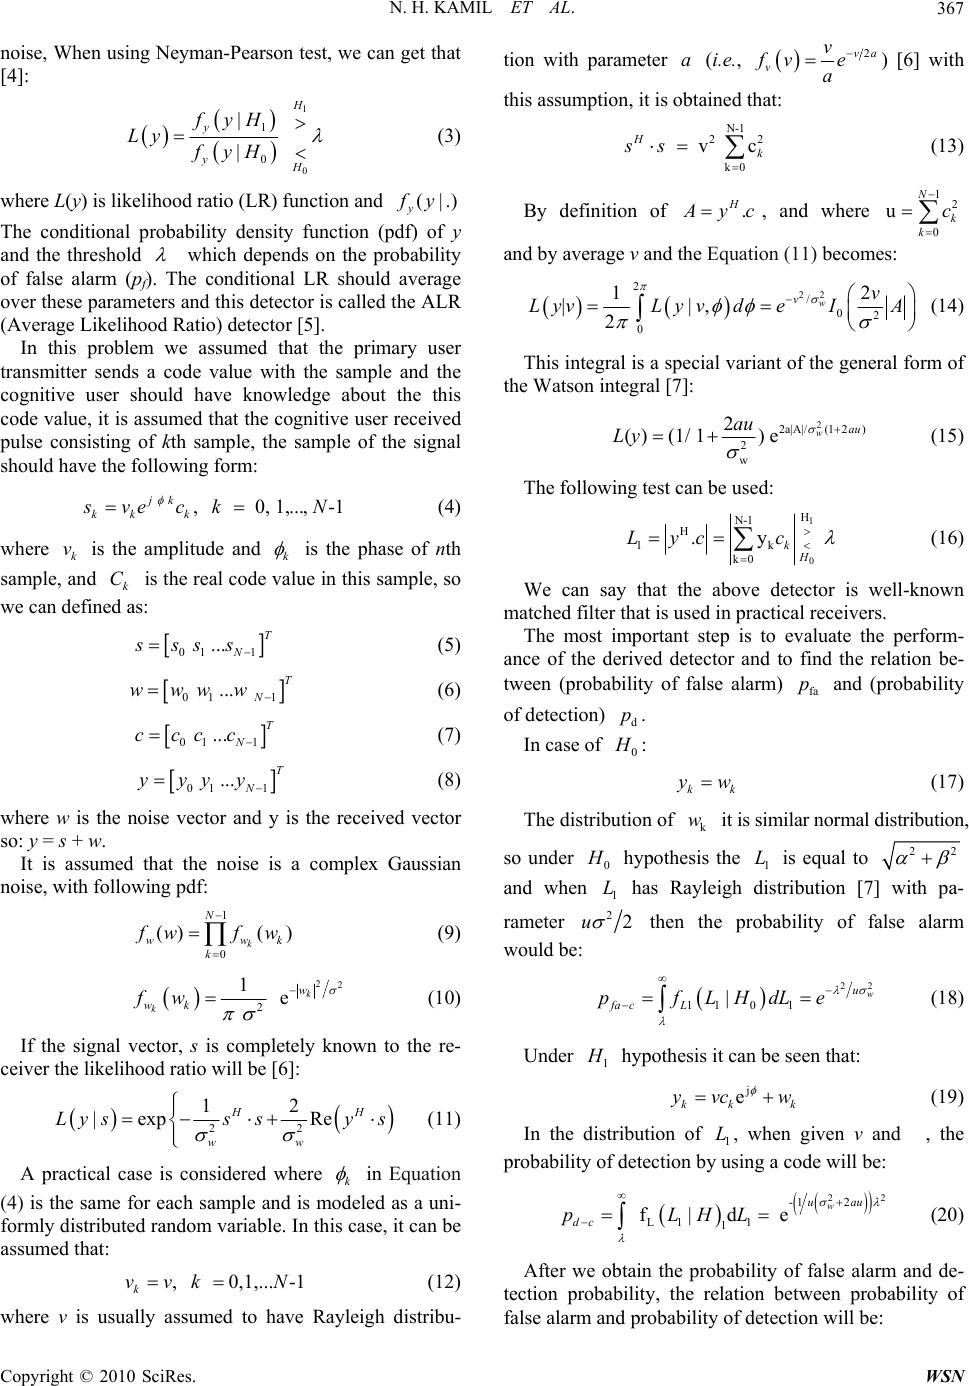 N. H. KAMIL ET AL.367 noise, When using Neyman-Pearson test, we can get that [4]: 1 0 1 0 | | H y yH fyH Ly fyH (3) where L(y) is likelihood ratio (LR) function and (|.) y f y The conditional probability density function (pdf) of y and the threshold which depends on the probability of false alarm (pf). The conditional LR should average over these parameters and this detector is called the ALR (Average Likelihood Ratio) detector [5]. In this problem we assumed that the primary user transmitter sends a code value with the sample and the cognitive user should have knowledge about the this code value, it is assumed that the cognitive user received pulse consisting of kth sample, the sample of the signal should have the following form: , 0, 1,..., -1 jk kk k s vec kN (4) where is the amplitude and k vk is the phase of nth sample, and is the real code value in this sample, so we can defined as: k C 01 1 ...T N ssss k (5) 01 1 ... T N wwww (6) 01 1 ...T N cccc (7) 01 1 ...T N yyyy (8) where w is the noise vector and y is the received vector so: y = s + w. It is assumed that the noise is a complex Gaussian noise, with following pdf: 1 0 ()( ) k N ww k f wfw (9) 22 2 1 e k k w wk fw (10) If the signal vector, s is completely known to the re- ceiver the likelihood ratio will be [6]: 22 12 |exp Re HH ww Lyss sy s (11) A practical case is considered where k in Equation (4) is the same for each sample and is modeled as a uni- formly distributed random variable. In this case, it can be assumed that: , 0,1,...-1 k vvkN (12) where v is usually assumed to have Rayleigh distribu- tion with parameter (i.e., a 2va v v fv e a ) [6] with this assumption, it is obtained that: N-1 2 k0 v c H k ss 2 (13) By definition of . H A yc, and where 12 0 u N k k c and by average v and the Equation (11) becomes: 22 2 / 02 0 12 ||, 2 w vv LyvLyv deIA (14) This integral is a special variant of the general form of the Watson integral [7]: 2 2a|A|/(12) 2 w 2 ()(1/ 1) ewau au Ly (15) The following test can be used: 1 0 H N-1 H 1k k0 .y k H Lycc (16) We can say that the above detector is well-known matched filter that is used in practical receivers. The most important step is to evaluate the perform- ance of the derived detector and to find the relation be- tween (probability of false alarm) and (probability of detection) . fa p d p In case of 0 H : k yw k (17) The distribution of it is similar normal distribution, so under k w 0 H hypothesis the is equal to 1 L22 and when has Rayleigh distribution [7] with pa- rameter 1 L 2 u 2 then the probability of false alarm would be: 22 11 01 |w u fa cL pfLHdLe (18) Under 1 H hypothesis it can be seen that: j e kk k y vc w (19) In the distribution of , when given v and , the probability of detection by using a code will be: 1 L 22 -1 2 L1 1 1 f|d e w uau dc pLHL (20) After we obtain the probability of false alarm and de- tection probability, the relation between probability of false alarm and probability of detection will be: Copyright © 2010 SciRes. WSN 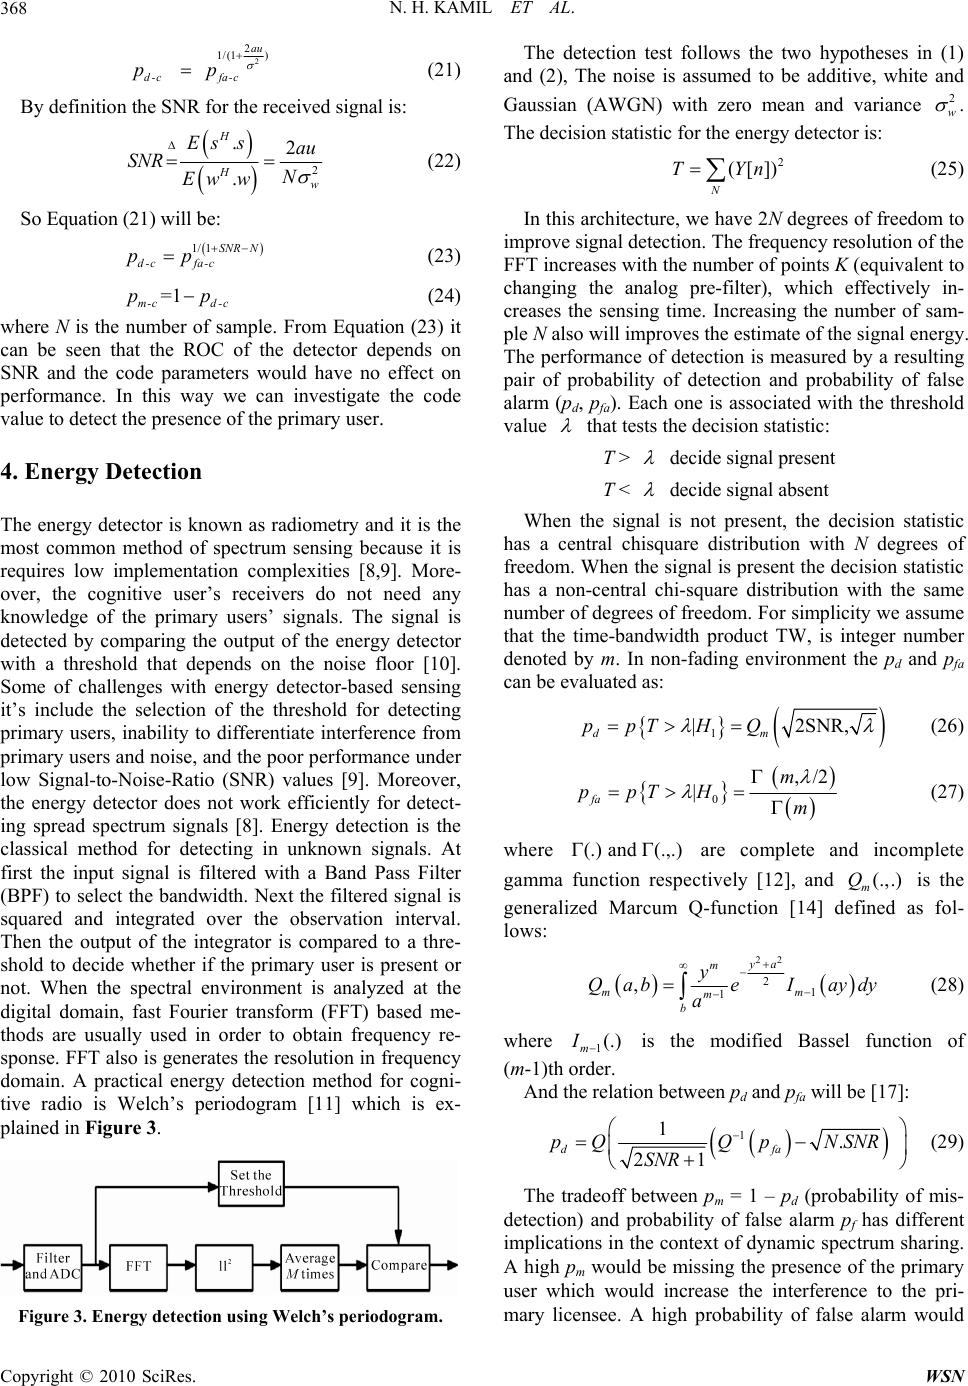 N. H. KAMIL ET AL. 368 2 2 1/(1 ) au d-cfa-c pp (21) By definition the SNR for the received signal is: 2 .2 . H H w Es sau SNR N Ew w (22) So Equation (21) will be: 1/ 1SNR N d-cfa-c pp (23) =1 m-c d-c pp (24) where N is the number of sample. From Equation (23) it can be seen that the ROC of the detector depends on SNR and the code parameters would have no effect on performance. In this way we can investigate the code value to detect the presence of the primary user. 4. Energy Detection The energy detector is known as radiometry and it is the most common method of spectrum sensing because it is requires low implementation complexities [8,9]. More- over, the cognitive user’s receivers do not need any knowledge of the primary users’ signals. The signal is detected by comparing the output of the energy detector with a threshold that depends on the noise floor [10]. Some of challenges with energy detector-based sensing it’s include the selection of the threshold for detecting primary users, inability to differentiate interference from primary users and noise, and the poor performance under low Signal-to-Noise-Ratio (SNR) values [9]. Moreover, the energy detector does not work efficiently for detect- ing spread spectrum signals [8]. Energy detection is the classical method for detecting in unknown signals. At first the input signal is filtered with a Band Pass Filter (BPF) to select the bandwidth. Next the filtered signal is squared and integrated over the observation interval. Then the output of the integrator is compared to a thre- shold to decide whether if the primary user is present or not. When the spectral environment is analyzed at the digital domain, fast Fourier transform (FFT) based me- thods are usually used in order to obtain frequency re- sponse. FFT also is generates the resolution in frequency domain. A practical energy detection method for cogni- tive radio is Welch’s periodogram [11] which is ex- plained in Figure 3. Figure 3. Energy detection using Welch’s periodogram. The detection test follows the two hypotheses in (1) and (2), The noise is assumed to be additive, white and Gaussian (AWGN) with zero mean and variance 2 w . The decision statistic for the energy detector is: 2 ([]) N TYn (25) In this architecture, we have 2N degrees of freedom to improve signal detection. The frequency resolution of the FFT increases with the number of points K (equivalent to changing the analog pre-filter), which effectively in- creases the sensing time. Increasing the number of sam- ple N also will improves the estimate of the signal energy. The performance of detection is measured by a resulting pair of probability of detection and probability of false alarm (pd, pfa). Each one is associated with the threshold value that tests the decision statistic: T > decide signal present T < decide signal absent When the signal is not present, the decision statistic has a central chisquare distribution with N degrees of freedom. When the signal is present the decision statistic has a non-central chi-square distribution with the same number of degrees of freedom. For simplicity we assume that the time-bandwidth product TW, is integer number denoted by m. In non-fading environment the pd and pfa can be evaluated as: 1 |2SNR, dm ppTH Q (26) 0 ,/2 | fa m ppTH m (27) where (.) and (.,.) are complete and incomplete gamma function respectively [12], and is the generalized Marcum Q-function [14] defined as fol- lows: (.,.) m Q 22 2 1 1 , ya m mm m b y QabeI aydy a (28) where is the modified Bassel function of (m-1)th order. 1(.) m I And the relation between pd and pfa will be [17]: 1 1. 21 dfa pQQpNSNR SNR (29) The tradeoff between pm = 1 – pd (probability of mis- detection) and probability of false alarm pf has different implications in the context of dynamic spectrum sharing. A high pm would be missing the presence of the primary user which would increase the interference to the pri- mary licensee. A high probability of false alarm would Copyright © 2010 SciRes. WSN 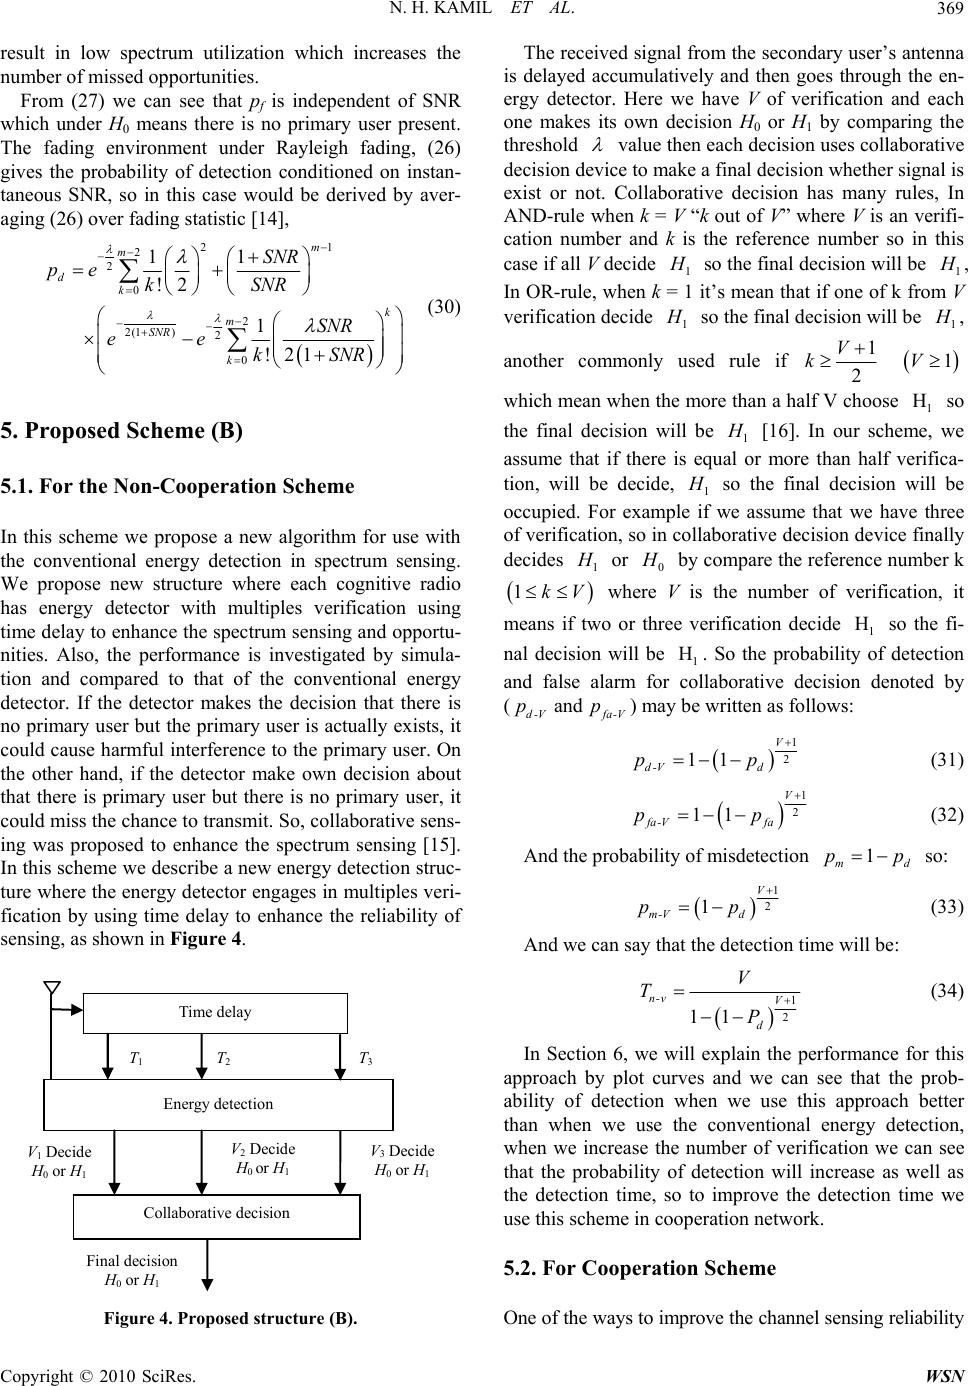 N. H. KAMIL ET AL.369 result in low spectrum utilization which increases the number of missed opportunities. From (27) we can see that pf is independent of SNR which under H0 means there is no primary user present. The fading environment under Rayleigh fading, (26) gives the probability of detection conditioned on instan- taneous SNR, so in this case would be derived by aver- aging (26) over fading statistic [14], 21 2 2 0 2 2(1 )2 0 11 !2 1 !21 m m d k k m SNR k SNR pe kSNR SNR ee kSNR (30) 5. Proposed Scheme (B) 5.1. For the Non-Cooperation Scheme In this scheme we propose a new algorithm for use with the conventional energy detection in spectrum sensing. We propose new structure where each cognitive radio has energy detector with multiples verification using time delay to enhance the spectrum sensing and opportu- nities. Also, the performance is investigated by simula- tion and compared to that of the conventional energy detector. If the detector makes the decision that there is no primary user but the primary user is actually exists, it could cause harmful interference to the primary user. On the other hand, if the detector make own decision about that there is primary user but there is no primary user, it could miss the chance to transmit. So, collaborative sens- ing was proposed to enhance the spectrum sensing [15]. In this scheme we describe a new energy detection struc- ture where the energy detector engages in multiples veri- fication by using time delay to enhance the reliability of sensing, as shown in Figure 4. Time delay Energy detection Collaborative decision T1 T2 T3 V1 Decide H0 or H1 V2 Decide H0 or H1 V3 Decide H0 or H1 Final decision H0 or H1 Figure 4. Proposed structure (B). The received signal from the secondary user’s antenna is delayed accumulatively and then goes through the en- ergy detector. Here we have V of verification and each one makes its own decision H0 or H1 by comparing the threshold value then each decision uses collaborative decision device to make a final decision whether signal is exist or not. Collaborative decision has many rules, In AND-rule when k = V “k out of V” where V is an verifi- cation number and k is the reference number so in this case if all V decide 1 H so the final decision will be 1 H , In OR-rule, when k = 1 it’s mean that if one of k from V verification decide 1 H so the final decision will be 1 H , another commonly used rule if 1 2 V k 1V H which mean when the more than a half V choose so the final decision will be 1 1 H [16]. In our scheme, we assume that if there is equal or more than half verifica- tion, will be decide, 1 H so the final decision will be occupied. For example if we assume that we have three of verification, so in collaborative decision device finally decides 1 H or 0 H by compare the reference number k V fa 1k d-V p where V is the number of verification, it means if two or three verification decide so the fi- nal decision will be . So the probability of detection and false alarm for collaborative decision denoted by () may be written as follows: 1 H 1 H and -V p 1 2 11 V d-V d pp (31) 1 2 11 V fa-V fa pp (32) And the probability of misdetection so: 1 md pp 1 2 1 V m-Vd pp (33) And we can say that the detection time will be: 1 2 11 n-v V d V T P (34) In Section 6, we will explain the performance for this approach by plot curves and we can see that the prob- ability of detection when we use this approach better than when we use the conventional energy detection, when we increase the number of verification we can see that the probability of detection will increase as well as the detection time, so to improve the detection time we use this scheme in cooperation network. 5.2. For Cooperation Scheme One of the ways to improve the channel sensing reliability Copyright © 2010 SciRes. WSN 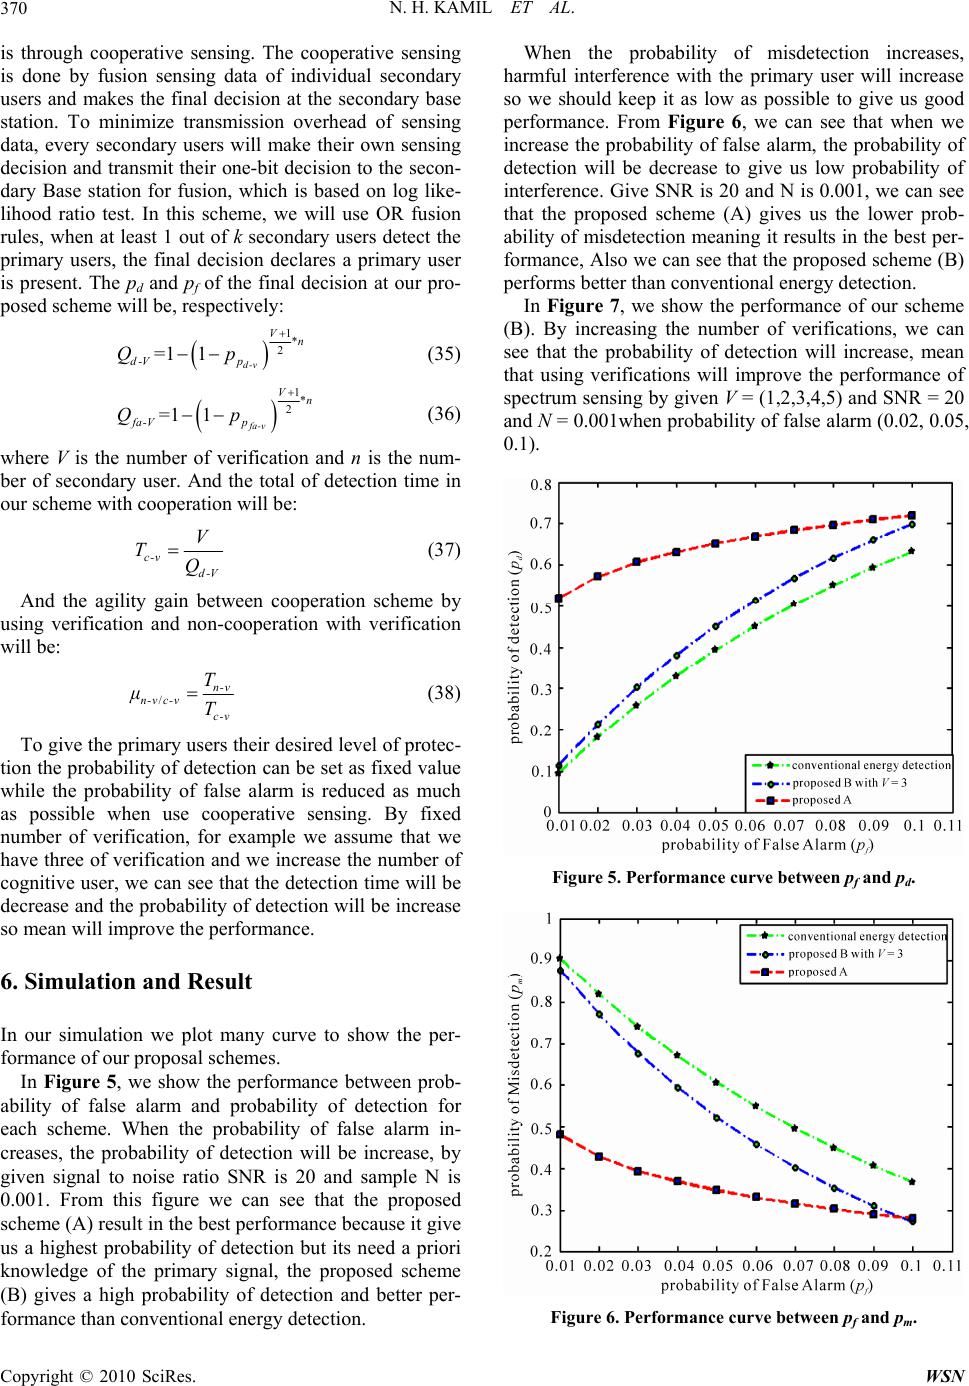 N. H. KAMIL ET AL. 370 is through cooperative sensing. The cooperative sensing is done by fusion sensing data of individual secondary users and makes the final decision at the secondary base station. To minimize transmission overhead of sensing data, every secondary users will make their own sensing decision and transmit their one-bit decision to the secon- dary Base station for fusion, which is based on log like- lihood ratio test. In this scheme, we will use OR fusion rules, when at least 1 out of k secondary users detect the primary users, the final decision declares a primary user is present. The pd and pf of the final decision at our pro- posed scheme will be, respectively: 1* 2 =1 1d-v Vn d-V p Qp (35) 1* 2 =1 1fa-v Vn fa-V p Qp (36) where V is the number of verification and n is the num- ber of secondary user. And the total of detection time in our scheme with cooperation will be: c-v d-V V TQ (37) And the agility gain between cooperation scheme by using verification and non-cooperation with verification will be: / n-v n-v c-v c-v T μT (38) To give the primary users their desired level of protec- tion the probability of detection can be set as fixed value while the probability of false alarm is reduced as much as possible when use cooperative sensing. By fixed number of verification, for example we assume that we have three of verification and we increase the number of cognitive user, we can see that the detection time will be decrease and the probability of detection will be increase so mean will improve the performance. 6. Simulation and Result In our simulation we plot many curve to show the per- formance of our proposal schemes. In Figure 5, we show the performance between prob- ability of false alarm and probability of detection for each scheme. When the probability of false alarm in- creases, the probability of detection will be increase, by given signal to noise ratio SNR is 20 and sample N is 0.001. From this figure we can see that the proposed scheme (A) result in the best performance because it give us a highest probability of detection but its need a priori knowledge of the primary signal, the proposed scheme (B) gives a high probability of detection and better per- formance than conventional energy detection. When the probability of misdetection increases, harmful interference with the primary user will increase so we should keep it as low as possible to give us good performance. From Figure 6, we can see that when we increase the probability of false alarm, the probability of detection will be decrease to give us low probability of interference. Give SNR is 20 and N is 0.001, we can see that the proposed scheme (A) gives us the lower prob- ability of misdetection meaning it results in the best per- formance, Also we can see that the proposed scheme (B) performs better than conventional energy detection. In Figure 7, we show the performance of our scheme (B). By increasing the number of verifications, we can see that the probability of detection will increase, mean that using verifications will improve the performance of spectrum sensing by given V = (1,2,3,4,5) and SNR = 20 and N = 0.001when probability of false alarm (0.02, 0.05, 0.1). Figure 5. Performance curve between pf and pd. Figure 6. Performance curve between pf and pm. Copyright © 2010 SciRes. WSN 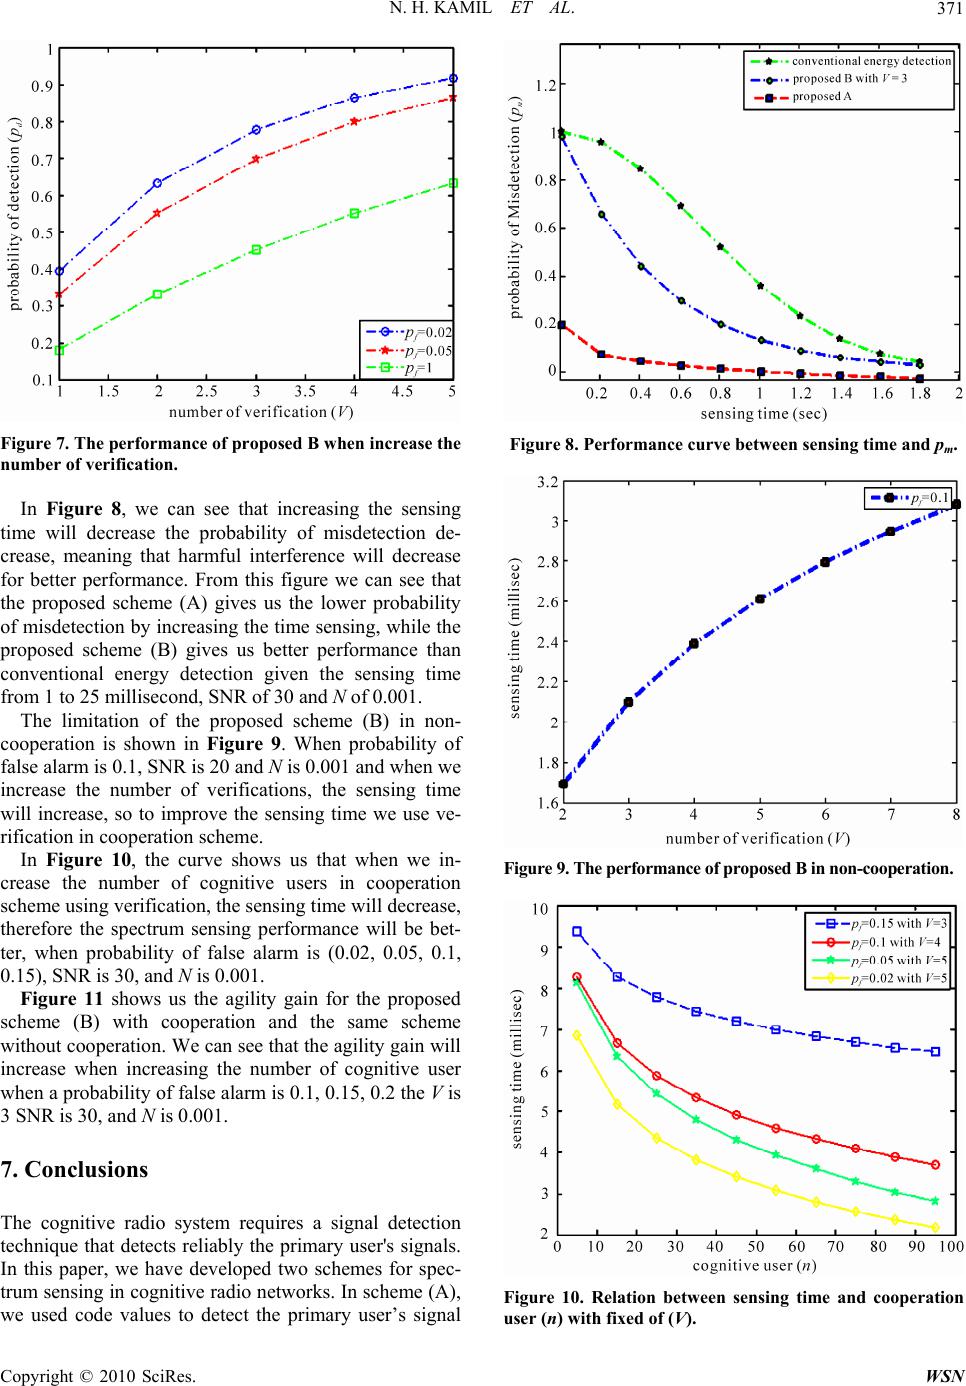 N. H. KAMIL ET AL.371 Figure 7. The performance of proposed B when increase the number of verification. In Figure 8, we can see that increasing the sensing time will decrease the probability of misdetection de- crease, meaning that harmful interference will decrease for better performance. From this figure we can see that the proposed scheme (A) gives us the lower probability of misdetection by increasing the time sensing, while the proposed scheme (B) gives us better performance than conventional energy detection given the sensing time from 1 to 25 millisecond, SNR of 30 and N of 0.001. The limitation of the proposed scheme (B) in non- cooperation is shown in Figure 9. When probability of false alarm is 0.1, SNR is 20 and N is 0.001 and when we increase the number of verifications, the sensing time will increase, so to improve the sensing time we use ve- rification in cooperation scheme. In Figure 10, the curve shows us that when we in- crease the number of cognitive users in cooperation scheme using verification, the sensing time will decrease, therefore the spectrum sensing performance will be bet- ter, when probability of false alarm is (0.02, 0.05, 0.1, 0.15), SNR is 30, and N is 0.001. Figure 11 shows us the agility gain for the proposed scheme (B) with cooperation and the same scheme without cooperation. We can see that the agility gain will increase when increasing the number of cognitive user when a probability of false alarm is 0.1, 0.15, 0.2 the V is 3 SNR is 30, and N is 0.001. 7. Conclusions The cognitive radio system requires a signal detection technique that detects reliably the primary user's signals. In this paper, we have developed two schemes for spec- trum sensing in cognitive radio networks. In scheme (A), we used code values to detect the primary user’s signal Figure 8. Performance curve between sensing time and pm. Figure 9. The performan ce of proposed B in non- coopera tion. Figure 10. Relation between sensing time and cooperation user (n) with fixed of (V). Copyright © 2010 SciRes. WSN 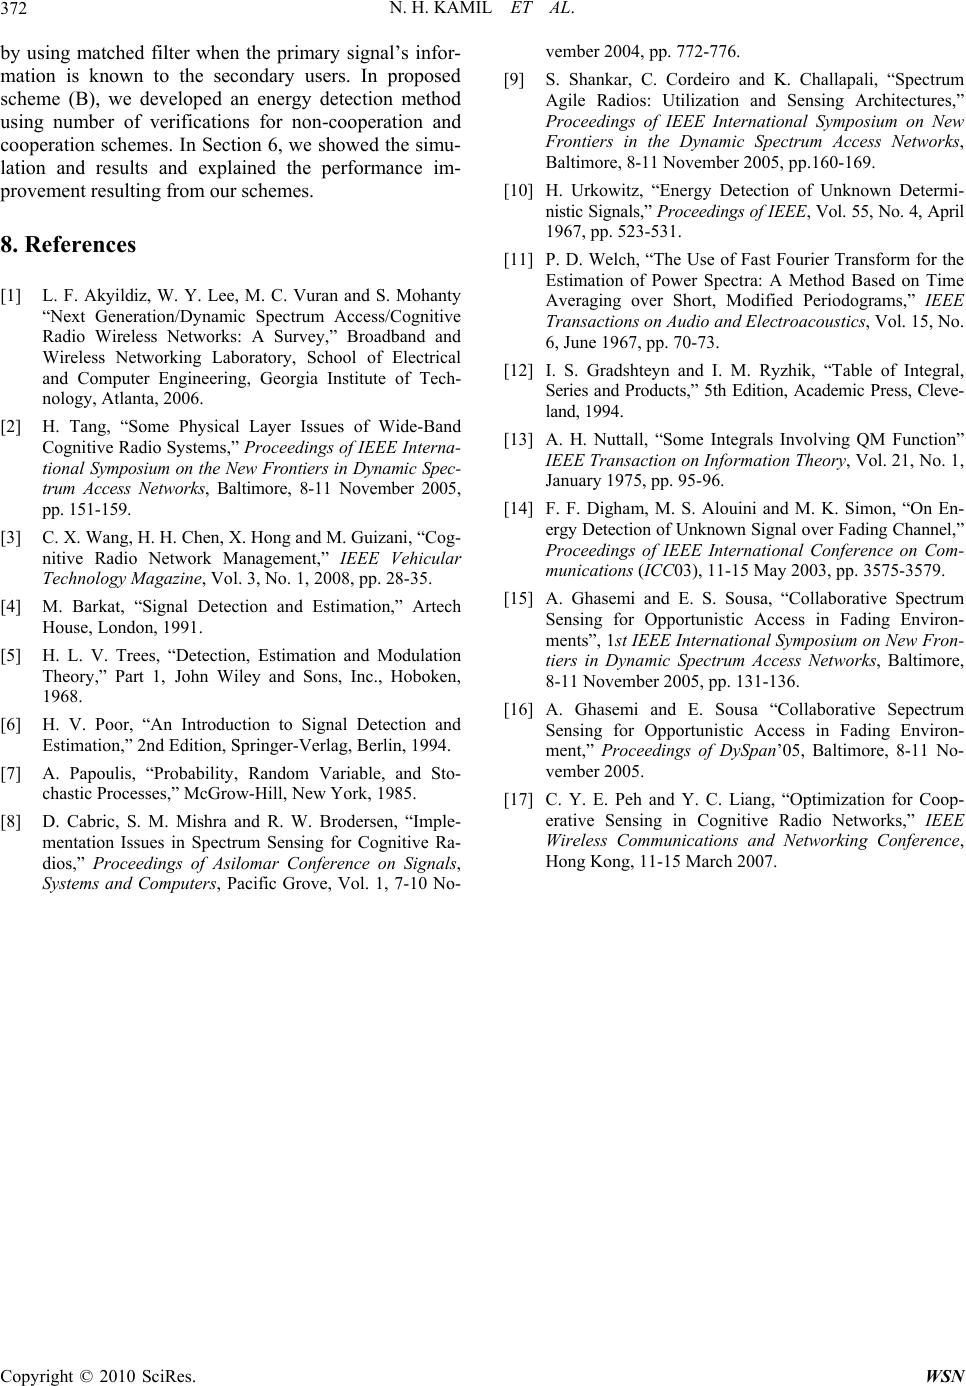 N. H. KAMIL ET AL. Copyright © 2010 SciRes. WSN 372 by using matched filter when the primary signal’s infor- mation is known to the secondary users. In proposed scheme (B), we developed an energy detection method using number of verifications for non-cooperation and cooperation schemes. In Section 6, we showed the simu- lation and results and explained the performance im- provement resulting from our schemes. 8. References [1] L. F. Akyildiz, W. Y. Lee, M. C. Vuran and S. Mohanty “Next Generation/Dynamic Spectrum Access/Cognitive Radio Wireless Networks: A Survey,” Broadband and Wireless Networking Laboratory, School of Electrical and Computer Engineering, Georgia Institute of Tech- nology, Atlanta, 2006. [2] H. Tang, “Some Physical Layer Issues of Wide-Band Cognitive Radio Systems,” Proceedings of IEEE Interna- tional Symposium on the New Frontiers in Dynamic Spec- trum Access Networks, Baltimore, 8-11 November 2005, pp. 151-159. [3] C. X. Wang, H. H. Chen, X. Hong and M. Guizani, “Cog- nitive Radio Network Management,” IEEE Vehicular Technology Magazine, Vol. 3, No. 1, 2008, pp. 28-35. [4] M. Barkat, “Signal Detection and Estimation,” Artech House, London, 1991. [5] H. L. V. Trees, “Detection, Estimation and Modulation Theory,” Part 1, John Wiley and Sons, Inc., Hoboken, 1968. [6] H. V. Poor, “An Introduction to Signal Detection and Estimation,” 2nd Edition, Springer-Verlag, Berlin, 1994. [7] A. Papoulis, “Probability, Random Variable, and Sto- chastic Processes,” McGrow-Hill, New York, 1985. [8] D. Cabric, S. M. Mishra and R. W. Brodersen, “Imple- mentation Issues in Spectrum Sensing for Cognitive Ra- dios,” Proceedings of Asilomar Conference on Signals, Systems and Computers, Pacific Grove, Vol. 1, 7-10 No- vember 2004, pp. 772-776. [9] S. Shankar, C. Cordeiro and K. Challapali, “Spectrum Agile Radios: Utilization and Sensing Architectures,” Proceedings of IEEE International Symposium on New Frontiers in the Dynamic Spectrum Access Networks, Baltimore, 8-11 November 2005, pp.160-169. [10] H. Urkowitz, “Energy Detection of Unknown Determi- nistic Signals,” Proceedings of IEEE, Vol. 55, No. 4, April 1967, pp. 523-531. [11] P. D. Welch, “The Use of Fast Fourier Transform for the Estimation of Power Spectra: A Method Based on Time Averaging over Short, Modified Periodograms,” IEEE Transactions on Audio and Electroacoustics, Vol. 15, No. 6, June 1967, pp. 70-73. [12] I. S. Gradshteyn and I. M. Ryzhik, “Table of Integral, Series and Products,” 5th Edition, Academic Press, Cleve- land, 1994. [13] A. H. Nuttall, “Some Integrals Involving QM Function” IEEE Transaction on Information Theory, Vol. 21, No. 1, January 1975, pp. 95-96. [14] F. F. Digham, M. S. Alouini and M. K. Simon, “On En- ergy Detection of Unknown Signal over Fading Channel,” Proceedings of IEEE International Conference on Com- munications (ICC03), 11-15 May 2003, pp. 3575-3579. [15] A. Ghasemi and E. S. Sousa, “Collaborative Spectrum Sensing for Opportunistic Access in Fading Environ- ments”, 1st IEEE International Symposium on New Fron- tiers in Dynamic Spectrum Access Networks, Baltimore, 8-11 November 2005, pp. 131-136. [16] A. Ghasemi and E. Sousa “Collaborative Sepectrum Sensing for Opportunistic Access in Fading Environ- ment,” Proceedings of DySpan’05, Baltimore, 8-11 No- vember 2005. [17] C. Y. E. Peh and Y. C. Liang, “Optimization for Coop- erative Sensing in Cognitive Radio Networks,” IEEE Wireless Communications and Networking Conference, Hong Kong, 11-15 March 2007. |

