Health
Vol.4 No.12(2012), Article ID:25686,10 pages DOI:10.4236/health.2012.412197
Numerical simulation and analysis for indoor air quality in different ventilation*
![]()
School of Environment and Architecture, University of Shanghai for Science and Technology, Shanghai, China; yangli.arch@usst.edu.cn
Received 23 October 2012; revised 24 November 2012; accepted 1 December 2012
Keywords: WenYuan Building; Ventilation Modes; Indoor Air Quality
ABSTRACT
Indoor air environment includes indoor thermal environment and air quality, and a reasonable ventilation provides guarantee for a good indoor environment. A numerical study of the indoor environment in different ventilation is presented in this paper. The External Energy Saving Lab of the WenYuan Building was selected for this purpose, and its indoor air quality and thermal performance in the typical summer climate were simulated. For the numerical simulation, the techniques of Fluent Air-pak was adopted to establish the physical and numerical model of lab. A attention is given to the velocity field and the distribution of pollutant concentration, followed by a discussion of two ventilation modes (displacement ventilation and up-in and up-out ventilation). By comparison, it is found that the Displacement ventilation in improving indoor air quality is obviously superior to the traditional up-in and up-out ventilation.
1. INTRODUCTION
People spend most of their time indoors. Therefore, the quality of indoor environment is directly related to people’s safety, comfort, health, etc. The security as well as people’s physical and mental health should be as the first premise of interior design [1]. Indoor air environment includes indoor thermal environment and air quality (IAQ), and a reasonable ventilation provides fundamental guarantee for a good indoor environment. By providing the fresh air for indoor, discharging polluted gas, reducing the concentration of indoor pollutants, ventilation can improve indoor thermal comfort. The different ventilation modes and airflow patterns leads to different results of dilution and exclusion of indoor pollutants, so as to people’s feelings of air quality [2]. Influenced by a variety of objective factors, the distributive rules of the ventilation organization is more difficult to reveal. The traditional approach is by the simulation experiments. This method, limited by the restrictive experimental conditions, needs not only a lot of financial but also material resources. In a word, it is difficult to simulate all the characteristics of a complex space’s air flow.
Rencently,significant progress in the field of CFD has been made. With the visual way to demonstrate results, it has been used as an efficient tool to simulate the indoor air flow. Further, it will be the inevitable trend to studying the indoor ventilation organization and designing the high-performance air-conditioning room [3]. In the paper, we give an numerical Simulation and analysis of indoor ventilation organization of the External Energy Saving Lab of the WenYuan Building. For the simulaton, the mass conservation equation, energy conservation equation and RNG’s k-ε turbulence models were adopted. According to the comparison among the indoor pollutants, concentration field and velocity field distribution in different ventilation modes, a conclusion is drawn. In order to provide a theoretical reference and the scientific basis for the actual ventilation organization and HVAC designs.
2. THE MEANING AND IMPACT FACTORS ANALYSIS OF INDOOR AIR ENVIRONMENT
As one of the most important part in our lives and work. Indoor air environment mainly constituted by the thermal environment, wet environment and air quality. Good indoor air environment should be comfortable for most indoor members. That means high quality fresh, pleasant air for the indoor person to meet human thermal comfort and health needs [3]. According to the ASHRAE standard, thermal comfort is defined as “the satisfactory state of consciousness of thermal environment”. It is four environment factors and two human factors that affect the thermal comfort. Four environment factors include air temperature, relative humidity, the average temperature of the inner surface of indoor maintenance structure and velocity of air flow. Two human factors are the rate of human energy metabolism and clothing thermal resistance [4]. The indoor air quality is subject to many factors, and it can be divided into three categories according to the differences in the nature. The first is the physical, including suspended particles, smoke particles, and electromagnetic radiation, etc. The second is chemicals, mainly from the residual components of housing renovation, insecticide sprays, the kitchen smoke, etc. Its main ingredient is volatile organic compounds (VOA) (such as formaldehyde, toluene, ethyl acetate) and inorganic compounds (such as ammonia, CO, CO2), etc. The third category is the biological, like bacteria, fungi, viruses, etc. They often come form carpets, bedding, bedroom humidifier and unsanitary air conditioning equipment, etc. [5].
3. MODEL INTRODUCTION
3.1. The Setting of the Geometric Model
The External Energy Saving Lab of the WenYuan Building used the new type air-conditioning system (including the Cold radiant panel, Displacement ventilation and up-in and up-out ventilation). In this paper, two different air-conditioning ventilation modes of Wenyuan Building’s energy-saving laboratory were chose as the object of study. The techniques of CFD is adopted to to simulate and analyse the thermal comfort and indoor air quality in different ventilation modes. Choosing the energy-saving laboratory of Wenyuan Building in the typical condition of summer noon as the Physical model, which shown in Figure 1.
The model parameters are as follows:
1) 8 low-speed floor circular inlets: radius 0.12 m, velocity 0.5 m/s, temperature 21˚C;
2) 3 outlets on the east wall: 0.15 m × 0.3 m (geometric dimensions);
3) 1 inlet on the west wall: 0.3 m × 1.5 m (geometric dimensions);
4) 2 Low-E windows faced to the south: 2.75 m × 0.9 m (geometric dimensions);
5) Phase Change Materials window: 2.75 m × 5 m (geometric dimensions);
6) Indoor heat source: a sitting person (producing heat 105 W), a standing person (130 W) and 9 LED lights (each light heat 30 W); Block instead of source: 0.05 m × 0.10.4 m × 1.15 m (geometric dimensions);
7) Room size: X × Y × Z = 6.8 m × 2.75 m × 5.8 m;
8) Source settings: there’s a printer in the lab as the heat source and pollution source, we use block (geometric dimensions: 0.5 m × 0.4 m × 0.5 m) instead of it, and the power of the printer is 100 W;
9) Coordinate reference: The starting point coordinate (0, 0, 0), the termination of coordinates (6.8, 2.75, 5.8), respectively corresponding to lower left and upper right corner in the office (Figure 1).

Figure 1. The simplify Air-pak model of energy-saving laboratory.
3.2. The Setting of the Boundary Condition
1) Outdoor calculation parameters: Choose the climate condition at 12 o’clock on July 1st in Shanghai, dry bulb temperature 35˚C, wet bulb temperature 28˚C, specific enthalphy 92.56 KJ/Kg, moisture content 0.0278 Kg/kg;
2) Indoor calculation parameters: Dry bulb temperature 25˚C, relative temperature 50%;
3) Exterior wall: The south side is the only exterior wall for this room, used two phase change materials (19˚C and 26˚C). Since we chose the typical climate condition of summer noon, the selected state is the stable state of indoor temperature. The simplified calculation can make by setting heat transfer of the phase change material as a constant heat flux boundary conditions, and the heat transfer coefficient is 58 W/m2;
4) Door and window: There are two Low-E glass doors on the south wall (2.75 m × 0.9 m), the heat transfer coefficient is 5 W/m2;
5) Inner wall: Since the adjacent rooms are air-conditioning rooms, the inner wall can be regarded as adiabatic boundary conditions without difference in temperature;
6) Roof and floor: Both the ceiling and raised floor of energy-saving lab are made of copper coil metal radiant panel. There are LED lights on the ceiling and low speed inlet on the floor. For the purpose of simplifying the model, we regarded the whole roof and raised floor as cold radiation, and assumed the cold radiant panel temperature is 19˚C. Then we can set the cold radiant panel surface as the steady thermostatic state of boundary condition;
7) Outlet: Two different blowing modes are respectively set. Displacement ventilation used the floor lowspeed and up-flow mode. In the model, and we set the blowing direction along the Y-axis direction, a temperature of 21 degrees and a velocity of 0.5 m/s. In the Up-in and up-out blowing mode, the temperature is set as 21 degreesand the velocity is 1 m/s;
8) Pollution source setting: Printer is the indoor pollution source. Assuming distributing gas of the block’s top surface is VOC benzene, and its emission rate is 0.5 m/s;
9) Vent settings: There are three outlets located over top of east inner wall, and each size is 0.15 m × 0.3 m.
3.3. Numerical Calculation Method
Computational Fluid Dynamics(CFD) is a computer simulation technology began in the early 1930s. It contains the fluid dynamics, numerical methods and computer graphics [6]. Now it has been widely applicated in the related fields. The basic idea of CFD is to replace the original continuous physical field (such as temperature field, pressure field, velocity field) in time and space to a set, which has a series of variable values of the finite discrete points, establish the algebraic equations about the relationship between these discrete point field in some ways, then get the approximation of the field variable by solving algebraic equations [7]. Compared with the traditional theoretical analysis mode and experimenttal measurement mode, CFD is superior in adaptability and applications. Nowadays, the widely used CFD softwares consist of Fluent, Phoenics, Airpak, etc. Here we choose Airpak as a research tool. Airpak is a professional software which is applied to the HVAC field for engineers, architects and designers, it can simulate the air flow, air quality, heat transfer, pollution and comfort of ventilation system accurately. It provides the model of forced convection, natural convection, mixed convection, heat conduction, fluid and solid coupling heat transfer, thermal radiation and turbulence, and computes with the world’s most power CFD solver Fluent. Based on limited volumetric method, it supports the tetrahedron, hexahedron and mixed grid [8] as its automatic unstructured, structured mesh generation capacity.
CFD software usually includs three modules: preprocessing, computeanresult and postprocessing [9]. Fluid flow control equation has mass, momentum, energy, and species mass conservation equation, and each control equation can be expressed as follows:
1) The mass conservation equation:
 (1)
(1)
2) The momentum conservation equation:
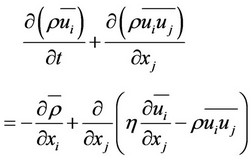 (2)
(2)
In the formula: p—static pressure, η—fluid dynamic viscosity, λ—the thermal conductivity of the fluid.
3) The energy conservation equation:
 (3)
(3)
In the formula: λ—the thermal conductivity of the fluid, Sh—the inner heat source of fluid, —dissipation function [10], its calculation is as follows:
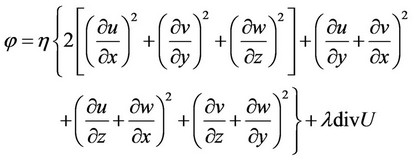 (4)
(4)
4) к equation:
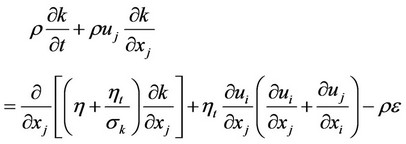 (5)
(5)
5) ε equation:
 (6)
(6)
In the formula: η1—turbulent viscosity coefficient, c1, c2, c3—constant, σκ, σε—κ, ε turbulent Prandtl number [11]. κ-ε simulation coefficients are as follows: C1ε = 1.44, C2ε = 1.92, C3ε = 1, Cμ = 0.09, σκ = 1.0, σε = 1.3.
4. THE SIMULATION RESULTS ANALYSIS
4.1. Displacement Ventilation (Low Speed Floor Air Supply) Condition
Figures 2 to 8 present the simulating results under the condition of displacement ventilation: The wind velocity vectors, wind velocity nephogram and the pollutants benzene concentration distributions at 2 m, 3 m, 4 m section.
Figure 2. The wind velocity vector at Z = 2 m.

Figure 3. The wind velocity nephogram at Z = 2 m.

Figure 4. The wind velocity nephogram at Z = 3 m.
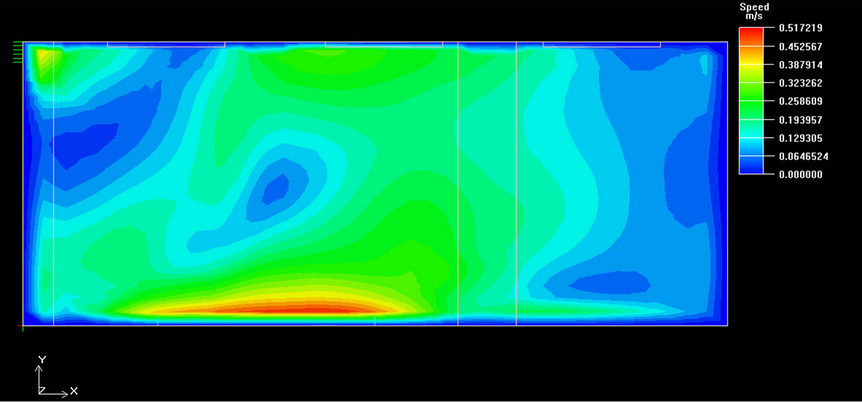
Figure 5. The wind velocity nephogram at Z = 4 m.

Figure 6. The pollutants benzene concentration distribution at Z = 2 m.

Figure 7. The pollutants benzene concentration distribution at Z = 3 m.

Figure 8. The pollutants benzene concentration distribution at Z = 4 m.
4.2. Up-In and Up-Out Ventilation Mode
Figures 9 to 15 are under the condition of up-in and up-out ventilation: The wind velocity vectors, wind velocity nephogram and the pollutants benzene concentration distributions at Z = 2 m, 3 m, 4 m section. We will compare horizontal results in the same ventilation mode with vertical results in the different ventilation models).
From Figures 2 to 3, we can see that a huge scroll airflow is formed at Z = 2 m and the higher wind velocity (V ≈ 0.5 m/s) mainly concentrated near the floor (the entrance to the air). Figures 9 and 10 are the similar situation, and the wind velocity mainly concentrated near the roof (In Figure 9, Vmax = 4.3 m/s; In Figure 10, Vmax = 0.87 m/s). According to the Vertical comparison of Figure 6 with Figure 13, the high concentration of pollutants benzene in displacement ventilation mode is only concentrated in a small area near the pollutant source, and the maximum concentration is only 0.53 g/m³. Most of blue areas, with the pollutant concentration lower than 0.46 g/m³, belong to the slight pollution or no pollution area. But the pollutants benzene diffusion range is quite large in up-in and low-out ventilation mode.
By making a Horizontal contrast of the wind velocity nephograms among Figure 3 (Z = 2 m), Figure 4 (Z = 3 m), Figure 5 (Z = 4 m), we may obtain a similar conclu-

Figure 9. The wind velocity vector at Z = 2 m.

Figure 10. The wind velocity nephogram at Z = 2 m.

Figure 11. The wind velocity nephogram at Z = 3 m.
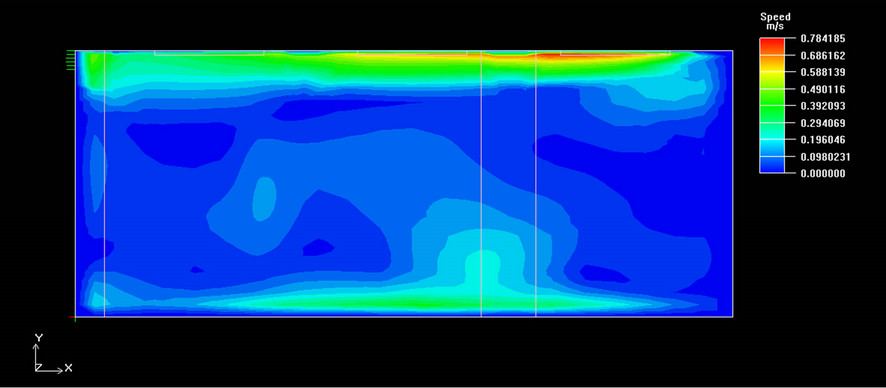
Figure 12. The wind velocity nephogram at Z = 4 m.

Figure 13. The pollutants benzene concentration distribution at Z = 2 m.
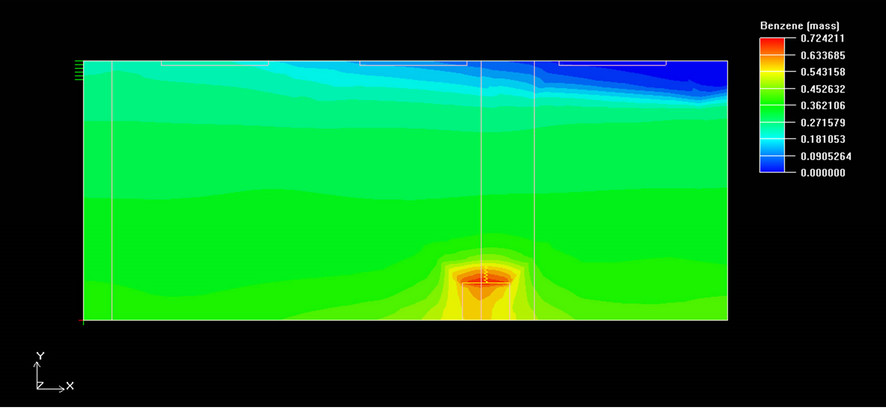
Figure 14. The pollutants benzene concentration distribution at Z = 3 m.
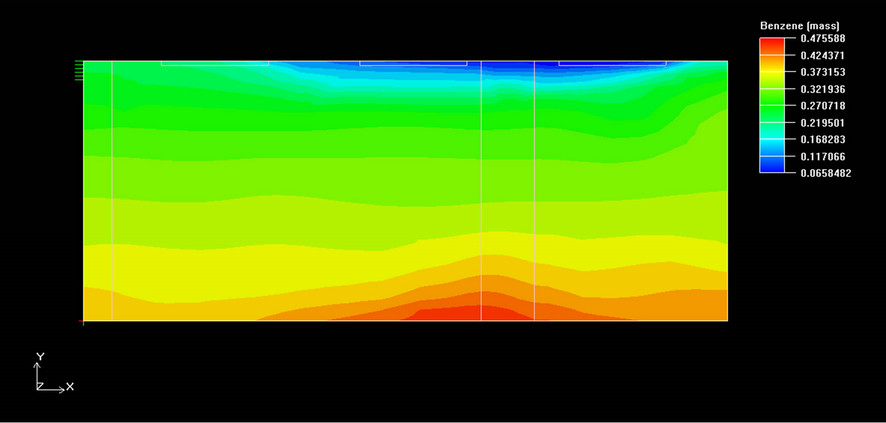
Figure 15. The pollutants benzene concentration distribution at Z = 4 m.
sion of the distributions wind velocity nephongram: the maximum velocity is about 0.5 m/s, Medium wind velocity in the middle area, and low wind velocity distribute on both sides. By a Horizontal contrast of wind velocity nephongram of the room top among Figure 10 (Z = 2 m), Figure 11 (Z = 3 m) and Figure 12 (Z = 4 m), the distributions of high wind velocity is basically same. The maximum velocity of the three sections separately are 0.87 m/s, 1.0 m/s and 0.78 m/s. Because of the influence of heat source (printer), the cyan area (medium wind velocity area) trends to be larger. Displacement ventilation mode is more uniform than up-in and up-out mode by the Vertical contrast of the wind velocity distribution.
By the Horizontal contrast of the benzene concentration distributions, the result of Figure 6 (Z = 2 m), Figure 7 (Z = 3 m) and Figure 8 (Z = 4 m) are basically similar. The high concentration of pollutants benzene only concentrate in a small area near pollution source (The highest concentration of pollutants of three sections are 0.53 g/m³, 0.76 g/m³, and 0.54 g/m³). And the pollutants can efficiently discharge to the outdoor. Horizontally compare the pollutants benzene concentration dis tributions of Figure 13 (Z = 2 m) with Figure 14 (Z = 3 m) and Figure 15 (Z = 4 m), the pollutants diffusion areas are similar, but the high concentrations of pollutants benzene distribution areas are different. The high concentrations of pollutants benzene distribution areas of Figure 13 (Z = 2 m) and Figure 15 (Z = 4 m) are located at the bottom of the room (At the height range of 0 - 1.0 m, the Pollutant concentration concentrated in 0.40 - 0.46 g/m³). In Figure 14 (Z = 3 m), the high concentrations of pollutants benzene distribution are located near the pollutant source (the highest concentration of pollutant is 0.72 g/m³). For the Vertical contrast, displacement ventilation is better than up-send and up-out ventilation on the aspect of eliminating the indoor pollutants.
Displacement ventilation mode is much better than upsend and up-out ventilation mode in disposing indoor pollutions, as entrance port and air vents in up-send and up-out ventilation mode are concentrated at the bottom. Although its influence to staff work area is smaller, most of the incident airflow has been drained away from air vents without entering the room at the bottom, which causes the incident airflow can not fully mixed with the indoor airflow, can not make heat exchange and bring in the indoor pollutants, then more and more pollutions are concentrated on the bottom of indoor.As the concentration become higher, it affects people’s physical and mental health, just as we called “Air conditioning disease.
5. CONCLUSION
By contrasting experimental simulation, we found that displacement ventilation mode can create an ideal velocity field, temperature field for personnel activity area, improve indoor thermal comfort efficiently [12], and can improve the indoor air quality as well. Therefore, compared with traditional up-send and up-out central airconditioning, displacement ventilation is faster, healthier and more efficient, comfortable, especially in terms of “health”. We found the reason of “air-conditioning disease” induced by traditional air conditioning by simulation, while the new style of displacement ventilation airconditioning can solve this problem efficiently [13]. But some problems are still exist, such as: initial high investment, complex construction technology, etc. Considering the future daily application, its advantages can significantly reduced the costs used in future, therefore, it’s necessary to promote the healthy and comfort air-conditioning system.
6. ACKNOWLEDGEMENTS
This work was financially supported by Shanghai science and technology commission (funding issues No.11230705500) and granted approval by the Patent Administration Department under the State Council of P.R.C. on Two Invention Patent Projects (Patent No.ZL2010 1 0223058.4 and ZL 2007 1 0038310.2).
REFERENCES
- Li, Y. (2010) The application of CFD technology in analysis of residential wind environment. Journal of Urban Technology, 12, 67-81.
- Feng, Q. (2010) Research of the air-conditioning system with CPCP& DOAS via CFD. Residential Technology, 30, 12.
- Lin, Z., Chow, T.T., Fong, K.F, et al. (1999) Validation of CFD model for research into application of displacement ventilation to Hong Kong buildings. In: Zhao, R.Y. and Burnet, J., Eds., ISHVAC, 99: 3rd International Symposium on Heating Ventilation and Air Conditioning, 1-2, 602-613.
- Fletcher, C.A.G., Mayer, I.F., Eghlimi, A. and Wee, K.H.A. (2001) CFD as a building services engineering tool. Architectural Science, 2, 67-81.
- Peter, R. and Gao, S.N. (1998) Numerical study of heat transfer from an impinging jet. Heat and Mass Transfer, 40, 671-680.
- Jiao, J.J., Gong, G.C. and Shao, C.S. (2008) The numerical simulation of the indoor air environment quality from air flow organization. Heating, Ventilation, and Air Conditioning, 19, 270-275.
- Long, W.D. (1999) Try to talk about the energy efficiency of buildings in the new ideas. Heating, Ventilation, and Air Conditioning, 29, 32-35.
- Tang, G.F., Lv, W.H. and Wang, H.Q. (1989) The numerical calculation and model experiment of indoor airflow. Hunan University Press, Changsha.
- Xu, L., Weng, P.F. and Sun, W.M. (2003) The indoor airflow organization and indoor air quality’s numerical analysis of three ventilation modes. Journal of Air Dynamics, 21, 311-319.
- Yang, Y.R. (2002) Indoor air ventilation efficiency of the three-dimensional numerical analysis. Architecture and Urban Planning of Chongqing University, 3-5.
- Tao, W.Q. (1988) Numerical heat transfer. Jiaotong University Press, Xi’an, 18-19.
- Yuan, L.L. and Liu, B. (2010) The research of indoor air quality under different ventilation modes. Heating, Ventilation, and Air Conditioning, 40, 1-3.
- Ni, B. (2000) Experimental study of displacement ventilation. Heating, Ventilation, and Air Conditioning, 30, 2-4.
NOTES
*The WenYuan Building of Tongji University built in 1953, was designed by Yulin Huang and Ha Xiongwen, teachers of department of architecture for Tongji University. By the reasonable building layout and concise appearance, it has won the award for Outstanding Architectural Design of China Architectural Society, selected as a member of the Shanghai classic architecture during new China 50 years, it is also known as the first modernist architecture in China. In 2005, it was selected by the fourth batch of Shanghai outstanding historical buildings list.