Applied Mathematics
Vol. 3 No. 7 (2012) , Article ID: 19992 , 5 pages DOI:10.4236/am.2012.37118
A Comparison of Two Test Statistics for Poisson Overdispersion/Underdispersion
1Department of Biostatistics and Computational Biology, University of Rochester, Rochester, USA
2Department of Biostatistics & Bioinformatics, Rollins School of Public Health Winship Cancer Institute, Emory University, Atlanta, USA
Email: *feng@bst.rochester.edu
Received May 1, 2012; revised June 1, 2012; accepted June 8, 2012
Keywords: Poisson Distribution; Over-Dispersion; Asymptotic Relative Efficiency
ABSTRACT
Within the family of zero-inflated Poisson distributions, the data has Poisson distribution if any only if the mean equals the variance. In this paper we compare two closely related test statistics constructed based on this idea. Our results show that although these two tests are asymptotically equivalent under the null hypothesis and are equally efficient, one test is always more efficient than the other one for small and medium sample sizes.
1. Introduction
The Poisson distribution is the standard model for counting data, for example, the number of telephone calls within a specific time period [1]. One stringent condition for the Poisson distribution is that the mean equals variance. However, in practice, many counting data show some overdispersion, i.e. the variance is greater than the mean value. The Zero-inflated Poisson (ZIP) distribution [2] and the negative binomial distribution [3,4] have been proposed to catch this overdispersion in practical data. The ZIP and it’s related regression methods have been developed and used in many different areas, such as substance use [5], microbiology [6,7], psychology [8], health information management [9], dentistry [10], transportation engineering [11], and manufacturing [2].
Many tests have been proposed to test the overdispersion in counting data [1,6,12-19]. El-Shaarawi [6] compares the properties of the likelihood ratio test, the Cochran test [13], and the Rao test [17]. His simulation result indicates that the likelihood ratio is always the best to keep the significance level in the cases of small or medium sample sizes. However, the Cochan and Rao tests are much more powerful than the likelihood ratio test in those cases.
In the Zero-inflated Poisson (ZIP) distribution an extra proportion of zeros is added to the probability of zeros in the Poisson distribution. Suppose that , where Z and V are independent variables with
  and
and  . Then X has the zero-inflated Poisson distribution. Note that
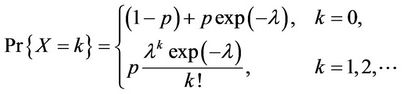 (1)
(1)
The mean and variance of X are
 (2)
(2)
Remark 1. Although in the definition of ZIP distribution, the parameter p in the Bernoulli distribution is required to be in , formula (1) always define a valid probability distribution as long as
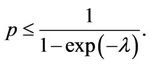 (3)
(3)
This means that p can be greater than 1. For example, when ,
,  , formula (1) still defines a valid probability distribution. The formulas for mean and variances in (mean) still hold as long as (3) is true. The valid range of
  is the range below the curve in Figure 1.
Remark 2. The distribution in (1) can introduce both overdispersion and underdispersion.
1) if , then
 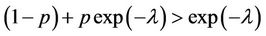 and
and  (over dispersion).
2) if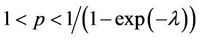 , then

Figure 1. The range of p and λ.
 and
and  (under dispersion).
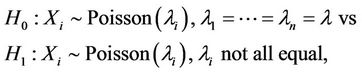
Since the Poisson distribution is a special case of the distribution defined in (1), the likelihood ratio test (LRT) is a natural choice for testing the hypotheses
 (4)
(4)
which is equivalent to

To construct LRT, we need to estimate two parameters  and p. There are no closed form solutions for the score equation. Some iteration methods are called for the solution. Secondly, under the null hypothesis, the parameter p is on the boundary of the parameter region.
Many other methods have been proposed to test the hypotheses in (4). See, for example, [12] and [19]. Brown and Zhao [1] studied the hypotheses of the form
and compared the behavior of their newly developed test with likelihood ratio test and several other tests. Feng et al. [14] derived the asymptotic distribution of the likelihood ratio test defined in [1] and corrected an error in that paper.
In this paper we construct two nonparametric test statistics and compare the efficiency, the empirical size, and power of two closely related tests, especially for the cases of small and medium sample sizes.
2. Test Statistics
From (1) we know that the data is from Poisson if and only if . We can construct a test to study the difference between the sample mean and sample variance. Suppose
 , is a random sample. Let
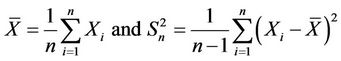
be the sample mean and sample variances, respectively. Simple algebra shows that
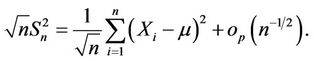
Therefore
Let . Under the null hypothesis
From central limit theorem,
 (5)
(5)
The asymptotic result in (5) still holds with  replaced by a consistent estimator of
 .
.
Under the null hypothesis, both  and
and  are consistent estimators of
 . In fact,
  is the MLE of
  under
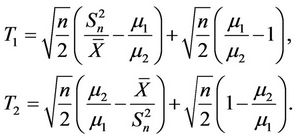
under . Based on this idea, we define two test statistics
 (6)
(6)
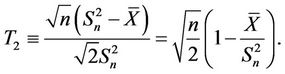 (7)
(7)
Since the exact variance of  is
is  [Bo], the test statistic proposed by Böhning [12] is

which is asymptotically equivalent to . This test is also called Neyman-Scott test in [1].
In the next section we study the relative efficiency of  and
and  and compare their empirical size and power for small and medium sample sizes.
3. Comparison of T1 and T2
Note that algebraically these two tests satisfy the relation
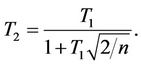
If  or
or , then
 . Otherwise
 .
.
In this section we study the Pitman asymptotic relative efficiency (ARE) of  with respect to
 . The ARE is a large sample property of a test statistic. We also compare the empirical sizes and powers of these two test statistics by simulations for the cases of small and medium sample sizes if the asymptotic distributions are used in those cases.
3.1. Relative Efficiency
In this subsection we study the Pitman efficiency of  with respect to
 . Note that
Let
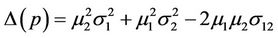
and
 (8)
(8)
The asymptotic variances of  and
and  are
are

respectively. The Pitman efficiency of  with respect to
  is
is

This means that these two test statistics have the same efficiency in the large sample case.
3.2. Empirical Sizes and Powers
In this part we compare the empirical sizes and powers by simulations when the asymptotic distributions of  and
and  are used in the cases of small and medium sample sizes. The theoretical significance level is set at 0.05. We compare
  and
and  for different p and
 . Table 1 shows the simulation results (from 100,000 Monte Carlo repetitions).
Empirical size: Except for very small  (for example,
 ), the empirical size of
  is very close to the theoretical significance level, even when
 . On the other hand, the empirical size of
  is far away from the theoretical value. For example, when
 , the empirical size of
  is 0.03 even when
 . When
 , 2 and 5, the empirical sizes of
  are well above the theoretical value for sample size
 .
.
Empirical Power: As p decreases, the distribution goes far and far away from the Poisson distribution. The powers of these two test statistics increase as p decreases. However, the power of  increases much faster than that of
 . For example, when
 ,
,  and
and , the powers are 0.519 and 0.297, respectively. When
 ,
,  and
and , the powers are 0.498 and 0.337, respectively.
The simulation results show that although these two test statistics are asymptotically equivalent under , and have the same efficiency in the large sample case,
  is more efficient than
  in the small and medium sample cases.
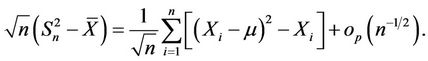
Since
 (9)
(9)
we also compare the behave of

with  and
and  (not reported here). We find that
  is very similar to
 . This means the remainder term in (9) plays a very significant role in the cases of small and medium sample sizes.
4. Real Data Study
In this section, we apply these two test statistics to four real data sets. These data sets have sample sizes from relatively small n = 44 to relatively large n = 539. The results are summarized in Table 2.
Example 1: This data set is used in [1]. It contains the number of daily calls for standard services between 4:30 pm to 4:45 pm in an Israel call center within 44 consecutive days. More information about this data set can be found in Section 2 of [1]. We want to test if the data has a Poisson distribution. Here we assume that the number of calls from different days are independent. The sample mean and sample variances are 18.66 and 25.95. The p-value of  is 0.07, which shows marginally significant overdispersion of the data. This is consistent with our impression. See Figure 2 in [1] for the histogram of the data. However, the p-value of
  is 0.19.
Example 2: This is another data set used in [1]. It contains the number of daily calls for internet services between 4:30 pm to 4:45 pm in an Israel call center within 107 consecutive days. Here we also assume that the number of calls from different days are independent. The sample mean and sample variances are 2.18 and 2.47. The p-values of  and
and  are 0.33 and 0.39, which show the Poisson distribution is a good approximation for the data. This is consistent with our impression. See Figure 1 in [1] for the histogram of the data.
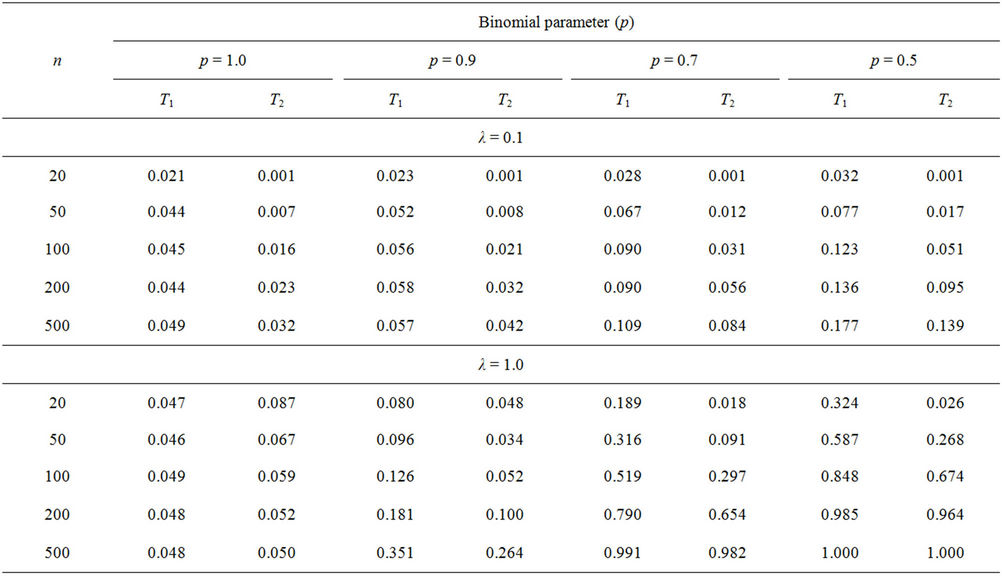
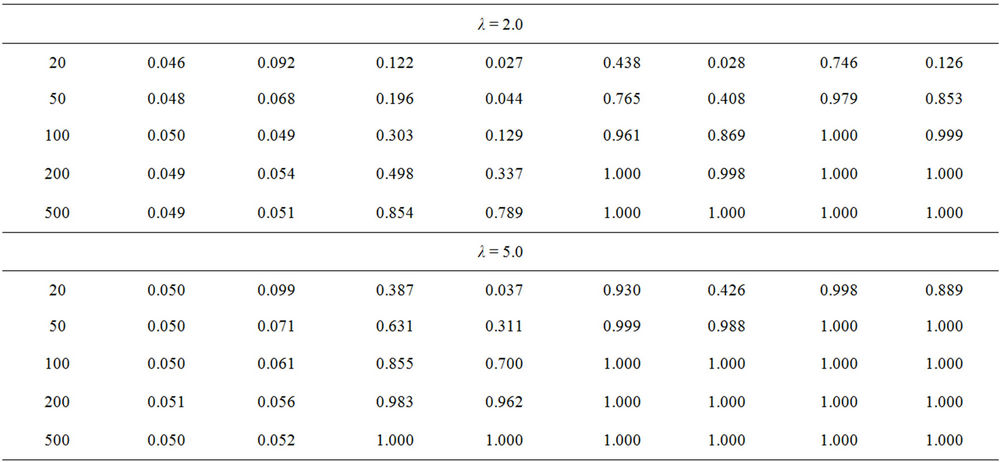
Table 1. Power comparison of T1 and T2. Results were obtained from 100,000 MC replications.
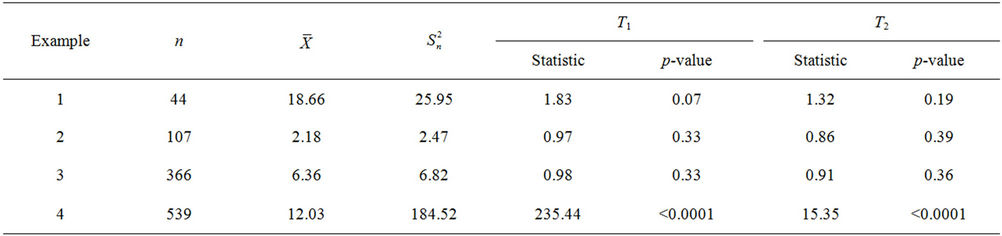
Table 2. Results from real data.
Example 3: This data set is reported in [12]. It contains the number of daily deaths of women with brain vessel disease during the year 1989 in West Germany. The sample mean and sample variances are 6.36 and 6.82. The p-values of  and
and  are 0.33 and 0.36, which shows the Poisson distribution is a good approximation for the data.
Example 4: This data is from a HIV prevention study finished at the University of Rochester School of Nursing. The study participants were 621 sexually active girls of ages 15 - 19 years. For more details about the study, please refer to [7]. One of the primary outcomes is the number of unprotected vaginal sex over the past 3 months. After 3 months of intervention, the number of unprotected vaginal sex wase available for 539 girls. The sample mean and sample variances are 12.03 and 184.52. Although both tests show very significant over-dispersion for the data set (p-values < 0.0001), the values of the test statistics are very significantly different with T1 = 235.44 and T2 = 15.35. This phenomena can also be seen from (means) as  can be arbitrarily large, while
  is bounded above by 1.
5. Discussion
In this paper we compare two test statistics which can be easily used to test the Poisson distribution versus the zero-inflated Poisson distributions. Both test statistics are asymptotically equivalent under null hypothesis and the relative Pitman efficiency is 1. However, they have very significantly different behaviors for small and medium sample sizes. While T1 always has reasonable empirical size (under null hypothesis) and power (under alternative hypothesis) for small and medium sample sizes, T2 shows some erratic behaviors even for medium sample sizes and may lead to wrong conclusion in practice (example 1). Therefore we should never use it in practice.
REFERENCES
- L. D. Brown and L. H. Zhao, “A Test for the Poisson Distribution,” Sankhyā, Vol. 64, pp. 611-625
- D. Lambert, “Zero-Inflated Poisson Regression Models with an Application to Defects in Manufacturing,” Technometrics, Vol. 34, No. 1, 1992, pp. 1-14. doi:10.2307/1269547
- R. A. Fisher, “The Negative Binomial Distribution,” Annals of Human Genetics, Vol. 11, No. 1, 1941, pp. 182- 187. doi:10.1111/j.1469-1809.1941.tb02284.x
- G. J. S. Ross and D. A. Preece, “The Negative Binomial Distribution,” The Statistician, Vol. 34, No. 3, 1985, pp. 323-336. doi:10.2307/2987659
- S. M. DeSantis and D. Bandyopadhyay, “Hidden Markov Models for Zero-Inflated Poisson Counts with an Application to Substance Use,” Statistics in Medicine, Vol. 30, 2011, pp. 1678-1694. doi:10.1002/sim.4207
- A. El-Shaarawi, “Some Goodness-of-Fit Methods for the Poisson Plus Added Zeros Distribution,” Applied and Environmental Microbiology, Vol. 49, 1985, pp. 1304-1306.
- Y. Xia, D. Morrison-Beedy, J. Ma, C. Feng, W. Cross and X. M. Tu, “Modeling Count Outcomes from HIV Risk Reduction Interventions: A Comparison of Competing Statistical Models for Count Responses,” AIDS Research and Treatment, Vol. 2012, 2012, Article ID 593569. doi:10.1155/2012/593569
- T. Loeys, B. Moerkerke, O. De Smet, et al., “The Analysis of Zero-Inflated Count Data: Beyond Zero-Inflated Poisson Regression,” British Journal of Mathematical and Statistical Psychology, Vol. 65, No. 1, 2012, pp. 163- 180. doi:10.1111/j.2044-8317.2011.02031.x
- A. Khan and M. Western, “Does Attitude Matter in Computer Use in Australian General Practice? A Zero-Inflated Poisson Regression Analysis,” Health Information Management Journal, Vol. 40, 2011, pp. 23-29.
- B. T. Pahel, J. S. Preisser, S. C. Stearns, et al., “Multiple Imputation of Dental Caries Data Using a Zero-Inflated Poisson Regression Model,” Journal of Public Health Dentistry, Vol. 71, No. 1, 2011, pp. 71-78. doi:10.1111/j.1752-7325.2010.00197.x
- S. R. Hu, C. S. Li and C. K. Lee, “Assessing Casualty Risk of Railroad-Grade Crossing Crashes Using ZeroInflated Poisson Models,” Journal of Transportation Engineering-ASCE, Vol. 137, No. 8, 2011, pp. 527-536. doi:10.1061/(ASCE)TE.1943-5436.0000243
- D. Böhning, “A Note on a Test for Poisson Overdispersion,” Biometrika, Vol. 81, No. 2, 1994, pp. 418-419. doi:10.1093/biomet/81.2.418
- W. Cochran, “Some Methods of Strengthening χ2 Tests,” Biometrics, Vol. 10, No. 4, 1954, pp. 417-451. doi:10.2307/3001616
- C. Feng, H. Wang and X. M. Tu, “The Asymptotic Distribution of a Likelihood Ratio Test for the Poisson Distribution,” Sankhyā, 2012 (in press)
- C. S. Li, “A Lack-of-Fit Test for Parametric Zero-Inflated Poisson Models,” Journal of Statistical Computation and Simulation, Vol. 81, No. 9, 2011, pp. 1081-1098. doi:10.1080/00949651003677410
- C. S. Li, “Testing the Lack-of-Fit of Zero-Inflated Poisson Regression Models,” Communication in StatisticsSimulation and Computation, Vol. 40, No. 4, 2011, pp. 497-510. doi:10.1080/03610918.2010.546541
- C. Rao and I. Chakravarti, “Some Small Sample Tests of Significance for a Poisson Distribution,” Biometrics, Vol. 12, No. 3, 1956, pp. 264-282. doi:10.2307/3001466
- J. Van den Broeck, “A Score Test for Zero Inflation in a Poisson Distribution,” Biometrics, Vol. 51, 1995, pp. 738- 743.
- O. Thas and J. C. W. Rayner, “Smooth Tests for the ZeroInflated Poisson Distribution,” Biometrics, Vol. 61, 2005, pp. 808-815. doi:10.1111/j.1541-0420.2005.00351.x
NOTES
*Corresponding author.