Advances in Bioscience and Biotechnology
Vol.2 No.4(2011), Article ID:6871,4 pages DOI:10.4236/abb.2011.24045
Evaluation of the trophic state in Vilun lagoon
![]()
1Department of Physics, University of Vlora, Vlora, Albania;
2Department of Biotechnology, University of Tirana, Tirana, Albania.
Email: v.cako69@hotmail.com
Received 1 July 2011; revised 25 July 2011; accepted 1 August 2011.
Keywords: Chlorophyll; Phytoplankton; Trophic State; Vilun Lagoon; Water Quality
ABSTRACT
In this paper we present the evaluation of trophic state of lagoon aquatic ecosystems connected to the Adriatic Sea. Vilun lagoon is one of these lagoons in Albania. It is one of the most important ecosystems in the country. For trophic state evaluation, spectrophotometry methods of absorption, as well as turbidimetry ones are applied. This ecosystem is monitored for a year from April to October. The evaluation of trophic state is based on these four indicators: the containment of chlorophyll a in phytoplankton; the distribution of photosynthetic pigments; water turbidity and phosphorus containment in water. The monitoring process is performed in different areas of the lagoon, in order to be able to make a more characteristic evaluation of trophic state. All selected areas of Vilun lagoon show a reasonable level of trophic state, which is characterized such as being mezotrophic. Changes related to trophic level are observed during the monitoring period, in each and all the selected areas. Furthermore, changes in the distribution of chlorophylls and their relative content between selected areas are observed.
1. INTRODUCTION
Chlorophyll a, total phosphorus, total nitrogen and water transparency are used as indicators for measuring the “biological product” of water. Monitoring of ecosystems’ water bodies based on these four indicators, allows the classification of trophic state. The need for a complex system development of organic and inorganic indicators for a more complete study and dynamic monitoring of lagoons’ trophic state, is emphasized in the fourth European Conference of Ministers of Environment (July 1998, Denmark), and in the technical reports of the European Environment Agency and European Council. The system of indicators is used to create a clear view of the lagoons’ trophic state, which are ecosystems with high biodiversity, and furthermore presenting the dynamics of environmental changes (progressive or regressive). Trophic states are classified in four levels; from the lowest to the highest level of biological product. These four levels are:
Oligotrophic lake which is with clear blue color water, with very low nutrients and algae values; mesotrophic lake with a slightly green color water, still clear, and with average nutrients and algae levels; eutrophic lake with green and opaque (unclear) water and with high nutrients and algae values and hypertrophic Lake wich is characterized by an obvious lack of phosphorus and nitrogen, as well as a major development of phytoplankton and a low water transparency.
Eutrophication is the result of fresh water reduction, organic and inorganic pollution and a poor sea waterlagoon communication and the erosion [1]. Algae cells are very simply determined by chlorophyll content measurement in water. Chlorophylls are green pigments that capture the energy of solar radiation, and transfer it to other molecules for the photosynthesis process. Chlorophyll a is the main chlorophyll family pigment (chlorophyll a, b, c), and its concentration is considered as an evaluator of phytoplankton biomass. Meanwhile, based on the trophic state, (Hakanson, 1994) chlorophyll serves to classify the water bodies as oligotrophic (<2.5 mg/m3), mesotrophic (2.5 - 8 mg/m3), eutrophic (8 - 25 mg/m3) and hypertrophic (>25 mg/m3). Chlorophyll a is an indicator of total amount of algae in a lagoon. The high values of algae in a lagoon lead to: reduction of water transparency, water color change (making it green), forming foams on water surface, and changes in water pH.
2. THE METHODOLOGY USED
Vilun lagoon, one of the most important ecosystems, was monitored from April to October 2009. Monitored areas in this lagoon were selected to show up various areas of lagoon water communication with the sea and with the fresh water of rivers as well as the possibilities for lagoon’s water flow that can determine the pollution level. The content of chlorophyll a, b, and c is identified according to the extraction tricromatic method in acetone, and equations used are based on the absorption maximum of each component (according to Jeffrey and Humphrey coefficients) [2]. The measurement of the chlorophyll a contentis used for assessing total phytoplankton biomass (common practice in monitoring surveys). Other pigments may be useful for assessing biomass of particular types of algae. The distribution of accessory pigments in the algae groups is quite unique [1,3]. All absorbance values are corrected according to the turbidity of acetone extract [3].
The phosphorus content is determined by the spectrophotometry method, based on the standart curve constructed by the solutions with know concentrations [4].
3. RESULTS AND DISCUSSION
In Vilun Lagoon, a survey was conducted in the exactly same area during 2004-2005. This monitoring was conducted with the aim to see the evolution of the trophic state of the lagoon water ecosystem.
Vilun (Velipojë)—four areas Coord. GPS:
Zone. 1—41˚52′09.6″N; 019˚26′42.3″E
Zone. 2—41˚52′05.2″N; 019˚27′03.6″E
Zone. 3—41˚52′00.8″N; 019˚27′05.1″E
Zone. 4—41˚51′46.4″N; 019˚26′53.3″E
The trophic states of Vilun Lagoon areas is characterized by the same trophic level. In 2009, the level of Vilun Lagoon is characterized as mesotrophic. In early April 2009 in four selected areas, Vilun Lagoon is characterized by a mesotrophic state, [5] showing up a higher level in area number 1, which is the zone that is located farther away from the place of sea communication. In May in 2, 3, 4 areas a low level of trophic state reching a oligotropic state is observed. In area 1 again a mesotrophic state is observed but lower than before. Among the three areas that are characterized by oligotrophic level, area number 2 has a higher trophic level and area number 3 a lower one. It is observed that at the beginning of the period of fitoplancton development in the area which is far from communication with the sea the amount of algae is very high. The results of the chlorophyll a presence spectrophotometric method in the Vilun lagoon from April to October are showm in (Table 1 and Figure 1).
Compared with two other years of monitoring in this lagoon in particularly in 2005, the same dynamics of the development of trophic state i.e mesotrophic and higher in area 1 is observed. In April, the trophic state in area 1 decreases but remains still mesotrophic (Table 2). In the
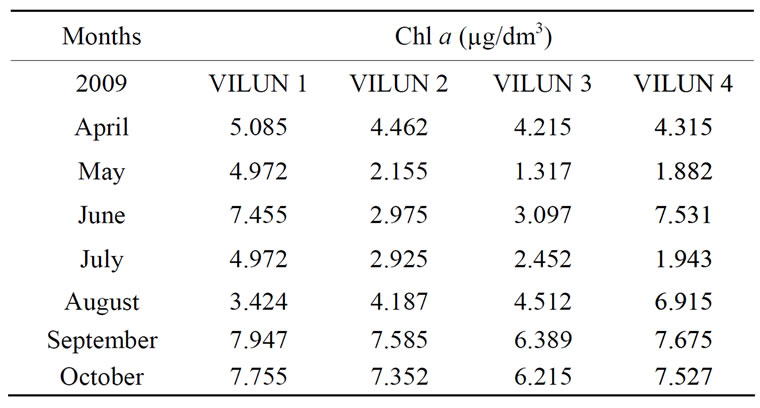
Table 1. Chlorophyll a content in phytoplankton of Vilun lagoon.
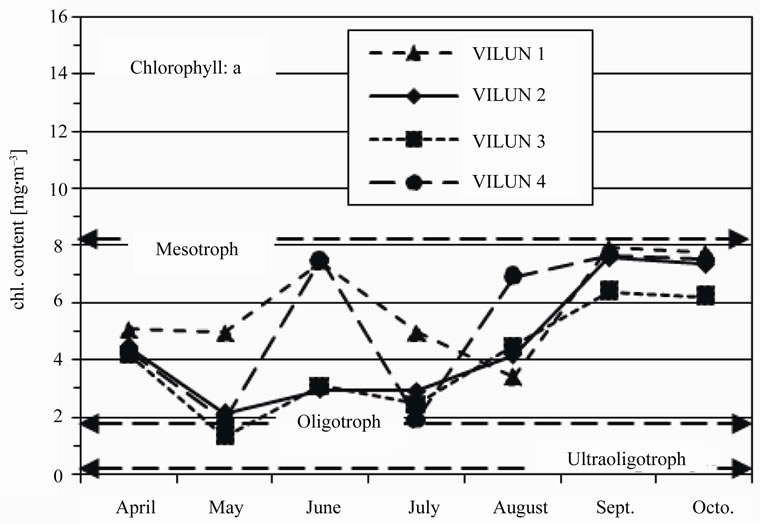
Figure 1. The variation chl.a content in the Vilun lagoon.
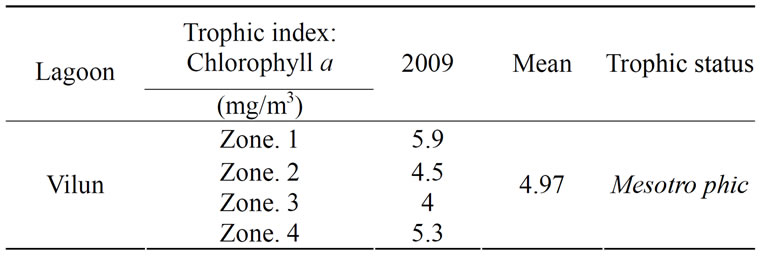
Table 2. Trophic status via phytoplankton Chl content of Vilun lagoon.
same time it is observed that the trophic state in area 2 which is near the beach during September and October increases and is characterized as mesotrophic.
The distribution of photosynthetic pigments in algae group is characteristic for every aquatic ecosystem [6]. Chlorophyll types are characteristic for every single phytoplankton family and they can serve as taxonomic biomarker of phytoplanktonic organisms. Distribution of chlorophyll a and other supportive pigments shows discrepancies in monitored areas of the lagoon. The relative content of chlorophyll a and chlorophyll b presents higher values in areas 1 and 4 (especially in April and September-October), with respective average values 27.59 and 30.67 (Table 3). These high values demonstrate the highest content of algae Cyanophyceae indicating a higher eutrophication [7] in these station as was evaluated by chloropyll content too (Table 1).
Based on the phosphorus content in lagoon’s water the trophic state of Vilun lagoon is characterized as ologotrophic (Table 4). The highest amounts of phosphorus are registered in areas 1 and 3 in August; the respective amounts (5 mg/m3) and (5.9 mg/m3). Trophic state evaluated based on the phosphorus and chlorophyll content, confirms same variations. As a result we can say that a great amount of phosphorus causes a greater algae development thus reducing water transparency.
In general, water checked in Vilun lagoon are transparent as it is shown by low levels of their turbidity. Low level turbidity values or high water transparency is connected with trophic states of waters in this lagoon during the monitoring period. In Vilun Lagoon, area 3 is characterized by a less turbidity water than in three other areas (Table 5 and Figure 2" target="_self"> Figure 2), but the trophic level in this area also appears to be lower, compared to the level of three other areas [8-12].
4. CONCLUSIONS
The trophic state of Vilun Lagoon was evaluated based on the survey conducted from April to October 2009. According to this survey we conclude that:
• Based on chlorophyll content, the trophic state in
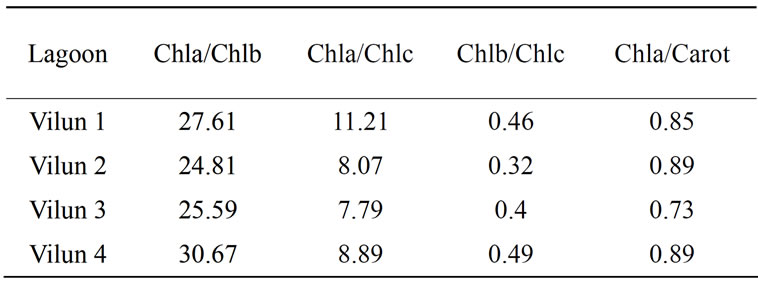
Table 3. Relative content of pigments of Vilun lagoon.
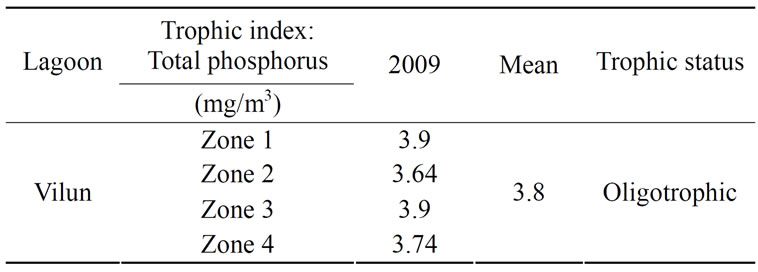
Table 4. Total phosphorus content on the water of Vilun lagoon.
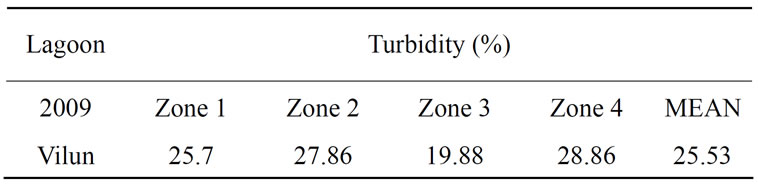
Table 5. Turbidity of water of Vilun lagoon.
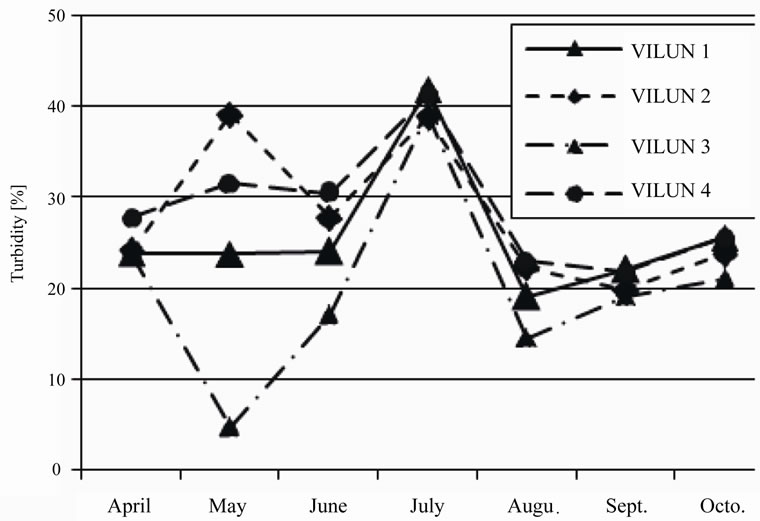
Figure 2. Variation of water turbidity of Vilun lagoon.
Vilun lagoon is characterized by mesotrophic level.
• Relative chlorophylls content exhibited differences through monitored areas of lagoon. The observed high values in Vilun lagoon demonstrate the high content of Cyanophyceae indicating a higher eutrophication as was evaluated by chloropyll content.
• Based on Hakanson criterion for the phosphorus content in the Vilun aquatic ecosystem, the trophic state is characterized by a oligotrophic level.
• The turbulence value in three monitored areas, show small changes, with the only exception which is area 3.
The variation of trophic state of the selected stations of Vilunn lagoon is obviously related to the communication sea—agoon, freshwater supplies, water circulation of lagoon and pollutions. The results on evaluation of trophic level based on the selected indicators of all monitored areas in this water ecosystem demonstrate evidently the impact of the above factors.
REFERENCES
- Ston, J. and Kosakowska, A. (2000) Qualitative and quantitative analysis of Baltic phytoplankton pigments. Oceanologia, 42, 449-471.
- Jeffery, S.W. and Humphrey, G.F. (1975) New spectrophotometric equation for determining chlorophyll a, b, c1 and c2. Biochemie und Physiologie der Pflanzen, 167, 194-204.
- USEPA Method 446.0. (1997). In vitro determination of chlorophylls a, b, c1 + c2 and pheopigments in marine and freshwater algae by visible spectrophotometry. USEPA, Washington, DC.
- Sandres, R., Jickells, T. and Mills, D. (2001) Nutrientsand chlorophyll at two sites in the Thames plume and southern North Sea. Journal of Sea Research, 46, 13-28. doi:10.1016/S1385-1101(01)00068-5
- Hakanson, L. and Bryhn, A.C. (2008) Eutrophication in the Baltic Sea. Present situation, nutrient transport Processes, remedial strategies. Springer-Verlag, Berlin, 7.
- Schlüter, L., Mohlenberg, F., Havskum, H. and Larsen, S. (2000) The use of phytoplankton pigments for identifying and quantifying phytoplankton groups in coastal areas. Marine Ecology Progress Series, 192, 49-63.
- Vidal, M., Duarte, C.M. and Sanchez, M.C. (1999) Coastal eutrophication research in Europe: Progress and imbalances. Marine Pollution Bulletin, 38, 851-854. doi:10.1016/S0025-326X(99)00030-2
- Lorenzen, C. J. (1967) Determination of chlorophyll and phaeopigments: Spectrophotometric equations. Limnology and Oceanography, 12, 343-346. doi:10.4319/lo.1967.12.2.0343
- Lichtenthaler, H.K. (1987) Chlorophylls and carotenoids, the pigments of photosynthetic biomembranes. Methods in Enzymology, 148, 350-382. doi:10.1016/0076-6879(87)48036-1
- Jarry, V., Frisoni, G.F. and Legendre, P. (1991) Spatial organization of a lagoon phytoplankton population under marine and continental influences. Oceanologica Acta, 14, 473-488.
- Babani, F., Kongjika, E. and Mullaj, A. (2004) Photosynthetic pigments of phytoplankton of some Adriatic lagoons. Biological Studies, Tirana, 78-84.
- Gotsis, S.O. and Friligos, N. (1990) Contribution to eutrophication and Phitoplankton ecology in the Theramikos Gulf. Thalassographica, 13, 1-12.