Food and Nutrition Sciences
Vol.4 No.8A(2013), Article ID:35292,7 pages DOI:10.4236/fns.2013.48A018
Aged Vacuum Packaged Lamb Cuts Are Less Brown than Fresh Muscle Cuts under Simulated Retail Display
![]()
1Department of Primary Industries, Werribee, Australia; 2Department of Primary Industries, Rutherglen, Australia; 3NSW Department of Primary Industries, Beef Industry Centre of Excellence, University of New England, Armidale, Australia; 4Department of Primary Industries, Warrnambool, Australia; 5NSW Department of Primary Industries, Centre for Red Meat and Sheep Development, Cowra, Australia.
Email: eric.ponnampalam@dpi.vic.gov.au
Copyright © 2013 Eric N. Ponnampalam et al. This is an open access article distributed under the Creative Commons Attribution License, which permits unrestricted use, distribution, and reproduction in any medium, provided the original work is properly cited.
Received April 19th, 2013; revised May 19th, 2013; accepted May 27th, 2013
Keywords: Meat Colour; Vacuum Packaging; Brownness Formation; Redness Retention; Shelf Life; Antioxidant Status; Lamb
ABSTRACT
Fifty four, seven month old lambs, that had grazed perennial or annual pasture, were slaughtered and at 24 h post mortem m. longissimus lumborum samples were collected. Half of the fresh muscle section was sliced into three pieces and overwrapped with 15 micron polyvinyl chloride film and displayed under light (Lux = 1500) at 3˚C - 4˚C. The remainder of the muscle section was vacuum packaged and aged for 4 weeks at 3˚C, before slicing and display. Surface brownness and redness were measured over 3 days of simulated retail display. Aging in vacuum packs led to substantially less brownness and greater redness compared with fresh meat, over the entire three days of display. It was concluded that aging in vacuum packs could be a useful strategy for improving consumer acceptability of retail lamb in local markets, even where there is no logistical or transport need to extend the life of the meat.
1. Introduction
A large proportion of lamb (43%) and mutton (75%) produced from Australia is exported, to markets in North America, North Asia, the Middle East and Europe [1]. Most exported lamb is, after vacuum packaging, aged from 3 to 8 weeks in refrigerated conditions before being sliced and displayed at retail. On the Australian domestic market lamb is either sold at retail fresh (within as little as 24 h post-mortem) with no previous packaging or vacuum packed or subjected to modified atmosphere packaging and then sold after a period of ageing. This latter method is known to enhance colour stability [2], but there appears to be no data on how long term vacuum packed aged lamb compares to fresh lamb for colour stability measured in terms of brownness accumulation.
Previous studies have reported that aging in vacuum packs increases the redness of lamb [3,4] and beef [5], for at least the first few days of retail display or has no effect [6]. These are important findings because meat colour strongly influences a consumer’s decision to purchase meat. Consumers deem colour to be a visual measure of freshness and quality [7]. In support of this [8] stated that “attractiveness of the product, usually considered as redness, may have little relationship to the final assessment of the product as eaten, but it is usually the only criterion, other than cost, which influences the consumer in making a decision to purchase”. Thus, it may be desirable to age meat in vacuum packs even when there is no logistical reason to do so.
As meat ages, it becomes less red and this has been indicated by decline in a*-values [9,10], which measures the red to green contrast. However, change in the red/ green level is not the only colour change that occurs on the meat surface and over time the oxymyoglobin is converted to metmyoglobin [7,11] and consumers will reject brown meat that has high levels of metmyoglobin [12].
The current study investigates the surface brownness of meat during retail display from loin cuts stored for shorter (fresh) or longer (vacuum packaged) duration in lambs that have been grazed either on perennial pasture only or annual pasture with supplements. To compare with previous studies, results for redness are also presented.
2. Materials and Methods
2.1. Diets and Animals
The details of animal and feeding management are described elsewhere [13]. In brief, fifty four, seven-month old lambs of mixed gender were randomly allocated to one of four dietary treatment groups based on sex and liveweight. The initial liveweight of lambs used in this study was 28.8 - 39.6 kg. The treatments applied to lambs were: perennial pasture (PP); annual pasture with lucerne hay (alfalfa) and oat grain pellet supplement (AP); annual pasture with lucerne hay, oat grain and cracked flaxseed pellet supplement (AP + FS); annual pasture with lucerne hay, oat grain and flax meal pellet supplement (AP + FM). The experimental period lasted for 7 weeks with one week of introduction to supplements. The perennial pasture consisted of 50% lucerne (Medicago sativa L.), 35% phalaris (Phalaris aquatica L.) and 15% annual weed species (Vulpia spp., Rumex spp.), whilst the annual pasture consisted of 80% annual ryegrass (Lolium rigidum Gaud.), 5% subterranean clover (Trifolium subterraneum L.) and 15% annual weed species (Vulpia spp., Rumex spp.). Lambs on AP, AP + FS and AP + FM were offered 500 g of pellets daily for two weeks and 700 g of pellets daily for the remaining 5 weeks.
2.2. Slaughter Procedure and Muscle Sample Collection
At the end of the feeding period, the lambs were transported 300 km in two groups (27 lambs on 11 May 2009 and 27 lambs on 13 May 2009) to the Meat Research & Training Centre in Werribee, Australia, for slaughter and muscle sample collection. After a 12 h overnight fast, lambs were slaughtered on Tuesday (12 May 2009) and Thursday (14 May) in a non-systematic order. Lambs were allocated in equal numbers across treatments to slaughter groups. At 24 h post-mortem, when the average 24h pH values were 5.53 (PP) and 5.58 (annual pasture treatments), the entire loin muscle was removed from the left side of the carcase as reported previously [14]. The longissimus lumborum (LL) region was used for the assessment of surface brownness and redness of fresh and aged (vacuum packaged) meat under simulated retail display.
2.3. Assessment of Meat for Colour at Retail Display
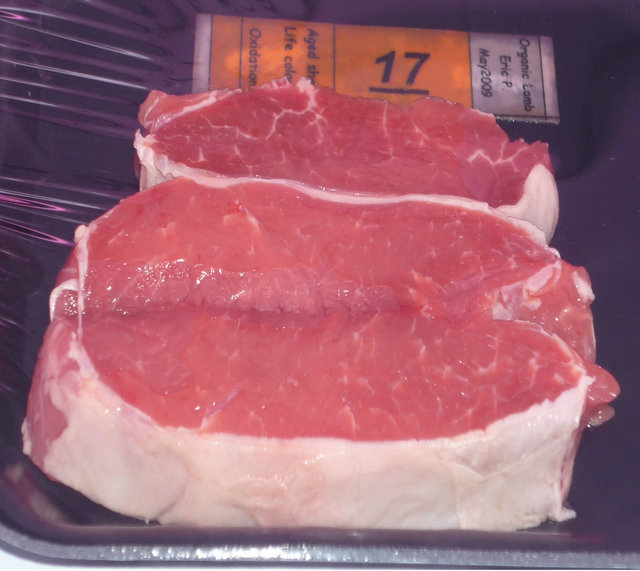
Half of each LL was cut into 3 slices (2.5 cm thickness) and these were placed on a plastic tray, over-wrapped with 15 micron polyvinyl chloride (PVC) film and displayed under refrigerated conditions (~3˚C - 4˚C) with fluorescent lights set at 1500 Lux. The surface colour of each of the three slices of meat was measured at days 1, 2, 3 and 4 post-slaughter from the time samples were displayed (i.e., day 1 post-slaughter measurement was taken as 0 h display), using a HunterLab colour meter (Hunterlab Miniscan, TM XE Plus 45/0-L, aperture size of 25 mm, Reston, USA) with light source set at D65/10. Figure 1 shows photographs of fresh LL muscle taken at day 1 (Figure 1(a)) and day 4 (Figure 1(b)) of the display. These LL muscles were from the annual ryegrass pasture with flaxseed treatment (AP + FS). The other half of each LL was vacuum packed and stored at 3˚C for 4 weeks. After 4 weeks, vacuum packs were opened and loin slices were prepared for the colour evaluation as outlined for fresh meat above. Figure 2 shows photographs of aged LL muscle taken at day 1 (Figure 2(a)) and day 4 (Figure 2(b)) of the display. These LL muscles were from annual ryegrass pasture with oat grain treatment (AP).
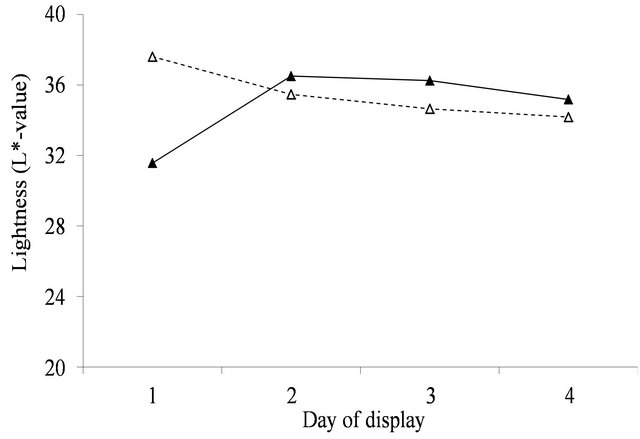
Colour stability of fresh and aged meat (in vacuum packs) was assessed by measuring the change in redness of meat (a*-value) and the formation of brownness (ratio of oxymyoglobin and metmyoglobin [oxy/met]) in the meat surface as determined by the reflectance ratio at 630/580 nm wavelength. Lower values of the 630/580 nm (= oxy/met) ratio indicate browner meat [15]. The use of this ratio as an indirect measure of metmyoglobin formation (brownness) on the meat surface has been described elsewhere [16]. In addition the brightness/darkness and yellowness of meat surface was also assessed by L*-value (lightness; Figure 3(a)) and b*-value (Blue to yellow; Figure 3(b)), respectively using the same instrument. The scale ranges for L*-value where 0 is black and 100 is white while for b*-value where -60 is blue and 60 is yellow. On the day of preparation for both fresh and aged meat, colour was measured after a 30 min bloom at 3˚C.
2.4. Statistical Analysis
The average of the redness, lightness, yellowness and brownness values for the three slices on a tray was calculated on each measurement day. These average values over the 4 sampling days were analysed as repeated measures analyses of variance with Greenhouse-Geisser correction [17], and with animal as a blocking effect. Factorial and nested treatment effects involving aging (fresh versus aged in vacuum packs) and display time (days) are reported in Table 1. These analyses allow a meat colour comparison (redness, lightness, yellowness, and brownness) between fresh and aging in vacuum packs, over
 (a)
(a)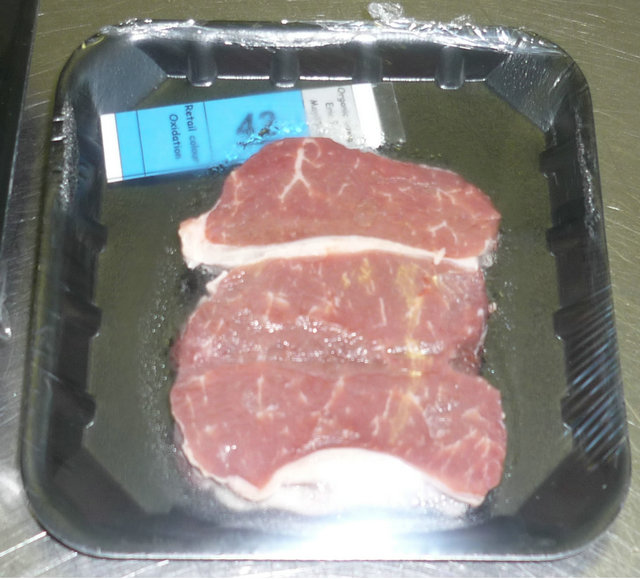 (b)
(b)
Figure 1. Surface colour of fresh LL muscle (3 slices) taken at day 1 (Figure 1(a)) and day 4 (Figure 1(b)) of the display. These LL muscles were from annual ryegrass pasture with flaxseed treatment (AP + FS). The meat in Figure 1(a) is from a different animal to the meat in Figure 1(b).
 (a)
(a)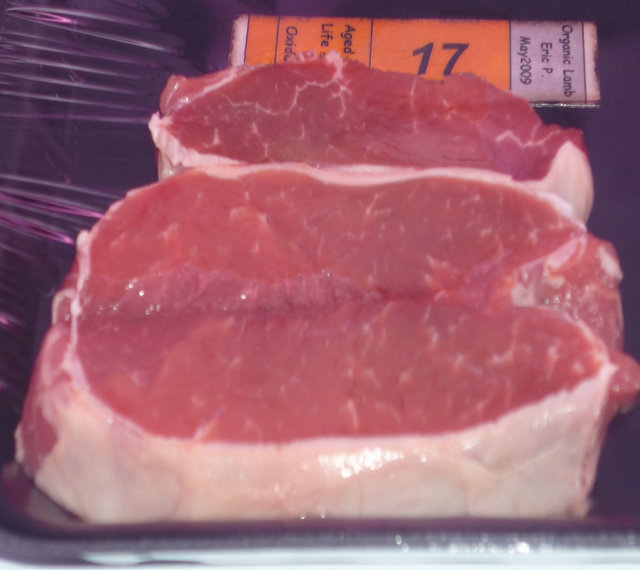 (b)
(b)
Figure 2. Surface colour of aged LL muscle (3 slices) taken at day 1 (Figure 2(a)) and day 4 (Figure 2(b)) of the display. These LL muscles were from annual ryegrass pasture with oat grain treatment (AP). The meat in Figure 2(a) is from the same animal to the meat in Figure 2(b).

Table 1. Levels of significance (P values) for effects, involving (main effects and interactions) either aging (fresh meat vs aged in vacuum packs) or time of display or both aging and time of display, on meat lightness, redness, yellowness or surface brownness formation measurements.
 (a)
(a) (b)
(b)
Figure 3. Surface lightness (L*-value) over the 4 days of display for fresh (▲) and aged (Δ) meat (Figure 3(a)) and yellow to blue (b*-value) over the 4 days of display for fresh (▲) and aged (Δ) meat (Figure 3(b)). For figure representing 3(a): SED within same aging = 0.178. SED across aging = 0.277. For figure representing 3(b): SED within same aging = 0.207. SED across aging = 0.24.
time, for the four feeding management treatments.
3. Results
There was no indication that supplement (within the annual pasture treatment) had any interaction with packaging or time of display for any of the four surface colour measurements that is lightness, redness, yellowness or brownness (P > 0.1; Table 1), and thus the results for the three supplements in annual pasture treatment are not presented separately. However, there was evidence of interactions between pasture types (annual versus perennial) for the redness (a*-value) and brownness formation (RF630/580 ratio), and thus results are separately presented for annual and perennial pasture treatments with these two colour measurements, but not for lightness (L*-value) or yellow to blue (b*-value).
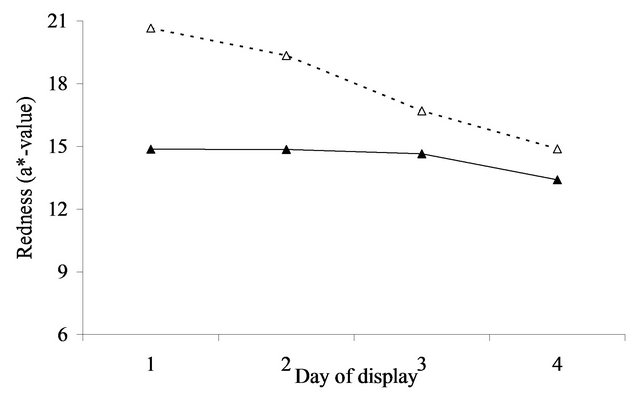
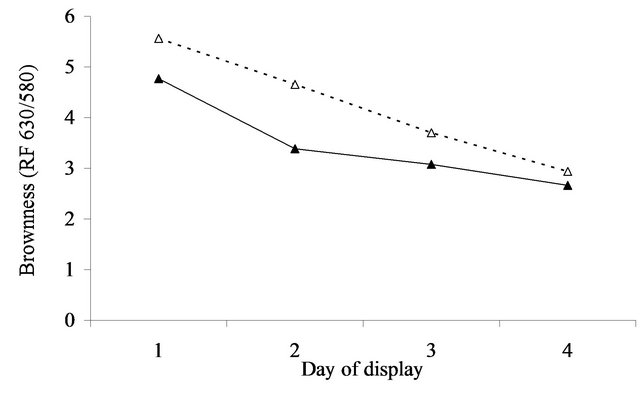
At initial display (day 1), the value of a* was 5.8 (se = 0.27) units greater after aging in vacuum packs than when fresh for the annual pasture (Figure 4(a)). For perennial pasture the response was almost identical, being 5.7 (se = 0.60, Figure 4(b)). Similarly, the difference between aged and fresh for RF630/580 was similar for annual (0.8, se = 0.10, Figure 5(a)) and perennial pasture treatments (0.7, se = 0.23, Figure 5(b)).
With aging, there was a strong decline in both a*- value and RF630/580 over the 4 days of display. The decline in a*-value was greater in annual pasture (5.7, se = 0.21) than in perennial pasture (4.3, se = 0.47). Similarly the decline in RF630/580 was greater in annual pasture (2.6, se = 0.08) than in perennial pasture (1.9, se = 0.19). With fresh lamb, there was a much smaller decline in a*-value, but by day 4 the a*-value of the aged meat was still clearly greater than fresh for both annual (1.5, se = 0.27) and perennial pasture (3.2, se = 0.60). Over the four days, there were substantial declines in RF630/580 so that by day 4 the RF630/580 ratio of the aged meat was still greater than fresh for both annual (0.3, se = 0.10) and perennial pasture (0.8, se = 0.23). The aged meat had significantly lower lightness values for day 2, 3 and 4 of display than the fresh meat, but not at day 1 (Figure 3(a)). The aged meat was yellower than the fresh meat for day1 to day 4 of the display.
4. Discussion
The overall picture is that aging in vacuum packs for 4 weeks led to substantially greater redness and less brownness than occurred in fresh meat, over the entire four days of simulated retail display. However, the advantage of aging in vacuum packs was more sustained over the display period for lambs that had grazed perennial pasture than lambs that had grazed annual pasture.
The importance of these findings must be considered in relation to likely consumer perception of the meat displayed. Based on the results of [18] consumers on average typically assessed displayed lamb meat as unacceptable when either the a*-value fell below 14.8 or when the 630/580 ratio was less than 3.3. These thresholds need to be increased to 21.7 and 6.8 to be 95% confident that a randomly selected consumer will consider a sample acceptable [18], which according to the results (Figure 4) was not achievable for fresh meat. By comparison the average a*-values remained above or close to the a*- values for the 14.8, but not the 21.7 cut-off over the 3 days of display irrespective of pasture type. However, using the 3.3 cut-off for brownness, on average the fresh meat was unacceptable after 1 day on display whereas the aged in vacuum packs meat was acceptable for at least 2 days of display. This difference is of real eco-
 (a)
(a)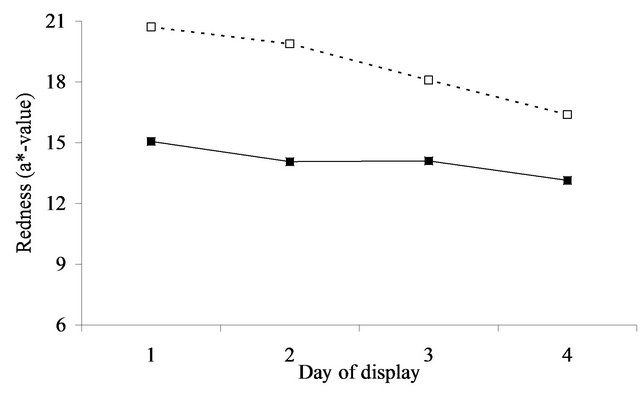 (b)
(b)
Figure 4. Redness (a*-value) over the 4 days of display in lambs grazing annual pasture (Figure 4(a)) for fresh (▲) and aged (Δ) meat or perennial pasture (Figure 4(b)) for fresh (■) and aged (□) meat. For figure representing 4(a): SED within same aging = 0.209. SED across aging = 0.268. For figure representing 4(b): SED within same aging = 0.468. SED across aging = 0.600.
 (a)
(a)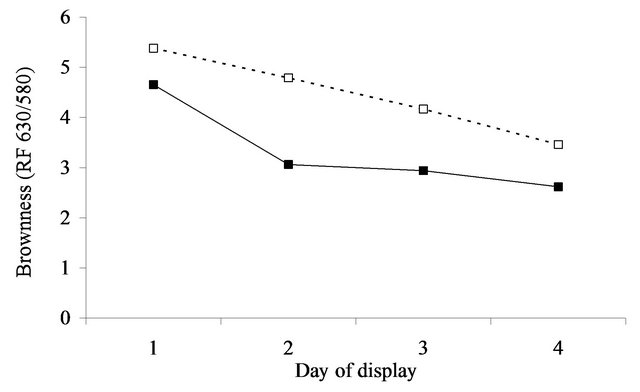 (b)
(b)
Figure 5. Surface brownness formation (RF 630/580 nm = oxy/met) over the 4 days of display in lambs grazing annual pasture (Figure 5(a)) for fresh (▲) and aged (Δ) meat or perennial pasture (Figure 5(b)) for fresh (■) and aged (□) meat. For figure representing 5(a): SED within same aging = 0.084. SED across aging = 0.104. For figure representing 5(b): SED within same aging = 0.187. SED across aging = 0.233.
nomic importance given retailers will discount meat that is visually unacceptable [12].
There has been considerable research conducted to enhance the redness of meat at the retail level [19,20]. Aging in vacuum packs has long been used for the storage of lamb meat, but the practice has not been evaluated against freshly displayed meat for any impact on brownness of meat during retail display, under long ageing periods. Given that aging in vacuum packs improves retail colour under long ageing periods compared to fresh meat, both in terms of redness and brownness, aging in vacuum packs could be a useful strategy for improving consumer acceptability of retail lamb in local markets. This may be true even where there is no logistical or transport need to extend the life of the meat.
Using a chromameter to measure colour [4] found evidence from a study conducted in lambs with 3 feeding experiments that muscle samples aged in vacuum packs for 4 weeks and placed under simulated retail display had greater colour retention (based on a*-values) compared with fresh meat counterparts. Our results confirm their findings, but also extend our understanding to the effects of aging in vacuum packs on surface brownness. There could be several reasons for aged meat being more colour stable compared to fresh meat. We propose some possibilities. Firstly, the anaerobic condition with 4 weeks of vacuum packaging might have changed the initial biochemical reaction associated with haem pigment (haem iron) and oxygen in the meat surface; secondly, the oxygen consumption of meat and/or the oxygen diffusion into the muscle surface may have been altered due to changes in the physical properties of meat (sealant formation) or thirdly, a muscle vitamin E concentration above 3.4 mg/kg meat may have a combined effect on the lipid oxidation and colour when stored for a longer duration under vacuum packaging [14]. Further investigation is warranted.
Others have reported that oxygen diffusion into meat is greater at low temperatures [21], but the ultimate depth depends on the rate of oxygen uptake which decreases with ageing [22]. It has been reported [23] that aged meat can have a brighter colour immediately after blooming because of increased light scatter and deeper penetration, but it has poorer colour stability with loss of metmyoglobin (MMb) reducing activity. The present study showed that the values for brownness (RF630/580 = oxy/met) was better for meat aged in vacuum packs compared with fresh meat over the entire display period used in this study. This also occurred with redness (a*-value), despite the decline in redness (colour stability) for meat aged in vacuum packs.
The lightness of meat describes an aspect of meat colour, namely whether the meat surface is brighter or darker. The results for lightness indicate that, the greater redness in aged than fresh meat is associated with lower surface lightness (Figure 4(a)). The b*-value is mainly used to describe the colour of fat in the meat industry. The aged meat was yellower than the fresh meat in the current study. (Figure 3(b)).
It is notable that the advantage of aging using vacuum packaging was more sustained over the display period for lambs that had grazed perennial pasture than lambs that had grazed annual pasture. We suggest that this may be associated with differences in vitamin E concentration as reported previously [13]. Antioxidants such as vitamin E can scavenge radicals formed in meat and slow down the formation of MMb that generates brown discolouration in meat. The average vitamin E concentration of lambs grazing PP and AP treatments in [14] was 5.9 and 3.4 mg/kg muscle, respectively. Others have reported [24] that retail colour stability will be inferior when vitamin E is less than 3.5 mg/kg muscle, on an individual animal basis. The results of the latter study agree with the finding of the current study because when vitamin E is below 3.4 mg/kg muscle on an average treatment basis, many individual animals will be below 3.5 mg/kg muscle. Another study has shown a difference in retention of redness at 3 and 4 days of display for fresh meat between lambs that had grazed annual pasture having a vitamin E concentration of 3.42 mg/kg muscle compared with similar lambs that had been supplemented with a hay and grain diet at 1.69 mg/kg muscle [25]. We suggest the possibility of synergistic effects between meat packaging and muscle vitamin E concentrations on initial colour and colour retention of meat that has been stored for the longer term.
5. Conclusion
The brownness of meat during four days of retail display was less in aged vacuum packed meat cuts compared with fresh meat cuts. The advantage of aging in vacuum packs is greater over the display period for lambs that had grazed perennial pasture than lambs that had grazed annual pasture. We postulate that this may be related to muscle vitamin E concentration at slaughter. Aging in vacuum packs could be a useful strategy for improving consumer acceptability of retail lamb in local markets, even where there is no logistical or transport need to extend the life of the meat.
6. Acknowledgements
The funding for this work was provided by the Department of Primary Industries, Victoria, Australia. We would like to thank Greg Seymour for the management of animals in paddocks and Matthew Kerr, Athula Natharampatta and Wayne Brown for the slaughter of lambs, muscle sample collection and colour measurement of the meat.
REFERENCES
- MLA, “Australia’s Sheepmeat Industry—Fastfacts 2007: Export Facts and Figures,” Meat & Livestock Australia, North Sydney, 2007.
- K. W. McMillin, “Where Is MAP Going? A Review and Future Potential of Modified Atmosphere Packaging for Meat,” Meat Science, Vol. 80, No. 1, 2008, pp. 43-65. doi:10.1016/j.meatsci.2008.05.028
- V. J. Moore and O. A. Young, “The Effects of Electrical Stimulation, Thawing, Ageing and Packaging on the Colour and Display Life of Lamb Chops,” Meat Science, Vol. 30, No. 2, 1991, pp. 131-145. doi:10.1016/0309-1740(91)90003-9
- E. N. Ponnampalam, G. R. Trout, A. J. Sinclair, A. R. Egan and B. J. Leury, “Comparison of the Color Stability and Lipid Oxidative Stability of Fresh and Vacuum Packaged Lamb Muscle Containing Elevated Omega-3 and Omega- 6 Fatty Acid Levels from Dietary Manipulation,” Meat Science, Vol. 58, No. 2, 2001, pp. 151-161. doi:10.1016/S0309-1740(00)00143-1
- V. H. Powell, R. F. Dickinson, W. R. Shorthose and P. N. Jones, “Consumer Assessment of the Effect of Electrical Stimulation on the Colour and Colour Stability of Semimembranosus Muscles,” Meat Science, Vol. 44, No. 3, 1996, pp. 213-223. doi:10.1016/S0309-1740(96)00075-7
- D. L. Hopkins, T. A. Lamb, M. J. Kerr, R. J. van de Ven and E. N. Ponnampalam, “Examination of the Effect of Ageing and Temperature at Rigor on Colour Stability of Lamb Meat,” Meat Science, 2013, in press.
- C. Faustman and R. G. Cassens, “The Biochemical Basis for Discoloration in Fresh Meat: A Review,” Journal of Muscle Foods, Vol. 1, No. 3, 1990, pp. 217-243. doi:10.1111/j.1745-4573.1990.tb00366.x
- D. B. MacDougall, “Changes in the Colour and Opacity of Meat,” Food Chemistry, Vol. 9, No. 1-2, 1982, pp. 75- 88. doi:10.1016/0308-8146(82)90070-X
- M. Renerre, F. Dumont and P. Gatellier, “Antioxidant Enzyme Activities in Beef in Relation to Oxidation of Lipid and Myoglobin,” Meat Science, Vol. 43, No. 2, 1996, pp. 111-121. doi:10.1016/0309-1740(96)84583-9
- C. Faustman and A. L. Phillips, “Measurement of Discoloration in Fresh Meat,” In: R. E. Wrolstad, Ed., Current Protocols in Food Analytical Chemistry, Wiley & Sons, Inc., New York, 2001, pp. F3.3.1-F3.3.13.
- M. C. Hunt, “Meat Colour Measurements,” Proceedings of the 33rd Reciprocal Meat Conference, 1980, pp. 41.
- D. E. Hood and E. B. Riordan, “Discolouration in Pre-Packaged Beef Measured by Reflectance Spectrophotometery and Shopper Discrimination,” Journal of Food Technology, Vol. 8, No. 3, 1973, pp. 333-343. doi:10.1111/j.1365-2621.1973.tb01721.x
- V. F. Burnett, G. R. Seymour, S. Norng, J. L. Jacobs and E. N. Ponnampalam, “Lamb Growth Performance and Carcase Yield from Perennial or Annual Pasture Systems with Supplements,” Animal Production Science, Vol. 52, No. 4, 2012, pp. 248-254. doi:10.1071/AN11053
- E. N. Ponnampalam, V. F. Burnett, S. Norng, R. D. Warner and J. L. Jacobs, “Vitamin E and Fatty Acid Content of Lamb Meat from Perennial or Annual Pasture Systems with Supplements,” Animal Production Science, Vol. 52, No. 4, 2012, pp. 255-262. doi:10.1071/AN11054
- E. D. Strange, R. C. Benedict, R. E. Gugger, V. G. Metzger and C. E. Swift, “Simplified Methodology for Measuring Meat Color,” Journal of Food Science, Vol. 39, No. 5, 1974, pp. 988-992. doi:10.1111/j.1365-2621.1974.tb07293.x
- D. B. MacDougall, “Colour of meat,” In: A. M. Pearson and D. R. Dutson, Eds., Quality Attributes and Their Measurement in Meat, Poultry and Fish Products, An Aspen Publication, 1995, pp. 79-93.
- S. W. Greenhouse and S. Geisser, “On Methods in the Analysis of Profile Data,” Psychometrika, Vol. 24, No. 2, 1959, pp. 95-112. doi:10.1007/BF02289823
- S. Khliji, R. van de Ven, T. A. Lamb, M. Lanza and D. L. Hopkins, “Relationship between Consumer Ranking of Lamb Colour and Objective Measures of Colour,” Meat Science, Vol. 85, No. 2, 2010, pp. 224-229. doi:10.1016/j.meatsci.2010.01.002
- C. Faustman, R. G. Cassens, D. M. Schaefer, D. R. Buege, S. N. Williams and K. K. Scheller, “Improvement of Pigment and Lipid Stability in Holstein Steer Beef by Dietary Supplementation with Vitamin E,” Journal of Food Science, Vol. 54, No. 4, 1989, pp. 858-862. doi:10.1111/j.1365-2621.1989.tb07899.x
- D. M. Wulf, J. B. Morgan, S. K. Sanders, J. D. Tatum, G. C. Smith and S. Williams, “Effects of Dietary Supplementation of Vitamin E on Storage and Caselife Properties of Lamb Retail Cuts,” Journal of Animal Science, Vol. 73, No. 2, 1995, pp. 399-405.
- M. C. Urbin and G. D. Wilson, “Fresh Meat Characteristics which Influence Packaging Requirements,” Proceedings of the 10th Research Conference of the American Meat Institute, 1958, pp. 13-20.
- J. R. Bendall and A. A. Taylor, “Consumption of Oxygen by the Muscle of Beef Animals and Related Species. 2. Consumption of Oxygen by Post-Rigor Muscle,” Journal of the Science of Food and Agriculture, Vol. 23, 1972, pp. 707-719. doi:10.1002/jsfa.2740230606
- D. B. MacDougall, “Meat Chilling—Why and How?” Meat Research Institute Symposium, Langford, Bristol, 1972, No. 2, p. 8.1.
- C. G. Jose, D. W. Pethick, G. E. Gardner and R. H. Jacob, “Vitamin E Will Improve the Colour Stability in Lamb; a Dose Rate Investigation,” Proceedings of the 54th International Congress of Meat Science and Technology, Cape Town, 2008, pp. 1-3.
- E. N. Ponnampalam, K. L. Butler, M. B. McDonagh, J. L. Jacobs and D. L. Hopkins, “Relationship between Muscle Antioxidant Status, Forms of Iron, Polyunsaturated Fatty Acids and Functionality (Retail Colour) of Meat in Lambs,” Meat Science, Vol. 90, No. 2, 2012b, pp. 297-303. doi:10.1016/j.meatsci.2011.07.014

