Food and Nutrition Sciences
Vol. 3 No. 6 (2012) , Article ID: 20055 , 6 pages DOI:10.4236/fns.2012.36113
Some Chemical and Microbiological Characteristics of Agashi Meat Product
![]()
1Department of Food Science and Technology, Faculty of Engineering and Technology, University of Gezira, Wad-Medani, Sudan; 2Food Research Centre, Agricultural Research Corporation, Shambat, Sudan.
Email: moneim_ug@yahoo.com
Received February 11th, 2012; revised May 2nd, 2012; accepted May 11th, 2012
Keywords: Agashi; Meat; Protein; Macro-Mineral; Microbiological Analysis
ABSTRACT
This study aimed to determine the chemical characteristics and the microbiological quality of Agashi sliced meat product which is consumed largely as snack food in Sudan. The study addressed the contents of moisture (32.76% ± 0.30% to 72.37% ± 0.21%), ash (0.97% ± 0.4% to 8.55% ± 0.2%), proteins (10.5% ± 0.45% to 30.7% ± 0.5%), fibers (0.20% ± 0.3% to 0.81% ± 0.6%), fats (3.34% ± 0.32% to 11.9% ± 0.1%) carbohydrates (0.39% ± 0.83 to 45.93% ± 0.84%). The concentrations of macro minerals Fe, Na, K were higher in cooked Agashi compared to those of raw Agashi samples, these macro minerals contained a range of 21.5 - 95, 30.6 - 90 and 0.1 - 1.5 mg/100g, respectively. The microbiological analyses revealed presence of high levels of total viable count, coliforms, yeast and mould, Staphylococcus spp. E. coli (about 75% positive samples) in the product, moreover, salmonella was detected in most of the raw and cooked Agashi samples. This high contamination of Agashi with food spoilage organisms and pathogens decrease the quality and constitute a public health hazard.
1. Introduction
Meat and meat products are concentrated sources of high quality protein, and their essential amino acids content usually compensate for deficiencies in diets made mainly of cereals and other vegetable proteins. They supply easily absorbed iron and assist in the absorption of iron from other foods as well as zinc, and are rich sources of some of the B-vitamins. By providing such nutrients, meat consumption can alleviate common nutritional deficiencies [1].
The activities of the meat sector may be divided into three stages-slaughtering, meat cutting and further processing. Each stage involves completely different technical operations which must not be viewed as separate and independent processes [2].
Agashi was introduced to Sudan by the Hausa and Alvlata tribes came from regions of Central Africa, particularly Nigeria. Agashi is an African word means barbecue meat in which different types of spices are added as known in West Africa. Agashi started entering to Sudan in the 1960s and was confined to specific areas. However, in early 1990, it began to spread in most of States of Sudan. Nowadays Agashi is one of the most popular snack foods and its preparation is still limited to certain tribes (personal contact).
Meat and meat products are highly perishable which spoil easily, soon become unfit for human consumption and possibly dangerous to health through microbial growth, chemical changes and breakdown by endogenous enzymes [3].
Meat is highly perishable, because it is high in protein and moisture and semi-neutral in pH which makes it an ideal medium for bacterial growth [4]. The objectives of this study were to determine the proximate chemical composition of Agashi meat product and to evaluate its microbial quality.
2. Materials and Methods
2.1. Collection of Samples
Fourty processed Agashi samples were collected immediately after processing in sterilized containers from different markets at Wad Madani, central Sudan (8) samples from each market, these markets included: Aldepaga (A), Alsug Alkabeer (B), Alsug Alsageer (C), Alsug Alshabi (D) and the industrial area (E). In addition, fresh Agashi was prepared at laboratory level (L) using fresh beef purchased from the local butcher at Wad Madani market. The samples were transported under aseptic conditions to the Meat Technology Laboratory of the Department of Food Science and Technology, University of Gezira.
2.2. Manufacture of Laboratory Made Agashi (LMA)
The common and traditional method was used to prepare Agashi at the laboratory as follows:
Doga (mixed spices) was made of a number of finely ground spices including ginger, cinnamon, black pepper, salt, fennel and coriander. Crushed peanuts and bread crumbs were added to the mixed spices. Then beef meat (1/2 kg) was chopped to make small slices, and soaked in water for few minutes. The meat slices were placed in thin iron sticks, mixed with doga and cooked for 15 minutes at about 85˚C until the colour of meat was changed to brown.
2.3. Proximate Chemical Composition
The contents of moisture, protein, fat, crude fibre and ash were determined according to the AOAC [5] method for samples consisting of raw and cooked Agashi as well as the laboratory made Agashi (LMA). The carbohydrate content in various samples was determined by subtracting the sum of moisture, protein, ash, crude fiber and fat content from 100 and the pH of the various samples was measured using (pH-meter 7020).
2.4. Macro-Minerals Determination
Potassium (K) and sodium (Na) concentrations were accomplished by means of flame photometer model (Corning 400 flam photometer), and iron (Fe) by Spectrophotometer (Spectrumlab 22 PC). These minerals were determined according to the AOAC [6] method.
2.5. Microbiological Analysis
Serial dilutions were prepared for the various microbiological analyses as follows:
Thirty grams from each sample was shaken thoroughly with 270 ml sterile distilled water to give 10−1 dilution. A set of 6 tubes containing 9 ml sterile distilled water was prepared and 1ml of the suspension was transferred to the first tube of the dilution series. This was repeated up to the dilution 10−7.
For the determination of total viable count, one ml aliquots from suitable dilutions were transferred aseptically into sterile Petri dishes. To each dilution 10 - 15 ml of melted and cooled (42˚C) plate count agar were added. Inoculums was mixed well with the medium and allowed to solidify. The plates were then incubated in an incubator at 37˚C for 24 - 48 hours.
For the determination of yeast and mould count, from suitable dilutions 0.1 ml samples was aseptically surface plated onto potato dextrose agar medium (PDA) with 40 ppm chloramphenicol added to inhibit bacterial growth. The plates were incubated at 25˚C - 28˚C for 48 hours [7]. The counts were presented as colony forming units per gram (cfu/g).
The coliforms count was determined by plating one ml of sample onto MacConky Agar media. The plates were incubated at 37˚C for 48 hours and the counts were presented as colony forming unites per gram (cfu/g). Plates showing positive coliform were subjected to the confirmed test using Brilliant green bile lactose broth in test tubes with Durham tubes. The test tubes were then incubated at 44˚C for 48 hours. Each confirmed positive tube was subcultured into E.C. broth medium and then incubated at 44.5˚C for 24 hours. Tubes showing any amount of gas production were considered to be positive.
For determination of staphylococcus count, 0.1 ml was plated onto Baird Parker Agar medium and the inoculum was distributed evenly using sterile glass rod. The plates were then incubated at 37˚C for 24 - 48 hours and the counts were presented as colony forming units per gram (cfu/g).
For salmonella detection, 10 grams of sample were weighted aseptically and mixed well with 100 ml sterile nutrient broth. This was incubated at 37˚C for 24 hours. Then 10 ml were drawn aseptically and added to 100 ml selenite broth. The broth was incubated at 37˚C for 24 hours. Then with a loopful streaking was done on dried Bismuth sulphite agar plates. The plates were then incubated at 37˚C for 72 hours. Black metallic sheen discrete colonies indicated the presence of salmonella. A confirmatory test was carried out by taking a discrete black sheen colony and sub culturing it in a Triple sugar iron agar tubes. Production of a black colour at the bottom of the tube confirms the presence of salmonella.
3. Results and Discussion
3.1. Chemical Composition
The chemical characteristics of food are related to the product itself and refer primarily to the content of specific substances, which are important from the point of view of keeping quality, flavor, nutritional value etc., which may also represent harmful residues [2].
Table 1 shows the chemical composition of the Agashi samples collected from various sites, while Table 2 shows the chemical composition of the laboratory made Agashi (LMA). The highest pH value of raw Agashi was found in B samples (5.4 ± 0.1), and the lowest value was found in E and D samples (4.90 ± 05). However, the pH of LMA was (5.0 ± 0.05). In the cooked samples the highest pH value was found in B samples (5.7 ± 0.05) and the lowest was found in the E samples (5.2 ± 0.1). It seems that the cooking process destroyed some of the microbes which lead to the increase of the pH of cooked

Table 1. Chemical composition of Agashi samples collected from different areas.
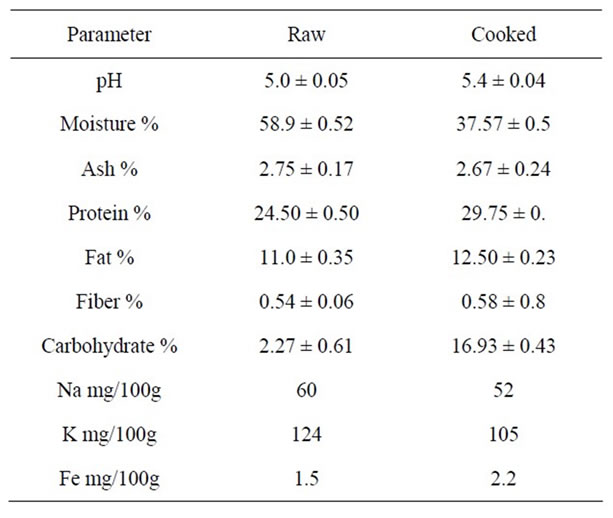
Table 2. Chemical composition of laboratory made Agashi (LMA).
Agashi as compared with raw Agashi. The pH value or acidity of meat is important in relation to the meats microbiological and keeping quality. In the live animals the pH value of muscular tissue is about (7.0 - 7.1). In meat, glycogen converted to lactic acid causes a decrease in the pH (5.7) value which is favorable for keeping the quality of meat (low pH inhibits bacteria growth). These results were in agreement with that reported by Abd Elkareim [8] who reported that pH of fresh beef meat was 5.57.
As for moisture content, the lowest and highest value of the raw Agashi samples was found in B samples (34.77% ± 0.42%) and in E samples (48.50% ± 0.5%), respectively. However, the LMA contained greater amount of moisture (58.9% ± 0.52%). On the other hand, the highest moisture content in cooked Agashi was found in A samples (40.0% ± 0.4%), while the lowest value was found in B samples (32.76% ± 0.3%). However, the moisture content of LMA was 37.57% ± 0.5%. The highest ash content in the cooked Agashi was found in E samples (8.55% ± 0.02%), while the lowest values was found in B samples (3.27% ± 0.1%). However, the LMA contained 2.67% ± 0.24%. This increase in the ash content may be due to the addition of additives.
The highest and lowest protein content of the raw Agashi was found in A samples (26.25% ± 0.27%) and B samples (10.5% ± 0.45%), respectively. In all examined samples, the cooking process increased the protein contents. However, the variation in protein contents of the different Agashi samples could be attributed to the method of processing, loss of moisture due to heat treatment as well as the addition of peanut in the recipe. However Abd Elkareim [8] found that the protein content of fresh beef was 20.51%.
Fat is the most variable component in processed meat. It is extremely important because it directly affects flavor, texture and shelf life [2]. The highest fat content of raw Agashi was found in A samples (7.8% ± 0.3%), while B sample contained the lowest value which was 4.75% ± 0.17%. However, the LMA contained 11.35% ± 0.35%. The highest value in cooked Agashi was found in B samples (11.9% ± 0.1%), while the lowest was found in B samples (4.58% ± 0.1%). These results were extremely higher than those reported Abd Elkareim, [8] who where reported a value of 2.23% in raw beef. It seems that the addition of oil in the Agashi recipe increased the fat content of Agashi samples. In the raw Agashi the highest fiber content was found in A (0.69% ± 0.03%), while the lowest fiber content was found in E samples (0.46% ± 0.05%). However, the LMA contained 0.54% ± 0.06%. However, the highest fiber content in cooked Agashi was found in A samples (0.62% ± 0.03%), while the lowest was found in E samples.
For the raw Agashi, the highest carbohydrate content was found in B samples (45.93% ± 0.84%), while the lowest was found in E samples (15.32% ± 0.98%). However, the LMA contained (2.27% ± 0.61%). On the other hand, the highest carbohydrate content in cooked Agashi was found in B samples (45.93% ± 0.95%), and the lowest was found in A samples (15.05% ± 0.41%). The high carbohydrate content may be due to mixed spices and bread crumbs.
The concentrations of Fe, Na, K were higher in cooked Agashi samples than those found in raw Agashi samples, that could be due to the high moisture content in raw samples compared to cooked samples. These minerals ranged between (0.10 - 1.20), (21.5 - 95) and 30.6 - 75 mg/100g in raw Agashi to 026 - 1.50, 20 - 71 and 43.2 - 90 mg/100g in cooked Agashi respectively. It was reported that the Na content of raw and cooked (meat and meat products) was 69, 67 mg/100ml, respectively [4].
Tables 3 and 4 present the microbiological characteristics of Agashi samples collected from different sites and the Laboratory Made Agashi (LMA), respectively. In raw Agashi samples, the lowest total viable count was found in Aldebaga (A) samples (1.3 × 10⁵ cfu/g), while the highest was found in Alsug Alkabeer (B) samples (5.8 × 10⁶ cfu/g). However, the LMA contained 1.3 × 10⁵ cfu/g total bacteria count. As for the cooked Agashi, the lowest total bacterial count was found in Alsug Alshabi (D) samples (9.3 × 10³ cfu/g), while the highest was found in the Industrial area (E) samples (6.4 × 10⁴ cfu/g). Almost a similar result was reported in the cooked Agashi samples prepared in the laboratory which contained 7.2 × 10³ cfu/g. This result was acceptable as it falls within the confidence limits (107 cfu/g) of total viable counts of (chilled and unfrozen) uncooked meat (e.g. burger, sausage, etc.) required by Sudanese Standardization Metrology Organization (SSMO) [9]. Alalla [10] reported that the aerobic plate count of the fresh meat before processing was 102 - 103 cfu/g which increased after processing to 107 - 108 cfu/g. Muscle tissues of healthy animals contain few bacterial cells, but cuts and exposed surfaces are easily contaminated after slaughter and during and after processing bacteria can readily multiply on the cut surfaces, although the bacterial count of the interior of the meat usually remains much lower. Multiplication of microorganisms may occur in fresh meat, in such cases there may be no correlation between numbers and the level of initial contamination [7].
The lowest yeast and mould count of raw Agashi was found in A samples (5.4 × 10³ cfu/g), while the highest was found in D samples (1.5 × 10⁵ cfu/g). However, the LMA showed a value of 1.6 × 10⁴ cfu/g. In the cooked Agashi, the lowest yeast and mould were found in A samples (1.3 × 10² cfu/g), while the highest was found in D samples (2.9 × 10³ cfu/g). However total yeast and mould were deceased to 8.7 × 10² cfu/g in LMA sample. Most moulds require less available moisture than most

Table 3. Microbiological Characteristic of Agashi samples collected from different areas.
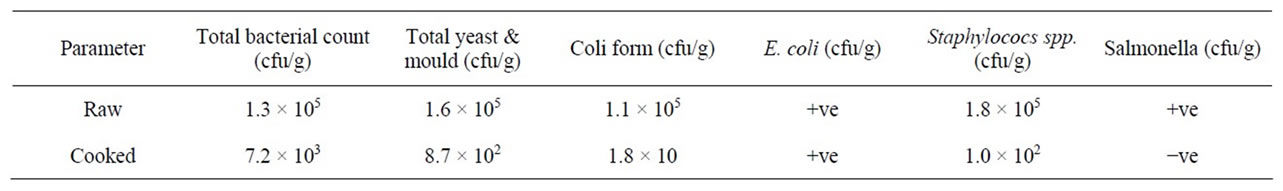
Table 4. The microbiological characteristics of laboratory made Agashi.
yeasts and bacteria, the optimal temperature for most molds is around 25˚C to 30˚C, but some grow well at 35˚C to 37˚C or above [7]. The SSMO [9] indicates that the acceptable level of mould in processed meat is less than 6.0 cfu/g.
The lowest coliform count in raw Agashi, was found in the E samples (2.0 × 10⁵ cfu/g), while the highest was found in D samples (2.2 × 10⁶ cfu/g). However, the LMA showed a coliform count of 1.1 × 10⁵ cfu/g. For the cooked Agashi, the highest coliform was found in E samples (2.3 × 10³ cfu/g) which indicates the high contamination of this site. The SSMO [9] reported that the acceptable microbiological limit is 50.0 cfu/g, and the level of maximum count is 5 × 10² cfu/g. The increase of coliform count may be correlated with the method of processing, post-processing contamination and handling which may enhance their growth. With the exception of only one sample, E. coli was detected in all investigated samples (raw and cooked) which reveals that cooking was not properly done. Coliforms are a group of microorganisms which include E. coli an organism that cause bacteria dysentery and food infection [11]. In raw Agashi samples the lowest Staphylococcus spp. count was found in B samples (1.2 × 10⁵ cfu/g), while the highest was found in the E samples (2.2 × 10⁴ cfu/g). However, the LMA reported a staphylococcus count of 1.8 × 10⁵ cfu/g. With the exception of the cooked Agashi industrial area samples, staphylococcus spp was not detected in the investigated cooked samples. Staphylococcus spp. are the most resistant of all non spore forming organisms to such destructive influences as heat, drying and the action of chemicals. Although most vegetative bacteria are destroyed by a temperature of 60˚C for 30 minutes, Staphylococcus spp. resist a temperature of frequently 60˚C for an hour and some strain, may resist a temperature of 80˚C for 30 minute [12]. The SSMO [9] indicates that the acceptable Staphylococcus spp limits are 5 × 10² cfu/g and the level of maximum count is 1 × 10³ cfu/g.
Salmonella was detected in all of the examined raw and some of the cooked samples. This indicates that Agashi slices were not properly cooked or may be contaminated after cooking, therefore, the presence of salmonella makes this meat product unsuitable for human consumption. The important salmonella strains are S. typhi and S. paratyphi A, B and C [11]. Salmonella load at any level shouldn’t present in any of the meat products e.g., sausage, minced meat, shawerma, Agashi, etc., this is because 10 to 20 cells of Salmonella typhi are sufficient to cause typhoid but 103 to 104 cells of other species may be necessary to cause infection [2]. Generally, the contamination of various Agashi samples could be attributed to cross-contamination, it is known that meat and meat products becomes contaminated by microorganisms from many different sources during the handling, preparation and storage [13].
4. Conclusions
Agashi products showed poor microbiological quality since the microbial load in many cases exceeds the allowed standard levels, this could be attributed to the low quality of meat used in its preparation, and also due to the insufficient cooking temperature used in the process for elimination of pathogenic microorganisms such as E. coli, so the consumption of this product may lead to serious health problem.
It is highly recommended to use high quality meat for processing into different products, and Agashi should be cooked properly so as to eliminate spoilage and pathogenic microorganisms, because the meat is a highly perishable food and subject to several changes every effort should be made during handling and processing to make it reaching the consumer in an acceptable and safe form. In addition, the utensils used during the preparation of Agashi should be made from stainless steel in order to make cleaning easy. Further study is needed to highlight the problems associated with other meat products handling, preparation, cooking and distribution and its influence on the final product quality.
REFERENCES
- A. Bender, “Meat and Meat Products in Human Nutrition in Developing Countries,” (FAO) Food and Nutrition Paper 53, Rome, 1992.
- http//www.fao.org, 2007.
- M. D. Judge and R. A. Markel, “Principle of Meat Science,” Kendall Hunt. Publishing Compony, Dubugue, 1990.
- P. D. Warriss, “Meat Science, an Introductory Text,” CABI Publishing, New York, 2000.
- Association of Official Analytical Chemists Official, “Methods of Analysis,” 17th Edition, Arlington, 1990.
- Association of Official Analytical Chemists Official, “Methods of Analysis,” 11th Edition, Washington, 2000.
- W. F. Harrigan and M. E. MacCance, “Laboratory Methods in Food and Dairy Microbiology,” Academic Press, London, 1976.
- H. F. Abd Elkareim, “Effect of Initial Feed on Weight on the Finishing Performance and Body Composition of Western Sudan Baggara Cattle,” MSc Thesis, University of Khartoum, Khartoum, 2006.
- Sudanese Standardization Metrology Organization, “Sudanese Microbiological Standards for Aerobic bacteria in Fresh and Processed Beef,” BSc Master, University of Khartoum, Khartoum, 2001.
- F. E. M. Alalla, “The Effect of Freezing of Bacteria in Processed Meat,” PhD Thesis, University of Khartoum, Khartoum, 1990.
- C. Monica, “Microbiology,” Medical Laboratory Manual for Tropical Countries, Vol. 2, University Press, Cambridge, 1984.
- A. L. Smith, “Microbiology and Pathology,” 8th Edition, Sant Louis, 1964.
- http:/www.Co.houlder, 2007.