American Journal of Plant Sciences
Vol.05 No.24(2014), Article ID:51989,10 pages
10.4236/ajps.2014.524383
Comparative Analysis of Three Torbangun Clones (Plectranthus amboinicus (Lour.) Spreng) Based on Phenotypic Characteristics and Phenolic Content
Nuri Andarwulan1,2*, Nancy Dewi Yuliana1, Elva Hasna1, Sandra Arifin Aziz3, Tim D. Davis4
1Department of Food Science and Technology, Bogor Agricultural University, Bogor, Indonesia
2Southeast Asian Food and Agricultural Science and Technology (SEAFAST) Center, Bogor Agricultural University, Bogor, Indonesia
3Department of Agronomy and Horticulture, Bogor Agricultural University, Bogor, Indonesia
4Department of Horticultural Sciences & Borlaug Institute for International Agriculture, Texas A&M University, College Station, TX, USA
Email: *nuri@seafast.org
Academic Editor: Marco Andre Alves de Souza, Universidade Federal Rural do Rio de Janeiro (UFRRJ), Brazil
Copyright © 2014 by authors and Scientific Research Publishing Inc.
This work is licensed under the Creative Commons Attribution International License (CC BY).
http://creativecommons.org/licenses/by/4.0/


Received 17 October 2014; revised 16 November 2014; accepted 22 November 2014
ABSTRACT
Torbangun is a folk herb that has been used especially as a breast milk stimulant in North Sumatra, Indonesia. Plant bioactive compound composition is influenced by many factors such as genotype, geographical origin, and environment. Therefore, identifying plant clones with superior chemical composition is a necessity for optimal large-scale production. In this study, three clones of torbangun (hereafter referred to as A, B, and C clones) were analyzed through their phenotypic and foliar phenolic characteristics. The phenotypic results showed that the A clone was distinct from the B and C clones. Nevertheless, the result of multivariate analysis using phenolic data showed that these three clones had three distinct patterns of phenolic compounds. The B clone torbangun was identified as the best clone to be used in larger production scale due to its highest quantity of most phenolic compounds.
Keywords:
Bioactive Compounds, Plant Morphology, Multivariate Analysis

1. Introduction
Torbangun (Plectranthus amboinicus (Lour.) Spreng) is a succulent aromatic perennial shrub plant which grows well in sub-tropical and tropical locations. This plant has many traditional uses such as the treatment of cough, sore throat and nasal congestion, and a range of other illnesses including infections, rheumatism and flatulence [1] . Torbangun leaves have also been reported to have antifungal, anti-inflamatory [2] , antibacterial, anthelminthic [3] , antinociceptive, and antipyretic activity [4] . Moreover, the plant is one of the medicinal vegetables traditionally consumed in Indonesia, especially in Simalungun, North Sumatera, as a breast milk stimulant for hundreds of year [5] .
There are several potential efficacies associated with Torbangun’s bioactive compounds. Some recent studies have reported that torbangun contains bioactive components such as alkaloids, terpenoids, saponins, tannins, and flavonoids [6] - [8] . Flavonoid compounds found in torbangun were apigenin, luteolin, and quercetin [4] . A study reported that the flavonoids, quercetin and kaempferol, were found to have good interaction in stimulating breast milk production [9] .
Three clones of torbangun plants (hereafter designated as A, B, and C) which have slightly different morphological appearance and are from different geographic origins were used in this research. These three clones were chosen based upon their rapid growth characteristics. The A and B clones were from a medicinal plants nursery at Bogor, Indonesia, while the C clone was from a home garden of a Bataknese family living at Bekasi, Indonesia. Several external factors such as climate, soil, and fertilization are known to affect variation of bioactivity compounds in plants, but internal genetic variation is often regarded as the most important factor [10] . Cuttings of the three torbangun clones used in this research were planted in a common garden to facilitate the comparison of bioactive compounds amongst clones.
The purpose of this study was to test our working hypothesis that torbangun clones vary in phenolic concentration and that it is possible to identify clones which have superior phenolic concentrations for future cultivation on a larger production scale. This study used univariate methods (Analysis of Variance, ANOVA) to compare concentration of compounds between samples and multivariate methods (Partial Least Square-Discrimina- tive Analysis, PLS-DA) to obtain further interpretation [11] .
2. Material and Methods
2.1. Cultivation of Torbangun
The three clones of Plectranthus amboinicus (Lour.) Spreng, a species of the Lamiaceae family, was identified by the Indonesian Institute of Science, Research Center of Biology, with Dr. Joeni Setijo Rahajoe as the Head of Botany. The plants were collected from Bekasi, Indonesia (6˚14'56.499''S latitude - 106˚59'49.028''E longitude) and Cipaku, Bogor, Indonesia (6˚35'60''S latitude - 106˚47'59.999''E longitude), then cultivated in the Medicinal Plants Conservation garden, Ciampea, Bogor, Indonesia (6˚34’31.012”S latitude - 106˚41'38.329''E longitude).
Each cutting of torbangun clones was cultivated within 30 cm radius from the other. Cuttings which had at least three nodes were planted in bags in order for rooting before transplanting to a bed with 60% shade. The cuttings were watered manually every two days. To make a suitable growing media, a mixture of soil, husk charcoal, and manure was used, with a ratio of 1:1:1. After 14 days, the cuttings were transplanted on raised- grounds carefully without replacing the roots-bound soil. The composition of growing medium in the planting beds was the same as in polybags. Pest control was accomplished manually, without using pesticides. Incident solar radiation on the three clones was measured on multiple occasions and was similar for all plantings. The plants were cultivated when the season changed from rainy to drought from March to May 2012. The rainfall rate per month in the plantation area was about 119 - 469 mm; the lowest rainfall rate was in March, while the highest rate was in April 2012.
For every five samples of each clone were collected and measured to get the data in order to fill the plant descriptor. The quantitative data were arranged from the smallest to the biggest one, while qualitative data were observed from the most samples.
2.2. Phenotype Identification
Identification of torbangun’s phenotype was accomplished by thorough morphological observation at collecting time, about 8 weeks after transplanting. Variables of observation referred to as plant descriptors?mainly the morphology of leaf and stalk-were made based on guidelines from Bioversity International [12] .
2.3. Chemicals and Reagents
All reagents were of analytical or HPLC grade. Ethanol, methanol, Folin-Ciocalteu reagent, HCl, Na2CO3, Na2COOH, KCl, and KH2PO4 were purchased from Merck (Darmstadt, Germany). TBHQ (Tertiary Butyl Hydroquinone), gallic acid, quercetin, kaempferol, myricetin, apigenin, and luteolin standards from Sigma-Aldrich (St. Louis, MO, USA). Acetonitrile, methanol, and water for HPLC were obtained from JT Baker (Phillipsburg, NJ, USA).
2.4. Sample Preparation
Fresh leaves were collected and prepared the same day. The collected leaves grew about 10 cm from the tip of shoots and were free from blemish and defect. The clean leaves were immediately stored at −20˚C until lyophilized (neither washed nor chopped to avoid browning due to friction of short-hair on leaves). After lyophilization for 48 hours with a freeze dryer (FreeZone 6 l Console Freeze Dry System, Labconco, Kansas City, MO), the dried leaves were crushed to 30 mesh powder. The leaves were stored at −20˚C in darkness until analyzed.
2.5. Phenolics and AnthocyaninsContent
This assay followed the methods used in a previous study by Shetty et al. [13] with modifications in extraction and centrifugation time. The extraction method of total anthocyanins was conducted following a previous study by Sims and Gammon [14] . The determination of anthocyanin content was performed according to a differential pH method approved by AOAC (Association of Official Analitical Chemists).
2.6. Flavonoids Analysis
Two methods of extraction were performed to quantify the amount of flavonoids in the samples, based upon methods previously reported by Hertog et al. [15] . Three major flavonols (myricetin, quercetin, and kaempferol) were optimally quantified using 1.2 M HCl a 2-hour reaction period, whereas two major flavones (luteolin and apigenin) were optimally quantified using 2 M HCl for a 4-hour reaction period. Flavonol extracts were prepared as follows: 20 ml of 62.5% aqueous methanol (2 g/L TBHQ) was added to 0.500 g freeze-dried sample material. The extract was added by 5 ml of 6 M HCl with careful mixing. The extraction solution thus consisted of 1.2 M HCl in 50% aqueous methanol (v/v). After refluxing at 90˚C for 2 hours, the solution was allowed to cool, made up to 50 ml with methanol, and sonicated for 5 minutes. Approximately 3 ml extract was filtered through a 0.45 µm membrane filter for organic solvents (Minisart, Sartorius Stedim Biotech, Germany) prior to injection. Flavone extract preparation was the same as above except for HCl concentration (using 10 M HCl) and extraction period (for 4 hours).
Chromatographic separations were performed on a Develosil-3u-ODS-UG C18 (Nomura Chemical, Seto, Japan) column (4.6 mm i.d. × 75 mm). The column was placed ontoa LC-2040 HPLC (Shimadzu, Kyoto, Japan) and injected with 20 µL extract. The LC was equipped with a UV-Vis Hewlett?Packard Series 1100 detector (Agilent Technologies, Inc., Santa Clara, CA) and reverse-phase column as mentioned above. The isocratic mobile phase was a 25% acetonitrile in 0.025 M KH2PO4 (pH 2.4) solution, with a flow rate of 0.9 ml/min. Flavonoids were quantified based on peak area which compared with standards at 370 nm. Flavonoid standards were mixed in order to create conditions equivalent to flavonoids in nature. All compounds had linear calibration curves (peak area vs concentration; Table 1) through the origin.
2.7. Statistical Analysis
Data are reported as mean ± standard deviation. Analysis of variance was performed with SPSS (Version 20.0, IBM, New York, USA) to evaluate differences among values of each clone. Tukey’s HSD test was used when samples exhibited significantly different values of each metabolite, with the significance level set at p < 0.05. Partial Least Square-Discriminant Analysis (PLS-DA) was applied to all peaks from LC chromatograms, using SIMCA-P software (Version 13.0, Umetrics AB, Umeå, Sweden). All peak areas were converted into an ASCII file using built-in program (LC Solution Version 1.22 SP 1, Shimadzu Corp), bucketed, and summed up by Mi-

Table 1. Linearity of standard curves.
crosoft Excel (Microsoft Corp., USA), before transferring to SIMCA-P for PLS-DA analysis.
Each HPLC spectrum was reduced to fewer variables, calculated by integrating regions of equal bucket size of 0.08 minutes and variable bucket size where large variations in chemical shift could be reduced. Several spectral regions were excluded to eliminate misperceptions in PLS-DA results. Therefore, spectrum from regions after injection until the second minute which contained solvents was excluded. The data sets were arranged in such a way that the rows of each data matrix represent the subjects and the columns represent chemicals contained (variables). The size of the data was 276 × 12.
3. Results
3.1. Morphological Identification of Torbangun Clones
Three torbangun clones were identified using morphological plant descriptors. The results showed that although plants have the same scientific name, they still may have distinct clonal phenotypes. The A clone torbangun could be easily differentiated morphologically from the two other clones in several ways. The mature leaves of clone A were about 1.5 - 2.2 mm-thick, 5.2 - 6 cm long, had a sharper leaf tip, a green leaf stalk which was about 2 - 2.6 cm-length, and the aromatic smell was qualitatively strong. In contrast, the leaves of clones B and C were about 0.5 - 1.0 mm-thick, had a larger length of 7.1 - 8.9 cm, ovate leaves, a purplish-green stalk of about 3.1 - 4.4 cm length, and the aromatic smell was not qualitatively as strong as the A clone.
3.2. Phenolic, Anthocyanins, and Flavonoids Content
Among the three clones, the B clone torbangun had the highest phenolics content, followed by torbangun A and C clones. The C clone contained only about 70% of the total phenolics as compared to the B clone. The phenolic levels of torbangun plants observed in this study were in the range of total phenolic results reported by Marinova et al. [16] and Andarwulan et al. [17] .
Similar to results with phenolics content, the B clone of torbangun had the highest level of anthocyanins among the three clones, with 2.33 mg, followed by 1.82 and 1.69 mg cyanidin-3-glucoside equivalents/100 g DW, for clones A and C, respectively (Table 2). These levels were also in the range of previous work reported by other authors [16] -[18] .
From the two methods performed in quantifying flavonoid content in plants, the results are only presented from the optimal method. The methods were previously optimized by Hertog et al. [19] , followed by Nuutila et al. [20] and Bae et al. [21] . Quercetin, myricetin, and kaempferol were optimally obtained by 2 hours hydrolysis with 1.2 M HCl, while luteolin and apigenin by 4 hours hydrolysis with 2 M HCl. Content of the various flavonoids in the three clones of torbangun ranged from 2.35 to 86.87 mg/100 g DW (Table 3).
3.3. Flavonoids Profile
Results of the torbangun leaf analysis showed that the combination of two methods from Hertog et al. [19] were needed to quantify the five major flavonoids as mentioned before. A typical chromatogram of standard solution can be seen in Figure 1. Meanwhile, typical chromatograms of two extraction and hydrolysis methods can be seen in Figure 2. Flavone peaks appear higher when extracted for 4 h; at 2.0 M HCl, flavonol peaks decreased, or even disappear, when extracted for 4 h. Levels of each identified flavonoid are summarized in Table 3. ANOVA results generally showed that the flavonoid compounds are significantly different from each other be-
Table 2. Total phenolics, total anthocyanins, and flavonoids content of three clones of torbangun (mg/100g DW).
Table 3. Levels of detected flavonols and flavones from three clones of torbangun (mg/100 g DW).
nd: not detected.

Figure 1. Typical chromatogram of standards (10 ppm, except apigenin [20 ppm]).
tween clones. However, an exception was for apigenin contents in A and B clones which were not significantly different.
3.4. Partial Least Square-Discrimination Analysis (PLS-DA) to Differentiate Flavonoids Profile of Three Clones Torbangun
PLS-DA was performed to probe the data comprehensively to distinguish clonal-based sample characteristics. Multivariate data analysis was intended to obtain a model with separation between observed classes, based on the X variable. This model of analysis was developed from a set of data observations based on previously known class memberships [11] . With the capability to discriminate between classes of data, PLS-DA is suitable for analyzing multivariate data from HPLC spectra which have been divided into three classes.
There are two types of PLS-DA outputs used: score scatter plot (part A of Figure 3 and Figure 4) and loading
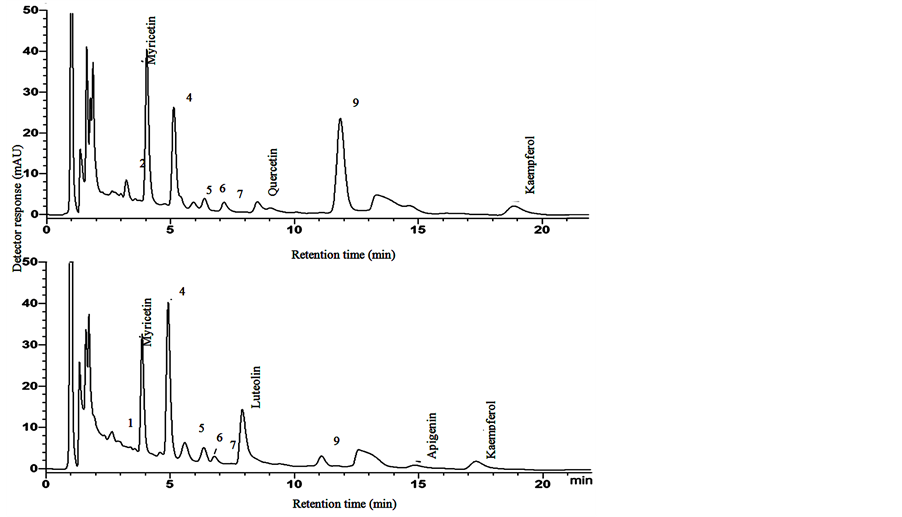
Figure 2. Typical chromatograms of the B clone of torbangun from 2 h (upper) and 4 h (lower) extraction and hydrolysis method.
scatter plot (part B of Figure 3 and Figure 4). From both score scatter plots, A, B, and C clones of torbangun had a group pattern that clearly distinguished the three clones.
3.5. PLS-DA Flavonoid Profile for 2 h-Extraction and Hydrolysis Method
PLS-DA score scatter plot of 2 h-extraction and hydrolysis method was shown in part A of Figure 3. This method produced PLS-DA with 75.7% explainable variables of data. This percentage was obtained by summing the percentage of PC1 and PC2, respectively 57.6% and 18.1%. The score scatter plot showed significant separation between clones A, B, and C; which can be further observed from marker compounds.
The quadrant part of the loading scatter plot which was used to observe the variables that affect the grouping of principal components can be determined by comparing the position of points in the loading plot with the clustered points in score plot. For example, with the 2 h-extraction and hydrolysis method, samples of A clone were clustered on the upper quadrant (part A of Figure 3), so the dominant retention time which influenced the grouping pattern can be seen in the upper quadrant of the loading plot (part B of Figure 3).
Compound that was represented as “peak” at HPLC chromatogram serves as marker of a sample due to its significant presence (showed as high peak area) within the sample. From the loading plot (part B of Figure 3), it is known that the dominant retention times for A clone were at 5; 6.25, 6.5; 10.75 and 11th minutes. These retention times were represented by two compounds, namely UP5 and UP6. As for clone B, the dominant retention times were on: the 4th minute (myricetin); 4.5, 4:25th (UP4), as well as 8.5, and 8.75th (quercetin) minutes. For C clone, the dominant retention times were 18.5 and 18.75th (kaempferol) minutes.
3.6. PLS-DA Flavonoid Profile for 4 h-Extraction and Hydrolysis Method
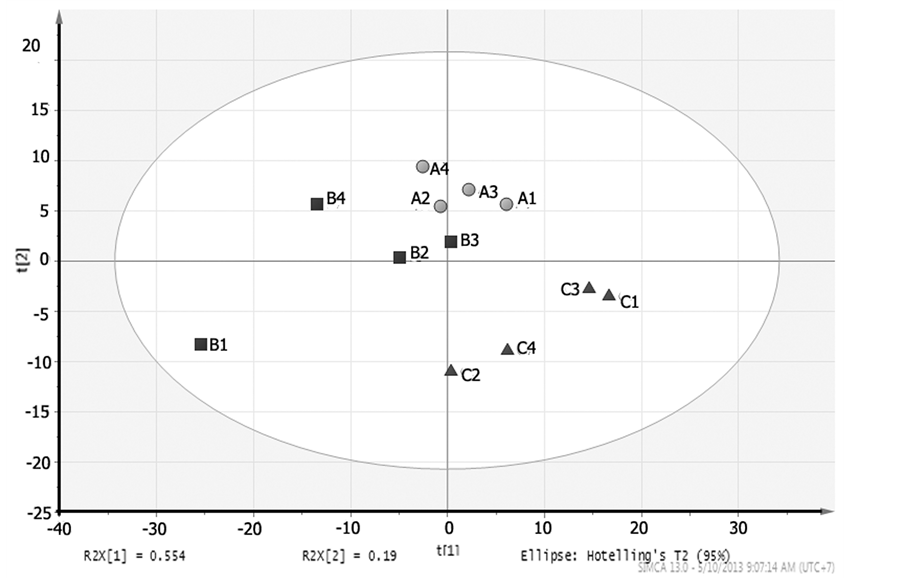
Part A of Figure 4 showed the score plot for the PLS-DA result of the 4 h-extraction and hydrolysis method, where the percentage of explainable variables was lower than the previous method (57.3%). This number derived from percentages of PC1 and PC2, respectively, (55.4% and 19.0%). Score plot in the part A of Figure 3 also showed a clear separation between clones A, B, and C; which also can be seen from marker compounds.
From loading plot of the 4h method (part B of Figure 4), the dominant retention times for A clone were 4.916 (UP4); 6.33, 6.4 (UP6) and 14.58 - 14.91 (apigenin) minutes. The B clone had dominant retention times of 3.916 - 4.000 (myricetin) and 7.916 (luteolin) minutes. Furthermore, the C clone had a dominant retention time of
 (a)
(a)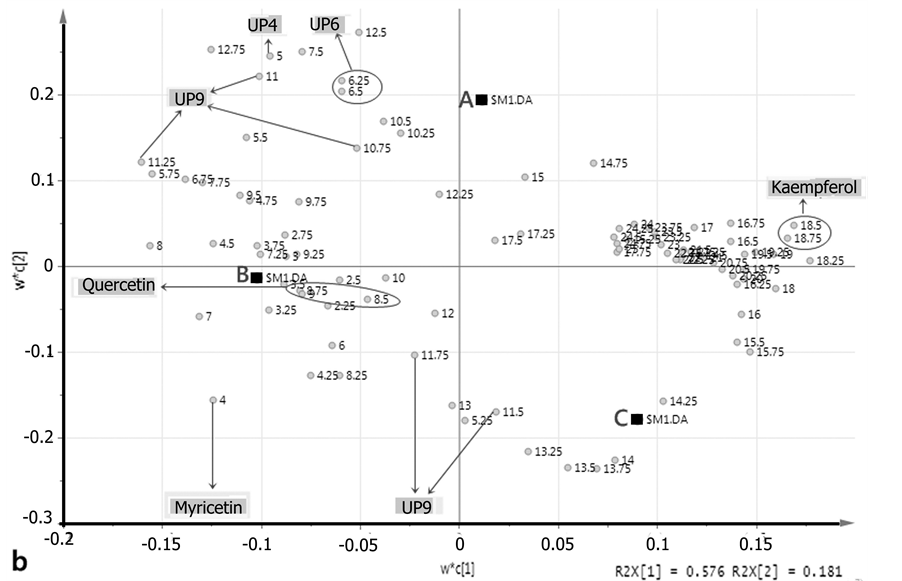 (b)
(b)
Figure 3. PLS-DA score scatter plot (a) and loading scatter plot (b) for A, B, and C clones torbangun by 2 h extraction and hydrolysis method. The 1, 2, 3, and 4 notation (after clone label) in score plot (a) was label for replication. Notations in loading plot (b) were retention times. The arrowed retention times were marker compounds of the closer reference point (rectangular dot).
 (a)
(a)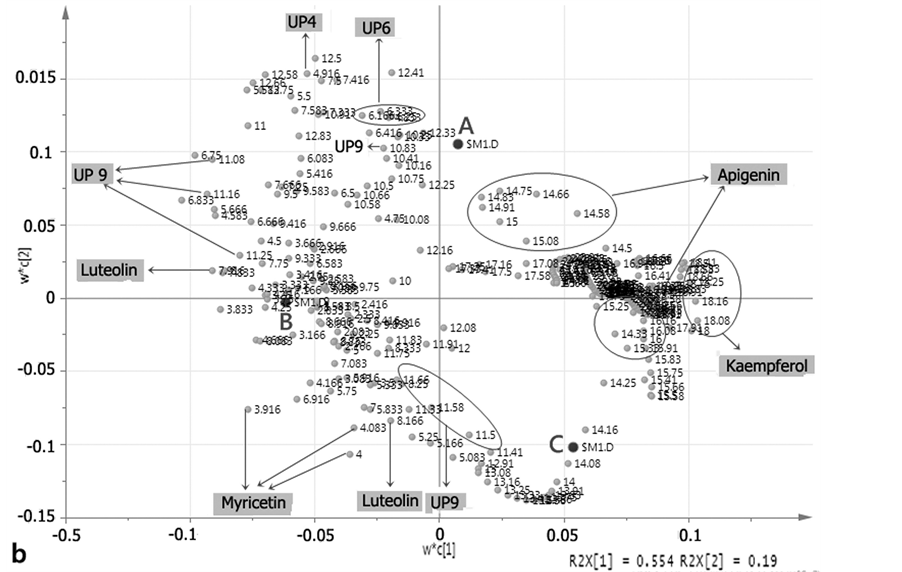 (b)
(b)
Figure 4. PLS-DA score scatter plot (a) and loading scatter plot (b) for A, B, and C clones torbangun by 4 h extraction and hydrolysis method. The 1, 2, 3, and 4 notation (after clone label) in score plot (a) was label for replication. Notations in loading plot (b) were retention times. The arrowed retention times were marker compounds of the closer reference point (rectangular dot).
17.08 - 17.58 (kaempferol) minutes.
4. Discussion
Compared to katuk (Sauropus androgynus), a shrub plant which leaves are widely known for its ability to induce breast milk in Indonesia, the three clones of torbangun contained higher concentrations of the various flavonoids. An earlier study by Andarwulan et al. [17] did not detect myricetin, luteolin, and apigenin in katuk, but did find very high content of kaempferol. The total flavonoids in katuk leaves were similar to the B clone of torbangun.
The identified unknown peaks (UP) were labeled by numbers 1 - 9 and each peak has an area of more than 10,000 mAU (Figure 5). Peaks after the 9th UP (around retention time of 12.31 - 12.99) were TBHQ, so they were excluded (Figure 1). Chromatograms of A clone torbangun were the only clone which contained 1st-9th UPs. The retention time of entire UPs were around 2.58 to 11.92 minutes. By performing the two methods, it was also shown that UPs number 2, 3, 7, and 8 had resistance to the period of reaction and higher acid levels. This was supported by the decreasing peak area when samples were analyzed using the 4h method of extraction and hydrolysis. UPs number 1, 4, and 5 have the opposite response from UPs which have been described pre-

Figure 5. Typical HPLC chromatogram of flavonoid compounds for each clone and reaction period.
Table 4. Marker compounds of each clone with different flavonoid determination method.
viously. There was an exception with UPs 6 and 9, which did not have a constant trend area betweenthe two methods. There are two possible explanations for this phenomenon: the extraction method was not optimal for the compound; or the compound was not flavonoid. As reported by previous author [15] [20] , there was no single method of flavonoid analysis which could be used for all plant material. Type of compounds binding to the matrix can affect the extraction method. Therefore, extraction of UPs no. 6 and 9 need further optimization in order to obtain more consistent results. Extraction efficiency can be improved by performing optimizations [20] [21] .
Most samples have a quite large percentage of unknown compound area, equivalent to about 47% - 89% if compared to total area of the detected compounds. The greatest unknown compounds were detected in the A clone with the 2 h-extraction and hydrolysis method. This substantial amount provides an interesting opportunity for further analysis, because it may contain unrevealed compounds. Such unknown compounds could be other flavonoids, because the analysis performed in this study using HPLC with UV-Vis detector at 370 nm, whereas flavonols and flavones have maximum absorption at this wavelength [22] .
When comparing both loading scatter plots (part B of Figure 3 and Figure 4), the 4 h-extraction method had more complex dots than the 2 h-extraction method. This occurred because in the 4 h-extraction method, the hydrolysis was longer so that the bioactive compounds could break off from its glucoside and then detected by the instrument. The unknown compounds were labeled as UP no 1 - 9. However, only compounds that have significant area were included in the determination of marker compounds with PLS-DA method, namely UP4, UP6, and UP9. Because the UP9 was present in all samples, this compound was excluded from marker compounds.A summary of marker compounds of each clone and method were shown in Table 4, while other retention times in loading plots apart from the mentioned compounds were considered as noise.
Acknowledgements
This publication was produced under USAID Cooperative Agreement No. AID-497-A-11-00003. This report is made possible by the generous support of the American people through the United States Agency for International Development (USAID). The contents are the responsibility of Bogor Agricultural University & Texas A&M Borlaug Institute for International Agriculture, and do not necessarily reflect the views of USAID or the United States Government.
References
- Dalimartha, S. (2008) Daun Jinten (Coleus amboinicus Lour.). In: Dalimartha, S., Ed., Atlas Tumbuhan Obat Indonesia Jilid 5, Pustaka Bunda, Jakarta, 25-28.
- Manjamalai, A., Narala, Y., Haridas, A. and Grace, V.M.B. (2011) Antifungal, Anti-Inflammatory and GC-MS Analysis of Methanolic Extract of Plectranthus amboinicus leaf. International Journal of Current Pharmaceutical Research, 2, 129-136.
- Prameela, T.S. and Oommen, P.S. (2011) Phytochemical Screening, Antimicrobial, and Anthelminthic Studies on Coleus aromaticus (Benth). Journal of Pharmaceutical Research and Development, 4, 93-103.
- Roshan, P., Naveen, M., Sudarshan, S., Ravindra, G., Basant, K. and Vidyanand, P. (2010) Antioxidant Potential of Leaves of Plectranthus amboinicus (Lour) Spreng. Der Pharmacia Lettre, 4, 240-245.
- Damanik, R., Wahlqvist, M.L. and Wattanapenpaiboon, N. (2006) Lactagogue Effects of Torbangun, a Bataknese Traditional Cuisine. Asia Pacific Journal of Clinical Nutrition, 15, 267-274.
- Sathasivam, A. and Elangovan, K. (2011) Evaluation of Phytochemical and Antibacterial Activity of Plectranthus amboinicus. International Journal of Research in Ayurveda and Pharmacy, 1, 292-294.
- Kundu, K., Khare, R.S. and Banerjee, S. (2011) Coleus aromaticus Benth―A Nutritive Medicinal Plant of Potential Therapeutic Value. International Journal of Pharma Bioscience and Technology, 3, 488-500.
- Thenmozhi, S., Bhuvana, M. and John, S.A. (2011) Screening of Antimicrobial and Phytochemical Investigation of Coleus aromaticus (Benth) Leaf against Five Respiratory Pathogens. Journal of Pharmacy Research, 7, 2261-2262.
- Jayadeepa, R.M., Anupama, S. and Aswathy, R.M. (2011) Insilico Techniques for the Identification of Novel Natural Compounds for Secreting Human Breast Milk. WebmedCentral Bioinformatics, 8, 1-6.
- Hansen, M. and Wold, A.B. (2010) Contents of Bioactive Compounds in Food Plants as Affected by Traditional Breeding and Environmental Factor. Proceedings from a Symposium Held at the Norwegian Academy of Science and Letters, Oslo, 13-14 November 2008, 212-222.
- Anonymous (2006) Multi-and Megavariate Analysis Part 1: Basic Principles and Application. Umetrics AB, Malmo.
- Bioversity International (2007) Developing Crop Descriptor Lists, Bioversity Technical Bulletin Series. Bioversity International, 13, 5-71.
- Shetty, K., Curtis, O.F., Levin, R.E., Witkowsky, R. and Ang, W. (1995) Prevention of Vitrification Associated with in Vitro Shoot Culture of Oregano (Origanum vulgare) by Pseudomonas spp. Journal of Plant Physiology, 147, 447-451.
- Sims, D.A. and Gamon, J.A. (2002) Relationships between Leaf Pigment Content and Spectral Reflectance across a Wide Range of Species, Leaf Structures and Developmental Stages. Remote Sensing of Environment, 81, 337-354. http://dx.doi.org/10.1016/S0034-4257(02)00010-X
- Hertog, M.G.L., Hollman, P.C.H. and Venema, D.P. (1992) Optimization of a Quantitative HPLC Determination of Potentially an Ticarcinogenic Flavonoids in Vegetables and Fruits. Journal of Agricultural and Food Chemistry, 40, 1591-1598. http://dx.doi.org/10.1021/jf00021a023
- Marinova, D., Ribarova, F. and Atanassova, M. (2005) Total Phenolics and Total Flavonoids in Bulgarian Fruits and Vegetables. Journal of the University of Chemical Technology and Metallurgy, 40, 255-260.
- Andarwulan, N., Batari, R., Sandrasari, D.A., Bolling, B. and Wijaya, H. (2010) Flavonoid Content and Antioxidant Activity of Vegetables from Indonesia. Food Chemistry, 121, 1231-1235. http://dx.doi.org/10.1016/j.foodchem.2010.01.033
- Andarwulan, N., Kurniasih, D., Apriady, R.A., Rahmat, H., Roto, A.V. and Bolling, B.W. (2012) Polyphenols, Carotenoids, and Ascorbic Acid in Underutilized Vegetables. Journal of Functional Foods, 4, 339-347. http://dx.doi.org/10.1016/j.jff.2012.01.003
- Hertog, M.G.L., Hollman, P.C.H. and Katan, M.B. (1992) Content of Potentially Anticarcinogenic Flavonoids of 28 Vegetables and 9 Fruits Commonly Consumed in the Netherlands. Journal of Agricultural and Food Chemistry, 40, 2379-2383. http://dx.doi.org/10.1021/jf00024a011
- Nuutila, A.M., Kammiovirta, K. and Oksman-Caldentey, K.M. (2002) Comparison of Methods for the Hydrolysis of Flavonoids and Phenolic Acids from Onion and Spinach for HPLC Analysis. Food Chemistry, 76, 519-525.
- Bae, H., Jayaprakasha, G.K., Jifon, J. and Patil, B.S. (2012) Extraction Efficiency and Validation of an HPLC Method for Flavonoid Analysis in Peppers. Food Chemistry, 130, 751-758. http://dx.doi.org/10.1016/j.foodchem.2011.07.041
- Lee, H.S. (2000) HPLC Analysis of Phenolic Compounds. In: Nollet, L.M.L., Ed., Food Analysis by HPLC, 2nd Edition, Revised and Expanded, Marcel Dekker Inc., New York, 775-824.
NOTES

*Corresponding author.