Journal of Geoscience and Environment Protection
Vol.05 No.08(2017), Article ID:78307,14 pages
10.4236/gep.2017.58018
Analysis of the Positive Effect from the Typhoon Saomai to the Hydrothermal Environment of Shanghai
Rong Guo1, Yongyuan Weng2
1Shanghai Central Meteorological Observatory, Shanghai, China
2Shanghai Meteorological Bureau, Shanghai, China

Copyright © 2017 by authors and Scientific Research Publishing Inc.
This work is licensed under the Creative Commons Attribution International License (CC BY 4.0).
http://creativecommons.org/licenses/by/4.0/


Received: December 19, 2016; Accepted: August 7, 2017; Published: August 10, 2017
ABSTRACT
Northwestern Pacific is the only ocean which has the most typhoon formation. The study of typhoon has far reaching significance today. Typhoon can relieve drought and make temperature drop substantially. Even we were suffering continuous high temperature in summer, the temperature would decrease immediately accompanied with typhoon. By using MODIS and weather station data to calculate the vegetation index, we analyze the drought characteristics of Shanghai during Saomai period, so that we can show the changes from the two aspects of the vegetation growth and the surface temperature. On the other hand, through the relative humidity data of Typhoon Saomai, we can find that the vegetation index and the relative humidity have been increased significantly. Typhoon rain also has its beneficial agricultural production side. It can lift the drought or ease the drought. It also provides abundant water resources for the growth of crops. In addition, the typhoon for the adjustment of the Earth’s heat, is contributed to maintain heat balance. Therefore, the typhoon to bring the changes in hydrothermal environment on the objective assessment of its impact and timely use of typhoon resources are of great significance.
Keywords:
Typhoon, Shanghai, Saomai, Hydrothermal Environment, Vegetation Index

1. Introduction
Drought is the common disaster in China, which has a severe impact on human production and life, so typhoon becomes an urgent need for the influence of drought and high temperature, especially in the condition of the effect from the appearance of over 40 times’ high temperature before the mid-August, 2013 in Shanghai. This thesis will assess how typhoon impact the water and heat environment in Shanghai from its relieving function based on the related data like daily rainfall amounts, relative moisture and MODIS [1] [2] [3] [4] . The typhoon is relatively large, so remote sensing technology can quickly obtain a wide range of data. On Typhoon monitoring and evaluation, it is of great help. It has important significance in saving energy and promoting the economic development when typhoon precipitation, combined with remote sensing method, and can alleviate the drought and research the impact on high temperature and hydrothermal environment. Kang Ruolan, et al. [1] utilized Land Observing Satellite in Taiwan Fushan Experimental Forest before and after typhoon, then analyzed influence on forest typhoon according to the change of NDVL [5] [6] ; Aosier, et al. [2] with Reflection Radiometer data, analyzed the changes of the forest NDVI, leaf area index LAI (Leaf Area Index) and VLWI (vegetation Leaf Water Index) before and after “SED”; Lee, et al. [3] combined SPOT imaging and surface DTM data, and then analyzed the NDVI changes of different species and terrain under the influence of typhoon; Wang, et al. [4] used MODIS (Moderate Resolution Imaging Spectroradiometer) images to calculate the change of NDVI, NDII (Normalized Difference Infrared Index), LAI and FPAR (Fraction of photosynthetically Active Radiation) before and after typhoon to study the impact of Typhoon on land [7] [8] [9] [10] [11] .
2. The Study of Basic Principles and Methods
With the support of Shanghai satellite and remote sensing application center, we evaluated the remote sensing of how typhoon relieve Shanghai hydrothermal environment and deducting the influence of high temperature, including comparing the measured rainfall data from meteorological stations three months, two months, one month and half a month before typhoon with data in the same period in history to calculate precipitation anomaly for analyzing water and heat environment in Shanghai before the impact of, then using remote sensing image to calculate normalized difference vegetation index, combining the calculation of normalized difference vegetation index to analyze how typhoon alleviate hydrothermal environment in Shanghai, finally, utilizing the change of the relative humidity to reflect the hydrothermal environment before and after the typhoon [12] [13] [14] [15] .
3. The Assessment of How the Typhoon Relieve the Effect of Hydrothermal Environment
Hydrothermal environment is a natural phenomenon of lacking water in a certain area and a certain period of time. Its formation and impact are not only related to natural environmental factors, but also with human social factors (this article excluding human factors). Hydrothermal environment disaster refers to the phenomenon that the specific annual, seasonal, or monthly precipitation is significantly less, which results in greater harm to production and human life in the region [16] [17] . Shanghai was mostly sunny in high temperature and little rain weather from June to August in 2005, in this period, the day with high temperature reached up to 28 days, and also had large soil evaporation, When it comes to July and August, the precipitation still consecutively little. This study integrate daily precipitation, relative humidity data, MODIS remote sensing inversion normalized difference vegetation index and water supply index in Shanghai [18] [19] , and analyze how typhoon alleviate hydrothermal environment in Shanghai from the perspective of relative humidity.
3.1. The Situation of Hydrothermal Environment in Shanghai before the Effect of Typhoon
The percentage of precipitation anomaly is the most commonly used physical quantity [7] , which is used to characterize the regional dry and wet characteristics for meteorological workers. It refers to use the percentage of a period of precipitation compared to the annual precipitation over the same period to calculate the annual precipitation anomaly percentage (Pa):
 (1)
(1)
In this formula: P refers to a station for a period of precipitation (mm);  refers to the corresponding period average precipitation for 30 years (mm).
This study calculated the percentage of precipitation of 11 meteorological stations in Shanghai during the first half month, one month, two months and three months respectively in 2005, compared with the average annual precipitation in 1976-2005. The hydrothermal environment fluctuation at each station can be seen from the picture of precipitation anomaly. The 11 stations distributed evenly in Shanghai, so it can be more comprehensively reflect how typhoon impact the hydrothermal environment in various regions of Shanghai. In addition, although the terrain is low in Shanghai, but due to the Shanghai area is often in the weather system and the edge of the typhoon affected areas with relatively large regional climate discrepancy, precipitation distribution from spatial and temporal side is not average.
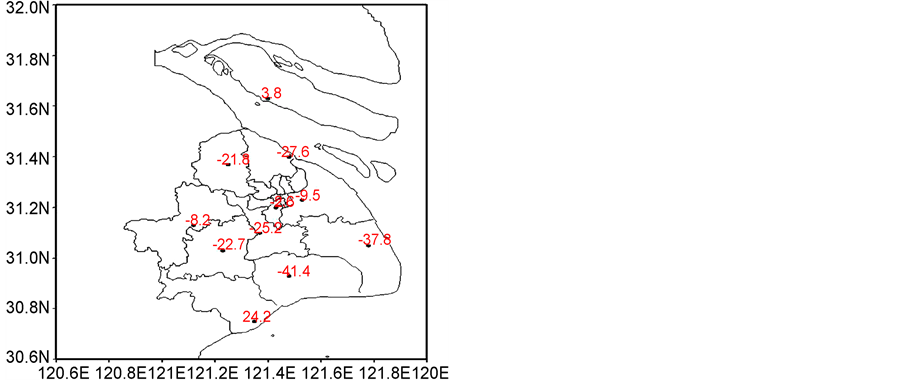
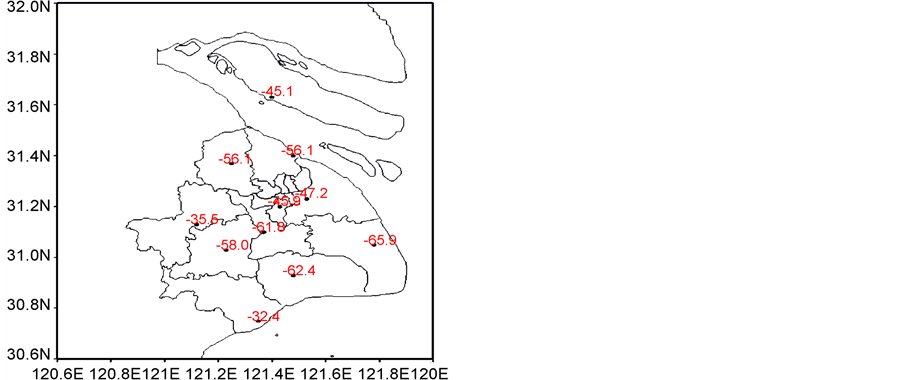
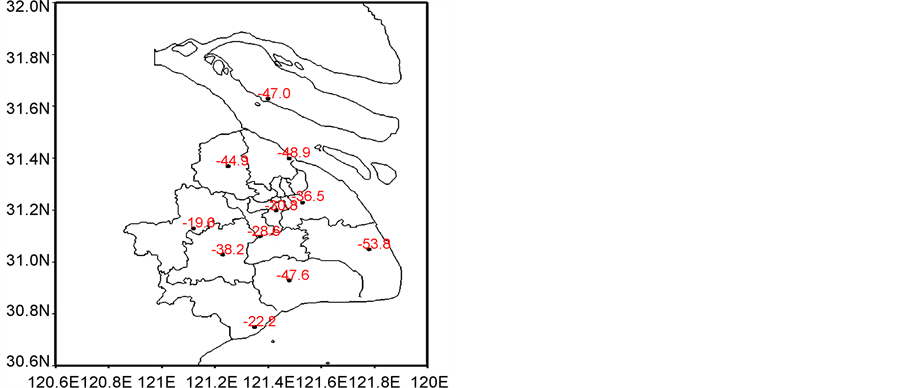
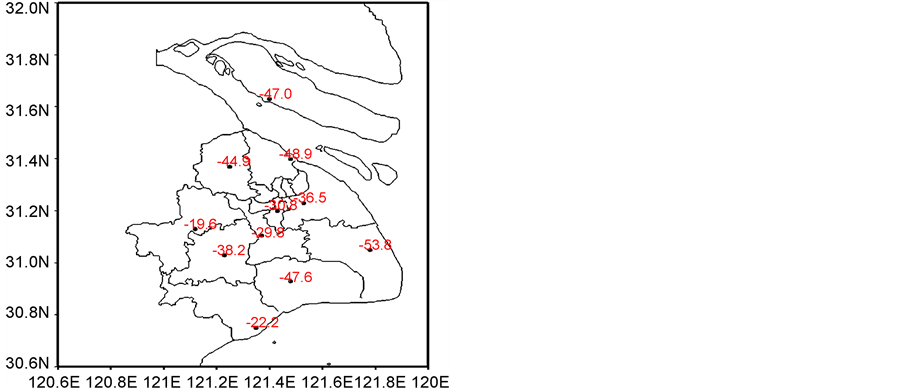
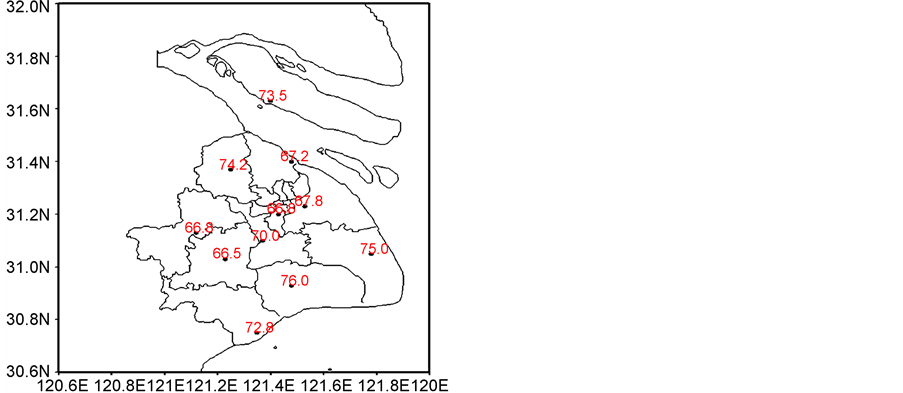
What can be seen from Figure 1 is that half a month before the typhoon, only Pudong, Xujiahui and Jinshan had average annual precipitation which is over the same period of nearly 30 years of precipitation among 11 stations in Shanghai: the precipitation anomaly percentage in Jinshan reached up to 121%, indicating that a period of time of rainfall is more abundant in Jinshan; but in the other area of Shanghai, the precipitation anomaly were among −10% - 70%, while it even reached up to −61% in Fengxian, the precipitation contrasted to the average annual precipitation was just rarely, moreover, due to less precipitation, before the first half of the month the typhoon, most parts of Shanghai was in partial hydrothermal environment condition.
Precipitation anomaly percentage is negative at most meteorological stations
 (a) (b)
 (c) (d)
Figure 1. Precipitation anomaly percentage at separate station in Shanghai in early days. (a) Half month before; (b) One month before; (c) Two months before; (d) Three months before.
in Shanghai one months before the typhoon, negative precipitation in northern Shanghai Anomaly value is greater than the negative half a month before the typhoon rainfall anomaly, positive anomaly value is less than half a month before the typhoon rainfall anomaly, while the negative anomaly value in southern meteorological station was increasing and positive anomaly was reducing. Making a contrast to the northern meteorological station, the precipitation anomaly percentage in Jiading varied 1% half a month before the typhoon to −22% a month before the typhoon; Nanhui’s changed from −16% to −38%; Pudong’s varied from 9% to −9%; Jinshan’s transferred from 121% to 24%; Xujiahui’s altered from 13% to −3%; Chongming’s increased from −12% to 4%; Minhang’s rose from −28% to −25%; Songjiang’s went up from −14% to −9%; Fengxian’s changed from −61% to −41%; the precipitation anomaly in Baoshan was from −58% to −28%; Qingpu’s transformed from −14% to −9%; The most increased area followed Jinshan, Xujiahui in the south, then Chongming in the north, ascended by 97%, 16% and 16% separately, indicating that the three sites had less precipitation during this period of time, while the most decreased followed by Baoshan, Jiading in the north and Nanhui, Pudong in the south, respectively declined by 30%, 23% and 22%, 18%, indicating that the three sites had more precipitation in this period.
It shows a negative precipitation anomaly in the northern station two and three months before typhoon. It can be seen that the average rainfall in the northern region of Shanghai half of one month, one, two and three months before typhoon are less than the same period of 30 years from the analysis of precipitation anomaly percentage before typhoon because the water and heat environment is a long-term accumulation of effect, while these areas had been in a hydrothermal environment condition for a long period; however, the southern part of Shanghai appears an opposite state, but compared to the history of the two and three months, the anomaly is still less than normal. All this illustrated that the degree of hydrothermal environment in the vast majority of parts of Shanghai was significantly worsen from May to July in 2005 than in previous years.
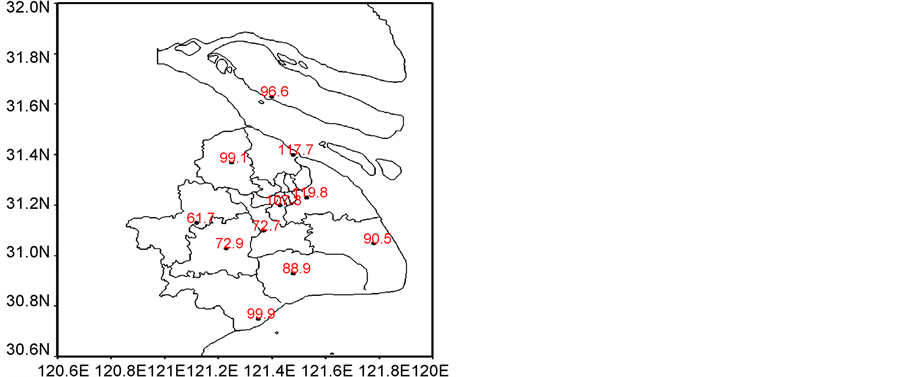
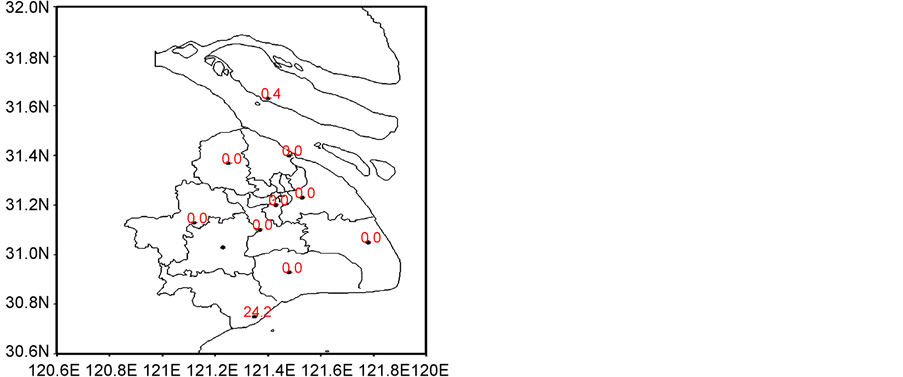
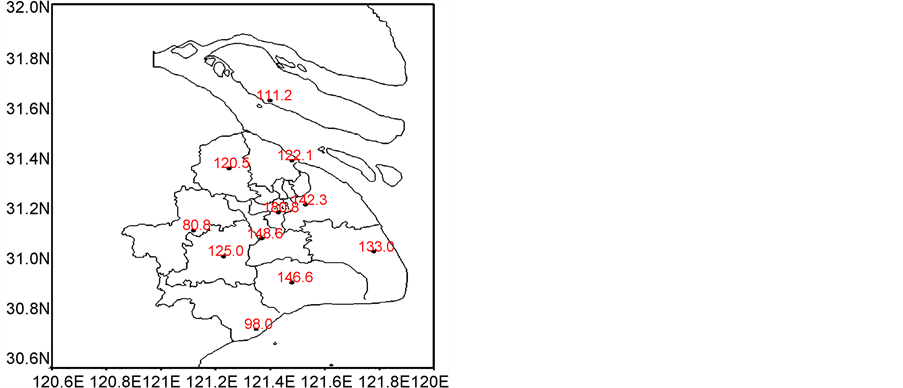
3.2. The Local Rainfall Amounts in Shanghai during the Period of the Typhoon Effecting
Although 11 rainfall meteorological stations data is single point data, owing to the small area of Shanghai, it can reflect the rainfall condition, so we can take advantage of the rainfall data on August 5 - 8 to know the rainfall data of Typhoon Saomai, as shown in Figure 2, we can see that in August 5, 2005, before the Typhoon Saomai has not landed in Zhejiang, although there are thousands of kilometers away from the typhoon center in Shanghai, but the Jinshan was affected by the cloud outside typhoon, which appeared the partial 24 mm precipitation; then at the night of August 5, 2005, after it landing in Zhejiang, heavy rain fell down in the whole Shanghai on August 6, 2005, the largest precipitation appeared in Pudong at 120 mm, Baoshan 118 mm, and Xujiahui 107 mm; Typhoon Saomai then went north into Jiangsu, and constantly continued to affect the Shanghai area, the precipitation increased more obviously than 6, August than August 7, 2005, most of the station appeared heavy rain precipitation, Xujiahui, Pudong, Fengxian, Nanhui daily rainfall reached 181 mm, 142 mm, 147 mm, 133 mm; On May 8th, Saomai continued going to the north and weakened into a tropical depression, precipitation decreased by the typhoon weak current effect, Xujiahui, Minhang, Baoshan, Pudong, Chongming respectively had 22 mm, 18 mm, 15 mm, 14 mm, 3 mm precipitation.
3.3. The Fluctuation of VI before and after the Effect of Saomai Based on the Remote Sensing Data
In the process of vegetation photosynthesis, the absorption of blue light and red light band is strong, and the energy of the vegetation reflection among the visible light is very low. However, in the near infrared band, the absorption rate of
 (a) (b)
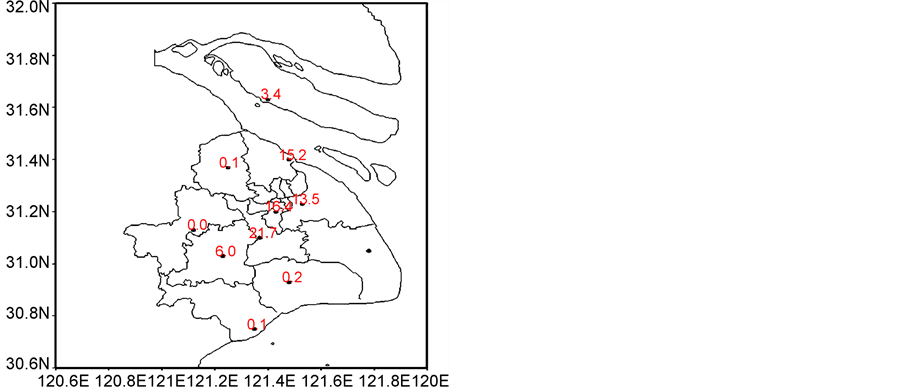
 (c) (d)
Figure 2. The precipitation at separate station in Shanghai during the affected period. (a) August, 5; (b) August, 6; (c) August, 7; (d) August, 8.
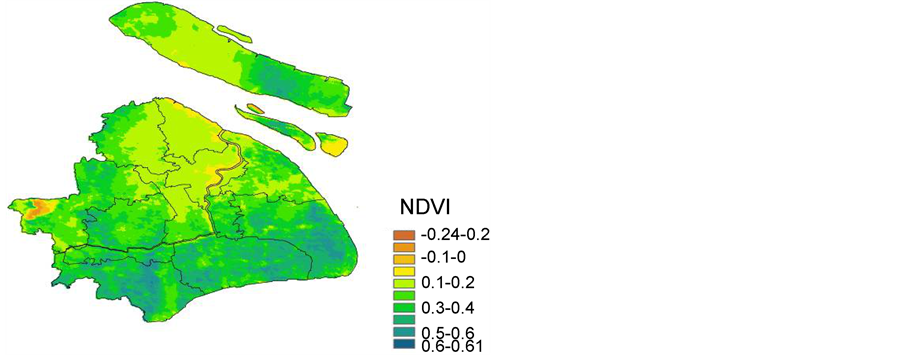
vegetation is very low, most of which are scattered by vegetation. Because of the difference of structure and optical properties, the scattering degree is different [8] . Therefore, the combination of characteristic bands with different vegetation reflection can be used to form a variety of vegetation indexes which can describe the vegetation quality and quantity, and have certain directive significance to vegetation growth and biomass [9] . In this study, the normalized difference vegetation index NDVI was calculated by using the reflection obtained from the inversion of MODIS 1B data, and the results were shown in Figure 3. Shanghai is located in China’s Yangtze River estuary region, Saomai brought it plenty of precipitation. The maximum value of NDVI in Shanghai increased from 0.68 to 0.98, Eastern Pudong, Western Nanhui and Jinshan, Fengxian and the northern Chongming, Jiading area NDVI was significantly increased, NDVI of Baoshan and the center of value is relatively small, it was related to the main routine of typhoon “Saomai”: It landed from Zhejiang, then went north to Jiangsu Nanjing, with the typhoon paving, it relatively affected mainly in southern, western and northern part of Shanghai. Extracting the area greater than zero of NDVI, the average NDVI value of Shanghai vegetation was increased from 0.38 to 0.54.
The change of average NDVL from 11 meteorological stations in Shanghai before and after Typhoon Saomai can be seen in Table 1. The average NDVL from 11 meteorological stations have increased greatly, the most are Jinshan and Fengxian, which increased 0.46 on average; the least are Minhang and Baoshan, which increased 0.12 and 0.11. The other stations increased by 0.15 - 0.40 basically, it is evident that the NDVI index has increased greatly in the majority of area of Shanghai from Figure 3, especially the frontier area influenced by “Sangmei”, there is a great impact on vegetation from vegetation index analysis before and after the Typhoon Saomai, above 70% of the vegetation have been completely alleviated by hydrothermal environment.
Because the different vegetation has different reactions to the hydrothermal environment and precipitation, according to the statistics of MODIS land cover
 (a)
(a)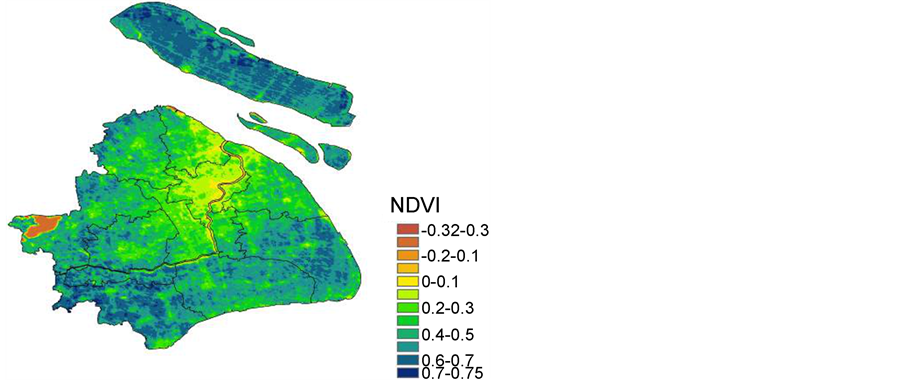 (b)
(b)
Figure 3. The NDVI before and after the Typhoon Saomai in Shanghai. (a) Before (August, 3); (b) After (August, 10).
product classification, the vegetation area of Shanghai is divided into green land (forest), grassland and cultivated land of three classes (Figure 4 from Shanghai city and satellite remote sensing application center). As can be seen from the map areas which has more green land such as Nanhui, Pudong, Songjiang, Fengxian have larger average change of vegetation water supply index. There is something to do with the green land (Woodland) has developed roots which can fully absorb the deep soil moisture so that it has a certain resistance to water and heat environment. And the reason why the amount of green land (Woodland) increased most is because of the root system of the role of infiltration, which increased soil pore in order to save more rain.
3.4. The Fluctuation of Relative Humidity (RI) before and after the Effect of Saomai
Relative humidity can represent the physical quantity of dry and wet degree,

Table 1. The change of NDVI before and after the Typhoon Saomai in Shanghai areas.
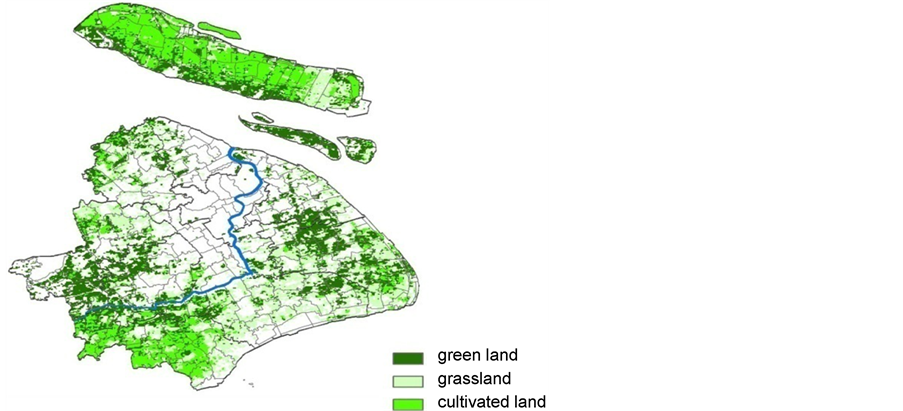
Figure 4. Land cover classification map of Shanghai in 2005.
which is an important part of atmospheric circulation. It is a significant factor affecting growth that can affect the productivity of vegetation, meanwhile, it is also an important indicator to monitor the hydrothermal environment.
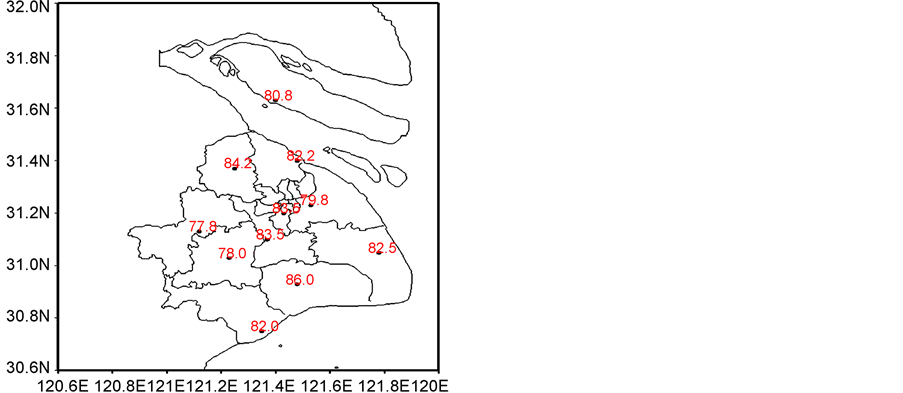
Because the Shanghai area is small, with relatively low accuracy of inversion data (resolution about 40 km), soil moisture cannot inverse, especially the heavy cloud-layer weather, the relative humidity of satellite remote sensing data measured are unable to solve both from scale and resolution and capacity for Shanghai, and Shanghai is only one site soil moisture observation that cannot fully represent Shanghai entirely, we carefully considered the relative humidity of the conventional determination as the characterization due to impact on the water and heat environment and high temperature that Saomai brought, and 11 sites were evenly distributed which also more comprehensive on behalf of the relative humidity change entirely Shanghai. So this study takes the average relative humidity data in August 1st, August 2nd, August 3rd and August 4th from 11 stations as relative humidity before typhoon in Shanghai and data in August 5th, August 6th, August 7th and August 8th as the relative humidity of Shanghai after typhoon, the changes of relative humidity before and after the typhoon in Shanghai as shown in Figure 5.
From Figure 5, we can see that relative humidity in most parts of Shanghai are mostly less than 70% before typhoon, while Chongming, Nanhui, Fengxian, Jinshan, the area whose relative humidity is greater than 70% is mainly due to the sea and rivers by water influence; and relative humidity in most areas of Shanghai are more than 80%, some even more than 85% after typhoon. Based on the relative humidity before and after typhoon (Figure 5), the average relative humidity of the whole Shanghai before typhoon is about 71%, and it increases to 82% after typhoon. The average relative humidity of the typhoon before and after the typhoon is shown in Table 2. The average relative humidity of the area affected by typhoon increased, Xujiahui increased the most, an increase of 17%;
 (a) (b)
Figure 5. Comparison of relative humidity at separate station in Shanghai affected by typhoon. (a) before; (b) after.
while Chongming county increased the least, an increase of 8%.
The relative humidity in Shanghai has the same change tendency in general. After Typhoon Saomai, the average and relative humidity of 11 stations with observation data increased. The rainfall it brought also increased the average relative humidity of different land cover types (farmland, woodland, grassland) to various degree. The green land (Woodland) is more obvious, which is consistent with the change of vegetation water supply index.
Utilizing 4 days’ compound relative humidity data mentioned above from 11 stations before and after the typhoon to research the local relative humidity, and extract, analyze the influence of relative humidity on 11 meteorological stations (Figure 6). According to Figure 6, the relative humidity of the 11 meteorological stations in northern and southern Shanghai area increases separately. Baoshan and Xujiahui increased obviously, increasing by 16% and 17%, respectively.
Table 2. Changes of relative humidity at meteorology station in Shanghai affected by typhoon.
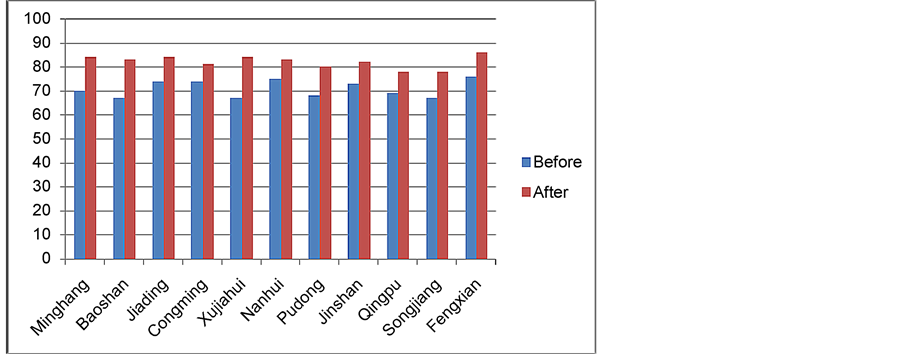
Figure 6. Comparison of relative humidity at meteorological station in Shanghai affected by typhoon.
Because the Typhoon Saomai landed in Zhejiang province on 1 a.m, 6 August, but on August 5th, Shanghai is located in the range of the seven level within the circle, heavy rain occurred in Shanghai influenced by the Typhoon Saomai, and in August 4th, most measured rainfall is 0, so we take August 5th as the first day being affected by typhoon Comparison of relative humidity of all stations in Shanghai during the previous day (August 4th) and relative humidity during typhoon rainfall (August 5 - 8) can be seen in Figure 6. The influence of typhoon rainfall on the relative humidity of each site can be seen from the Figure. Affected by typhoon, the relative humidity of meteorological stations increased in the range of 10% to 20%. The relative humidity increases greatly are Xujiahui (17%), Minhang (15%) and Baoshan, Jiading, Songjiang (12%), the smallest increase of relative humidity including Chongming Jinshan (8%) and Nanhui (6%), and the smaller increase of it is Fengxian (10%), Qingpu (11%). We can see that the meteorological stations in the downtown area increased most, the average increase is 13.6%, suburban meteorological stations and the meteorological stations near the river is increased by 9.4%.
Typhoon “Sang Mei” brings precipitation to increase relative humidity and alleviate hydrothermal environment. In order to understand the relationship between precipitation and relative humidity, this study used (August 1, 2005 August 8th) daily measured rainfall and relative humidity of the meteorological station before and after the typhoon to analyze the relationship between the typhoon rainfall and relative humidity. Because the relative humidity in the same day has the fluctuation, this research will analyze each meteorological station date with the same day rainfall amount (Figure 7). Typhoon rainfall affected Shanghai mainly in August 5th to August 8th, relative humidity has varying degrees of rise at all stations in Shanghai area in these days. Although the heterogeneity of the surface causes the amount of rainfall cannot be directly reflected in the relative humidity, but because of typhoon precipitation, the relative humidity of all meteorological stations have increased significantly.
Xujiahui has the most rainfall among 11 meteorological stations in Shanghai up to 306.5 mm from August 5th to 8th, which the rainfall in August 7th was

Figure 7. Time chart between relative average humidity and daily precipitation at meteorology station in Shanghai based on typhoon.
180.8 mm, its relative humidity reached 69% from August 3rd to 90% on August 7th. After typhoon, meteorological stations in relative humidity was highest in Fengxian and Xujiahui, had reached the highest humidity 91% on August 6th, Fengxian meteorological station accumulated 235.7 mm rainfall in August 5 - 8 days while relative humidity was 74% on August 3rd, increased by 17%. Although Jinshan, Nanhui, Chongming also received an effect of typhoon precipitation, but the relative humidity increases less obviously than Jiading, Xujiahui, Min Hang, mainly because the region is located in the coastal or Yangtze River surrounded by the effects of precipitation and relative humidity can easily influenced by the River and sea. 11 meteorological stations in Figure 7, August 4 - 8, the rainfall, from the most to the least followed by Xujiahui (306.5 mm), Pudong (275.6 mm), Baoshan (255 mm), Minhang (243 mm), Fengxian (235.7 mm), Nanhui (223.5 mm), Kingsoft (222.2 mm), Jiading (219.7 mm), Chongming (211.6 mm), Songjiang (203.9 mm), Qingpu (152.5 mm). Xujiahui meteorological station has the most precipitation, its relative humidity reaches the highest, 91%, on August 6th.
Because the change of relative humidity of each station is single point data, the change of relative humidity of Shanghai is reflected by all meteorological stations. In order to understand the trend of relative humidity influenced before and after typhoon, we analyze the impact of Typhoon on the relative humidity of Shanghai. Relative humidity is the average relative humidity of 11 meteorological stations in the city, and rainfall is the average daily rainfall of the 11 meteorological stations. What can be seen from Figure 7, the average relative humidity of 66% in August 1st, before the arrival of the typhoon from August 1st, the relative humidity shows a slow upward trend overall, but the increase speed is not fast, mainly affected by the typhoon cloud band. Until August 4 - 7, when typhoon arrived, relative humidity increased rapidly, the highest relative humidity reached 86% in August 7th. Due to the arrival time was summer, the temperature was higher, after the typhoon (after August 8th) temperature rose, soil evaporation accelerated, and there is no rainfall, so the relative humidity gradually reduced.
Because the rainfall at separate stations three months, two months and a month ago all cannot reach the same period in 1976-2005 years, so the relative humidity level is similar to the same period in the northern region. When typhoon arrived, the average relative humidity in the north and south rose sharply. A good amount of rainfall that typhoon brought, to a certain extent, alleviate the water environment in Shanghai.
In summary, after the Typhoon Saomai, it brought city plenty of rainfall, and the average humidity increased after typhoon, the climate is relatively humid, more lush vegetation growth in Shanghai, which increased ground infiltration, enhanced transpiration, reduced canopy temperature at the same time, so vegetation index also increased. Relative humidity and water supply index increased, too. Meanwhile the hydrothermal environment before typhoon was alleviated.
4. Conclusions and Discussion
1) Using the measured rainfall data in Shanghai to calculate the hydrothermal environment of Shanghai before and after the typhoon Saomai, the results show that the hydrothermal environment of Shanghai has been significantly alleviated by typhoon;
2) Making a contrast before and after typhoon from the vegetation index and water supply index, the vegetation growth index of Shanghai area has been greatly improved by typhoon, and the vegetation hydrothermal environment has been greatly alleviated;
3) Utilizing the change of relative humidity at the 11 sites in Shanghai before and after Typhoon Saomai to analyze how typhoon relieve hydrothermal environment. What’s more, affected by the typhoon, relative humidity in Shanghai increase 20 values, to a certain degree, it also reflects that the typhoon eased the hydrothermal environment in Shanghai.
Cite this paper
Guo, R. and Weng, Y.Y. (2017) Analysis of the Positive Effect from the Typhoon Saomai to the Hydrothermal Environment of Shanghai. Journal of Geoscience and Environment Protection, 5, 221-234. https://doi.org/10.4236/gep.2017.58018
References
- 1. Kang, R., Lin, D., Zhan, J., et al. (2005) Study of the Fluctuation of the NDVL in Fukuyama’s Experimental Field before and after Being Affected by the Typhoon Bilis in 2000. Taiwan Forestry Science, 20, 73-87.
- 2. Aosier, B. and Kaneko, M. (2007) Evaluation of the Forest Damage by Typhoon Using Remote Sensing Technique. IEEE International Conference on Geoseience and Remote Sensing Symposium, Barcelona, 23-27 July 2007.
- 3. Borghuis, A.M., Chang, K. and Lee, H.Y. (2007) Comparison between Automated and Mapping of Typhoon-Triggered Landslides from SPOT-5 Imagery. International Journal of Remote Sensing, 28, 1843-1856.
- 4. Li, L., Wang, Y., Adler, R.F., et al. (2009) Evaluation of the Real-Time TRMM-Based Multi-Satellite Precipitation Analysis for an Operational Flood Prediction System in Nzoia Basin, Lake Victoria, Africa. Natural Hazards, 50, 109-123.
- 5. Song, L. (2003) The Hydrothermal Environment. China Meteorological Press, Beijing.
- 6. Lu, Y. and Xiao, G. (2001) Meteorological Disasters and Defence. China Meteorological Press, Beijing.
- 7. Wei, J. and Ma, Z. (2003) Comparison among Hydrothermal Environment Index, Surface Humid Index and Precipitation Anomaly. The Geographical Journal, 55, 117-124.
- 8. Du, G. (2005) Study and Application of the VI Monitoring Model Based on EOS/MODIS. Master Dissertation, Huazhong University of Science and Technology, Wuhan, 1-59.
- 9. Chen, S., Tong, Q. and Guo, H. (1998) Study of the Remote Sensing Information Mechanization. Science Press, Beijing.
- 10. Wang, X. and Guo, N. (2003) Methods and Development of the Study on Monitoring Hydrothermal Environment by Remote Sensing. Meteorology of Hydrothermal Environment, 21, 76-81.
- 11. Song, X. and Zhao, Y. (2004) Study of Applying the MODIS Satellite Data to Extract the Compound Vegetation-Temperature-Water Number. Geography and Geo-Information Science, 20, 13-17.
- 12. Carlson, T.N., Gillies, R.R. and Perry, E.M. (1994) A Method to Make Use of Thermal Infrared Temperature and NDVI Measurements to Infer Surface Soil Water Content and Fraetional Vegetation Cover. Remote Sensing Reviews, 9, 161-173.
https://doi.org/10.1080/02757259409532220 - 13. Goetz, S.J. (1997) Multi-Sensor Analysis of NDVI, Surface Temperature and Biophysical Variables at a Mixed Grassland Site. International Journal of Remote Sensing, 18, 71-94.
- 14. Qi, S., Luo, C., Wang, C., et al. (2006) Study of the Relation between Air Temperature and Land Surface Temperature, Spectral Vegetation Index. Remote Sensing Technology and Application, 21, 130-136.
- 15. Xia, H., Wu, J., Liu, Y., et al. (2005) Development of the Study on Applying Remote Sensing to Monitoring Hydrothermal Environment in China. Remote Sensing Information, No. 1, 55-58, 31.
- 16. Mo, W., Wang, Z., Sun, H.,, et al. (2006) Study of the Remote Sensing Monitoring Based on the Hydrothermal Environment on Farmland. Journal of Nanjing Institute of Meteorology, 29, 396-401.
- 17. Yang, L., Wu, R. and Run, W. (2007) Study of Monitoring Hydrothermal Environment. Environment Monitoring, 21, 226-225, 239.
- 18. Qin, Q., Ghulam, A., Zhu, L., et al. (2008) Evaluation of MODIS Derived Perpendicular Drought Index for Estimation of Surface Dryness over Northwestern China. International Journal of Remote Sensing, 29, 1983-1995.
- 19. Liang, Y., Zhang, F. and Han, T. (2007) Utilization of EOS/MODIS on Monitoring the Soil Moisture in Qingyang. Meteorology of Hydrothermal Environment, 25, 44-47.