Open Journal of Orthopedics
Vol.3 No.2(2013), Article ID:33171,8 pages DOI:10.4236/ojo.2013.32028
Examining Gait Patterns after Total Knee Arthroplasty Using Parameterization and Principal Component Analysis
![]()
1Andrew and Marjorie McCain Human Performance Laboratory, Faculty of Kinesiology; University of New Brunswick, Fredericton, Canada; 2Institute of Biomedical Engineering, University of New Brunswick, Fredericton, Canada.
Email: keroy@unb.ca
Copyright © 2013 Kevin E. Roy et al. This is an open access article distributed under the Creative Commons Attribution License, which permits unrestricted use, distribution, and reproduction in any medium, provided the original work is properly cited.
Received April 26th, 2013; revised May 25th, 2013; accepted June 3rd, 2013
Keywords: Total Knee Arthroplasty (TKA); Principal Component Analysis (PCA); Parameterization; Gait Analysis
ABSTRACT
The use of parameterization in assessing gait waveforms has been widely accepted, although it is recognized that this approach excludes the majority of information contained in the waveform. Waveform analysis techniques, such as principal component analysis (PCA), have gained popularity in recent years as a more effective approach to extracting important information from human movement waveforms, but are more challenging to interpret. Few studies have compared these two different approaches to determine which yields the most relevant information. This study compared the kinematic patterns during gait of six total knee arthroplasty (TKA) subjects (10 TKA knees), to a group of 10 agematched asymptomatic control subjects (19 control knees). An eight-camera Vicon M-cam system was used to track movement and compute joint angles. Group differences in parameterization (max and min peaks) values and principal component scores were tested using one-way ANOVA and Kruskal-Wallis tests. Using parameterization, the TKA group was characterized by reduced hip extension, increased hip flexion, increased anterior pelvic tilt, increased trunk tilt, and reduced sagittal ankle angles compared to the control group. Waveform analysis, by means of PCA, showedmagnitude shifts in sagittal ankle waveforms between groups, rather than solely reporting differences in peaks. Waveform analysis also indicated a significant shift in the magnitude of the entire waveform for hip angles, pelvic tilt, and trunk tilt, indicating no change in range of motion between groups, but rather a change in the way in which range of motion is achieved at the hip. This study has identified several gait variables that were significantly different between the TKA and control groups. Our results suggest that waveform analysis is effective at identifying magnitude shifts as sources of variability between groups, which would not necessarily be analyzed using conventional parameterization techniques unless one knew a priori where the variability would exist.
1. Introduction
Each year a growing number of knee replacements are performed in Canada, representing a 141% increase from 1997 to 2007 (Canadian Joint Replacement Registry). Knee arthroplasty is often required when the articular cartilage of the knee becomes worn, which is often caused by diseases such as osteoarthritis or rheumatoid arthritis [1]. When non-surgical interventions such as rest, weight loss, and medication fail, knee arthroplasty is performed in an attempt to reduce pain and recover range of motion. Knee arthroplasty consists of totally or partially replacing the femoral condyles and the articulating surfaces on the tibia with prosthetic devices. The Canadian Joint Replacement Registry (2009-10) indicates that the majority (95%) of knee replacements are characterized by total knee arthroplasty (TKA). This procedure consists of replacing both femoral condyles and their articulating surfaces on the tibia.
Much research has focused on the gait patterns of individuals after TKA. Of particular interest is whether post-operative gait patterns are similar to those of individuals with healthy knees. To date, most studies have used parameterization methods to extract key points (e.g., peak joint angles) from biomechanical waveforms in TKA and control groups. These methods are associated with a loss of temporal information and the pattern of movement is not considered. In addition, the variables that are extracted from biomechanical waveforms must be determined a priori. The analysis of gait data using waveform analysis could provide additional insight into the differences in gait patterns between TKA and control groups since the whole waveform is examined.
Only a few studies have examined gait patterns in TKA using waveform techniques, several studies use principal component analysis (PCA) to examine gait, and their results indicate that PCA can effectively identify differences in kinetic waveforms at the hip for TKA versus control subjects [2-6]. This study emphasized the need for statistically-based methods by which one can discriminate and classify subjects based on the entire waveform. Once the principal component model has been established to describe gait patterns using the reference group, in this case the control group, the model can be used to assess the waveforms of the experimental group and identify abnormal gait. Missing from the literature is a direct comparison between parameterization and PCA to examine the same data.
Comparisons of gait between normal and TKA groups have been performed by several researchers, many of which have shown that gait patterns differ significantly from healthy controls [5,6,7-10]. Andriacchi et al. (1982) indicated shorter stride length, reduced mid-stance knee flexion, and abnormal patterns of external knee flexion-extension moment. Kramers de-Quervain et al. (1997) found that TKA subjects demonstrated slower gait velocities, decreased single stance time, and decreased knee range of motion during the stance and swing phase. Significant decreases in gait velocity and stride length in TKA groups compared to control groups is predominant in past studies [8,11,12], although a few studies reported no significant differences in these variables [13,14].
The purpose of this study was to examine the effectiveness of parameterization and waveform (PCA) analysis techniques in identifying kinematic differences between an ageand gender-matched control group and a TKA group. It was hypothesized that the waveform analysis would be more effective at identifying differences between groups as it directs the user to the areas of the curve where the most variability exists [15]. The parameterization techniques typically examine the areas of the curve where variability between groups is expected.
2. Materials &Methods
2.1. Study Participants
Participants between the ages of 54 and 84 years were recruited for the study, as the Canadian Joint replacement Registry (2008-2009) indicates that most (89%) knee replacements occur in individuals within this age range. Six individuals (N = 6) with a total of ten TKAs (n = 10) were recruited. Four participants had undergone bilateral TKA and two had unilateral TKAs. Further participant characteristics are provided in Table 1. All participants were at least six months post-operative and within 2 years of primary replacement at the time of the study. None of the participants had received revisions to their TKA or required revisions at the time of testing.The control group consisted of 10 (N = 10) ageand gender-matched individuals who had no prior lower extremity diagnosis of injury or disease. Ethical approval for this study was obtained from the University of New Brunswick Research Ethics Board. Written consent was obtained from participants prior to their participation in this study.
2.2. Instrumentation/Apparatus
An eight-camera Vicon M-Cam motion capture system (Oxford Metrics Group Ltd. Oxford, UK) was used to track the three-dimensional locations of retro-reflective markers on the skin at a sampling frequency of 60 Hz. Four Kistler force plates (Kistler Instruments, Winterhur, Switzerland) embedded in the floor of the lab measured the three-dimensional forces and moments during each gait cycle at a sampling frequency of 1500 Hz. Anthropometric measures were obtained using calipers, a stadiometer, and a weight scale. Data were exported for processing using custom Matlab software (Mathworks, Inc. Natick, MA, USA).
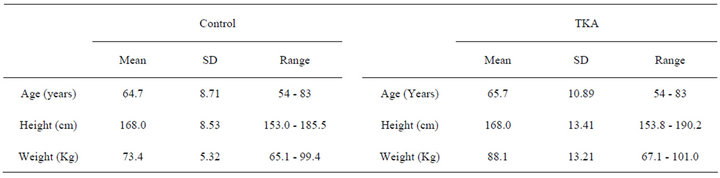
Table 1. Anthropometric measures for the control and TKA groups.
2.3. Study Design
Data were collected at the motion analysis laboratory at the Institute of Biomedical Engineering at the University of New Brunswick. Participants wore shorts and a tank top to allow the retro-reflective markers to be adhered directly to the skin. Each body segment was defined by markers placed over key anatomical locations. Participants were asked to perform several practice gait trials to familiarize themselves with the lab environment and the 8m walkway. A static trial was recorded for each participant while they were standing in the anatomical position in the center of the measurement volume. This trial provided data necessary for joint center computations. Participants were then instructed to walk at a self-selected pace until at least six usable trials were collected for both the left and right legs.
2.4. Data Analysis
Trial selection was based on temporal-spatial measures for each gait trial. For each participant, cadence, velocity, and percent of cycle spent in single stance were computed for the gait trials. Based on these three measures, the single gait cycle that most closely approximated the mean of all gait cycles for the individual was selected for analysis. Raw kinematic data were filtered using a second-order, zero-lag, 6 Hz low-pass Butterworth filter. A rigid body model was used to calculate angles, velocity and acceleration of the following segments; left and right feet, shanks, thighs, and the pelvis and trunk. The locations of three non-collinear markers on each segment were used to create embedded coordinate systems at the joint centers. Joint centers were estimated in accordance with Davis et al. (1991). Joint angles were computed from the relative orientations of the embedded coordinate systems using Euler angles in a yxz sequence, corresponding to flexion/extension, adduction/abduction, and internal/external rotations.
Significant differences (P < 0.05) in temporal-spatial parameters and discrete parameters between the control and TKA groups were tested using a series of one-way ANOVA’s with Bonferroni adjustments. For parameterization, peak flexion and extension were examined at the trunk, pelvis, hip, knee and ankle. All statistical tests were performed using SPSS (SPSS Inc.). Using PCA for the six kinematic waveform variables, the major modes of variation were determined. Further information on the application of this PCA method to biomechanical data can be found in Wrigley et al. (2006). To group the data from all of the individuals, each waveform was normalized to 51 points, one for every 2% of the cycle. For the control group, right and left leg gait cycles were pooled for a total of 20 gait cycles. A loss of data occurred for the left limb of one individual, resulting in 19 gait cycles (n = 19) for subsequent analysis. Data from 29 cycles (19 control, 10 TKA) were stored in a 29 × 51 matrix (number of cycles × number of time points), for a total of four matrices (number of waveform variables). Principal component scores were assessed to determine which waveforms would be further analyzed (trunk tilt, pelvic tilt, hip flexion/extension, ankle flexion). All waveform data were transformed into principal components using an eigenvector-analysis of the covariance structure. By scaling the eigenvalues to the percentage of total variation captured, the number of principal components to retain was determined using parallel analysis [17,18]. The parallel analysis method retains and subsequently analyzes only those principal components that captured a greater amount of variability than would be expected by chance. All PCA calculations were performed using Matlab (Mathworks, Natick, Massachusetts, USA). Principal component numbers (e.g., PC1) refer to the principal component retained for comparison.
For each waveform variable, between-group differences were examined using the principal component scores, principal component coefficients, and principal components scaled to the proportion of variability explained. Principal component scores provide a measure of distance, indicating how closely each waveform conforms to the mode of variability represented by each principal component. Principal component coefficients provide measures of the magnitude and direction of deviation from the mean curve for each waveform variable. Scaled principal components provide information on where in the gait cycle a principal component loads the greatest.
A Shapiro-Wilk test of normality for principal component scores revealed that assumptions for multivariate normality for a MANOVA could not be met. Therefore, a series of one-way ANOVA’s with Bonferonni adjustments were used to test for significant differences in principal component scores that were normally distributed. The Kruskal-Wallis test was used to test the principal components that failed to meet the assumption of normality.
3. Results
No significant (P > 0.05) between-group differences were observed in temporal-spatial data, though the control group did tend to walk faster (126.0 cm/s) than the TKA group (116.1 cm/s) (Table 2).
3.1. Parameterization
Joint angle data revealed a significant reduction in (P < 0.05) mean peak hip extension in the TKA group (mean ± 1 SD: −10.05 ± 4.96) during stance phase compared to the control group (mean ± 1 SD: −17.86 ± 8.60). Mean
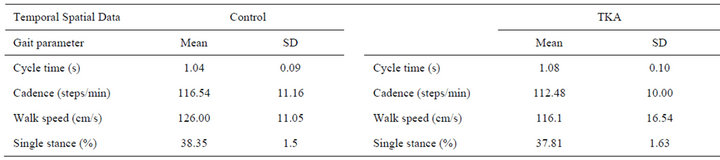
Table 2. Mean temporal-spatial results for the control and TKA groups.
peak hip flexion in the TKA group (mean ± 1 SD: 38.01 ± 7.53) was significantly greater than the control group (mean ± 1 SD: 29.20 ± 8.72) at the beginning of the stance phase.
The TKA group also demonstrated significantly higher (P < 0.05) mean peak anterior pelvic tilt (mean ± 1 SD: 15.61 ± 8.24) compared to the control group (mean ± 1 SD: 6.94 ± 6.91) during stance phase (Table 3).
3.2. Waveform Analysis
Significant group differences (P < 0.05) were found four of the principal component scores: 1) sagittal ankle angle PC2, 2) sagittal hip angle PC1, 3) pelvic tilt PC1, 4) trunk tilt PC1. Descriptive data for these principal component scores are provided in Table 4.
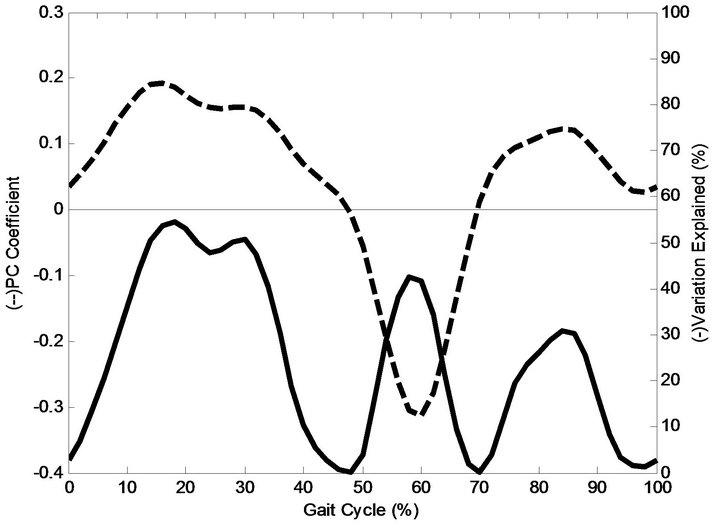
Sagittal ankle angle PC2 (Figure 1(a)) accounted for 25% of the total variation and coefficients captured differences in the pattern of the waveforms by either adding or subtracting from the mean waveform during the gait cycle. A negative PC score (Table 4) and a positive principal coefficient (Figure 1(a)) for the first 47% of the gait cycle indicate that the TKA group deviates by reduced ankle dorsiflexion. From 48-69% of the gait cycle, the principal component coefficient becomes negative and the sagittal ankle angle for the TKA group adds to the mean, resulting in increased dorsiflexion angle until 62%, when the ankle begins to move into plantarflexion just prior to toe-off. This is followed by reduced plantarflexion, evident until 69% of the cycle. For the remainder of the cycle (70% - 100%), the principal component coefficient becomes positive resulting in reduced dorsiflexion during the swing phase.
To assess the relative importance of the principal component coefficients, sagittal ankle angle PC2 was scaled to the percentage of variation explained and plotted in Figure 1(a). When plotted in this form, it is evident that a significantly different pattern of variability exists in three separate portions of the gait cycle (Figure 1b). The first occurs during the first half of the cycle (0% - 47%) with approximately 55% of the total variability accounted for at 18% of the gait cycle. From mid-cycle to early swing (48% - 70%), approximately 43% of the total variability was explained at 58% of the cycle. During the swing
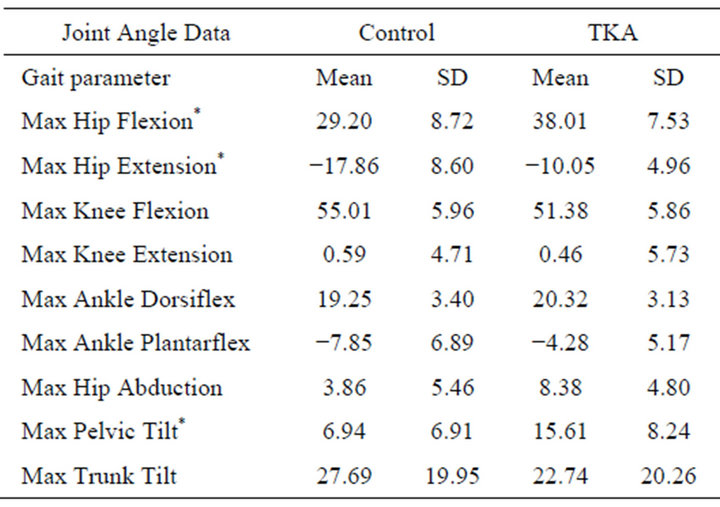
Table 3. Mean joint angle results across groups. “*” refers to significant differences (P < 0.05) between the control and TKA groups.
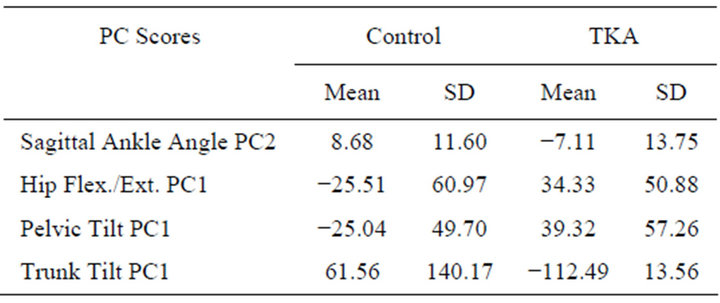
Table 4. Group descriptive data for PCA scores found to be significantly different (P < 0.05).
phase, a smaller peak accounts for a maximum of 31% of the total variation.
To illustrate the mode of variability captured, mean principal component scores for sagittal ankle angle PC2 were transformed into the original coordinate space to create representative waveforms. These waveforms for the mean, control, and TKA groups are plotted in Figure 1(b). The TKA group shows reduced dorsiflexion angles for nearly the first half of the cycle. Dorsiflexion increased after mid-cycle followed by reduced plantarflexion until shortly after toe-off. The remainder of the cycle is characterized by reduced dorsiflexion.
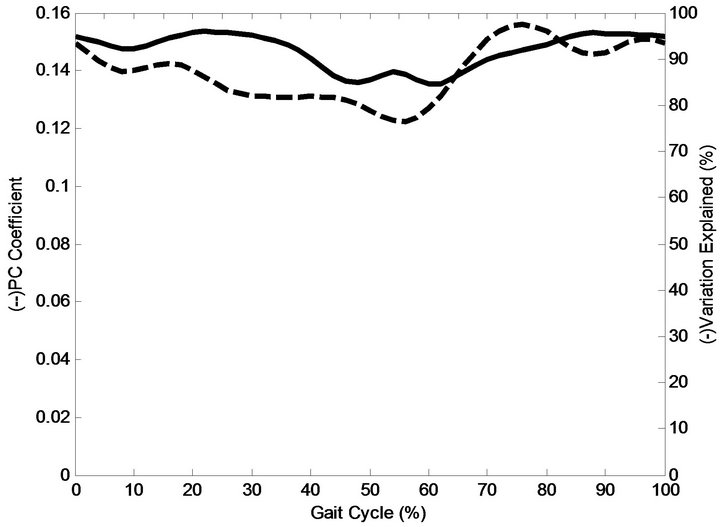
Sagittal hip angle PC1 accounted for 92% of the total variation (Figure 2(a)) and captured differences in the magnitudes of the waveforms. A maximum of 99% of
 (a)
(a)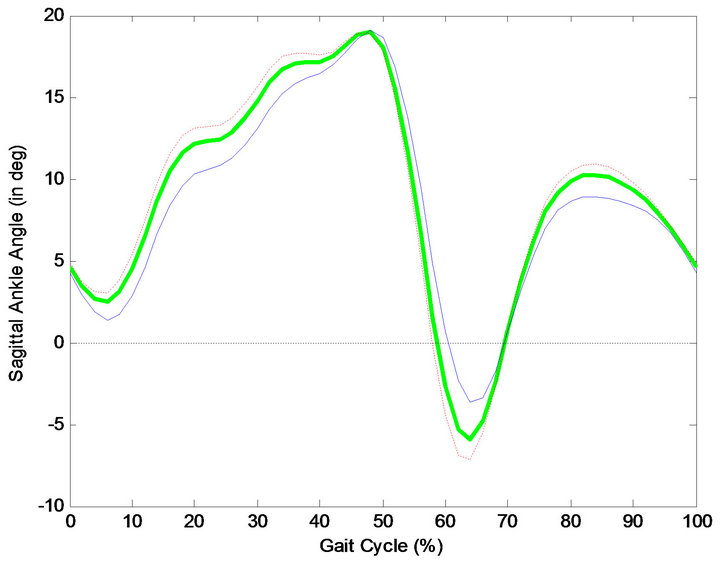 (b)
(b)
Figure 1. (a) Sagittal ankle angle PC2 plotted in the original from (dotted), and as a percentage of variation explained (solid); (b) Sagittal ankle angle: Mean curve (heavy solid green) of sagittal ankle angle, along with control group (red), and TKA (blue).
the variation was captured during swing phase at 76% of the cycle. Significant differences in PC1 scores for hip flexion were observed between the control group and the TKA group. The positive principal component coefficient (Figure 2(a)) combined with the negative sign of the mean principal component score (Table 4) of the control group leads to its waveform subtracting from the mean hip angle waveform (Figure 2(b)) for the duration of the gait cycle. In contrast, the positive sign of the mean principal component score of the TKA group leads to its waveform adding to the mean hip angle waveform for the duration of the gait cycle (Figure 2(b)). From the plot of the principal component coefficients scaled to the percentage of variation explained (Figure 2(a)), it was evident that the variability captured by PC1 occurs across the gait cycle. The mean waveforms in Figure 2(b) show a shift in the magnitude of the entire waveform which leads to increased hip flexion and decreased hip extension in the TKA group compared to the control group.
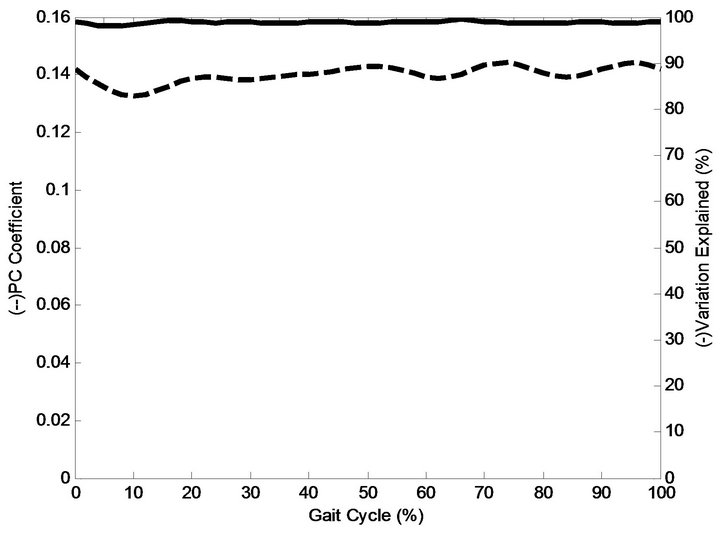
Sagittal pelvic angle PC1 accounted for 98% of the total variation and captured differences in the magnitudes of the waveforms (Figure 3(a)). From the plot of the principal component coefficients scaled to the percentage of variation explained (Figure 3(a)), it was evident that the variability captured by PC1 occurs across the gait cycle with a maximum of 99% of the variation was captured at 76% of the gait cycle. Significant differences in PC1 scores for pelvic angle were observed between the control group and TKA group. The positive sign of the mean principal component score (Table 4) of the TKA group and the positive principal component coefficient (Figure 3(a)) leads to its waveform consistently adding to the mean pelvic angle waveform (Figure 3(b)) throughout the gait cycle. In contrast, the negative sign of the mean principal component score of the control group and the positive principal component coefficient leads to its waveform consistently subtracting from the mean pelvic angle waveform across the gait cycle. The mean waveforms in Figure 3(b) show decreased anterior pelvic tilt for the TKA group for the duration of the gait cycle.
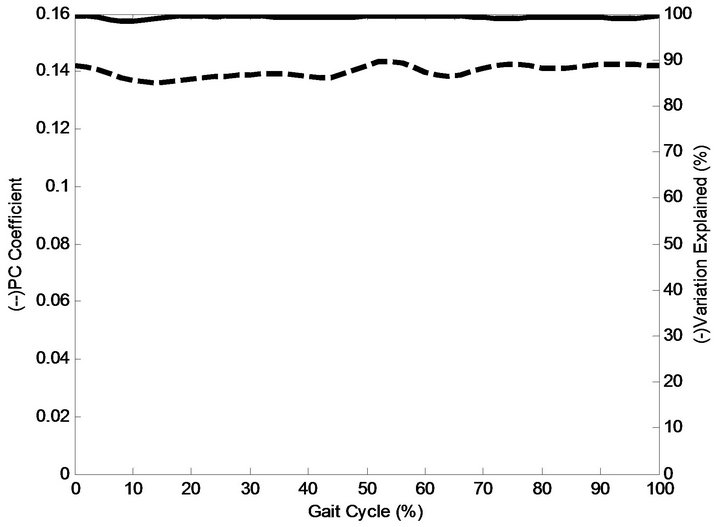
Sagittal trunk angle PC1 accounted for 99% of the total variation (Figure 4(a)). From Figure 4(a), it is evident that a large proportion of variability is explained across the entire gait cycle, ranging from 98% to 99%. Significant differences in PC1 scores for trunk tilt were observed between the control group and the TKA group. The positive sign of the mean principal component score (Figure 4(a)) of the normal group and the positive principal component coefficient leads to its waveform adding to the mean pelvic angle waveform (Figure 4(b)). In contrast, the negative sign of the mean principal component score of the TKA group and the positive principal component coefficients lead to its waveform subtracting from the mean pelvic curve. The mean waveforms in Figure 4(b) show decreased anterior trunk tilt in the TKA group for the duration of the gait cycle.
4. Discussion
Using the parameterization technique, no significant differences in temporal-spatial parameters were found between the TKA and control group. For joint kinematic data, the parameter-based analysis found significantly lower mean peak hip extension angles in stance, increased hip flexion in stance, and significantly higher mean peak anterior pelvic tilt for the TKA group. Significant group differences were found for four of the principal component scores, namely sagittal ankle angle PC2, sagittal hip angle PC1, pelvic tilt PC1, trunk tilt
 (a)
(a)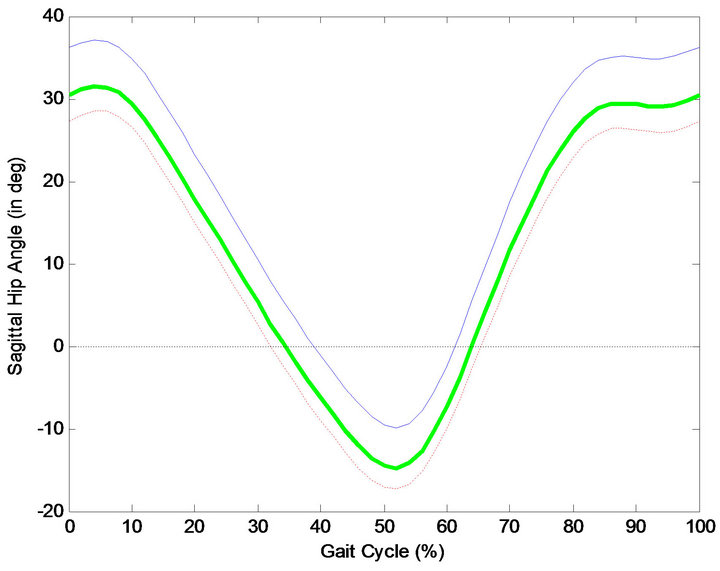 (b)
(b)
Figure 2. (a) Hip flexion PC1 plotted in the original form (dotted), and as a percentage of variation explained (solid); (b) Mean curve of Hip flexion angle (heavy solid green), along with normal group (red), and TKA group (blue).
 (a)
(a)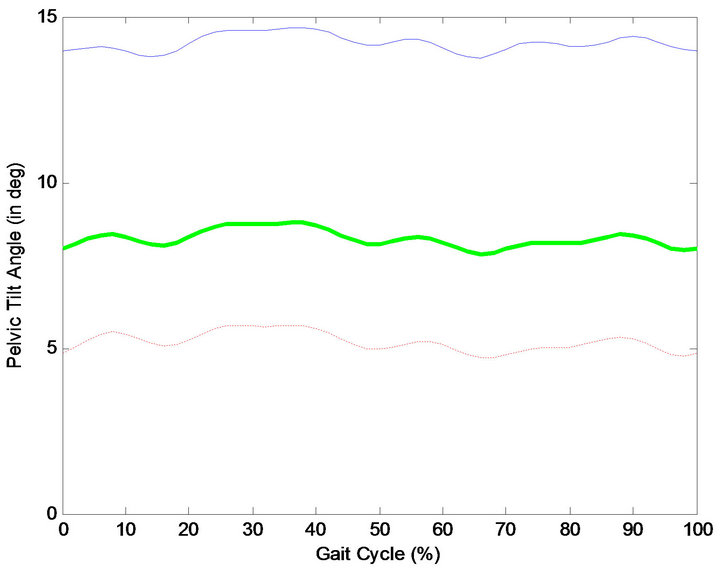 (b)
(b)
Figure 3. (a) Pelvic tilt PC1 plotted in the original form (dotted), and as a percentage of variation explained (solid); (b) Mean curve of pelvic tilt angle (heavy solid green), along with normal group (red), and TKA group (blue).
 (a)
(a)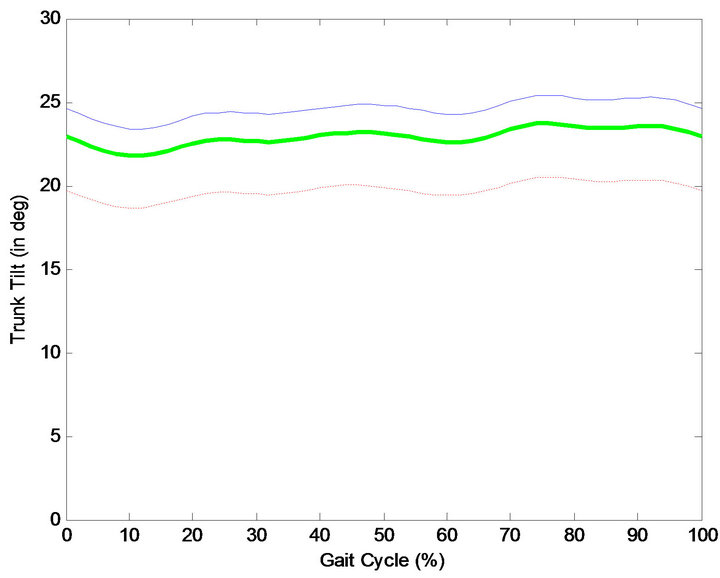 (b)
(b)
Figure 4. (a) Trunk tilt PC1 plotted in the original form (dotted), and as a percentage of variation explained (solid); (b) Mean curve of pelvic tilt angle (heavy solid green), along with normal group (red), and TKA group (blue).
PC1.No significant group differences in temporal-spatial data were found between the control group and TKAgroup, though walking speed was only marginally insignificant.
Parameterization results for the sagittal ankle angles showed no significant differences in maximum dorsiflexion or plantarflexion between the two groups. However, significant group differences in the second principal component scores for the sagittal ankle angle were observed. The TKA group showed reduced dorsiflexion for nearly the first half of the gait cycle. This was followed by reduced plantarflexion prior to and during initial swing, and decreased dorsiflexion during mid to late swing. Astephen et al. (2007) identified similar findings in subjects with severe osteoarthritis in the knee, and reported reduced range of motion at the knee and ankle for patients with severe osteoarthritis. The PCA technique identified differences in the magnitude and timing of the waveforms across the gait cycle. Mean peak dorsiflexion values between groups were similar, and were therefore not detected by parameterization techniques. The results suggest that the tibia is moving forward over the foot at a greater rate in the control group compared to the TKA group. The reduced knee flexion during loading response, though not significant in the TKA group, keeps the tibia back at the beginning of the stance phase. The higher walking speed, in the control group might explain, in part, the increased rate of forward motion of the tibia, despite not being statistically different between groups. As noted earlier, walking speed was only marginally insignificant (P = 0.054). It is also plausible that the reduced knee flexion is an adaptation to reduce pain, which was developed prior to surgery. This may be an attempt to reduce compressive forces at the knee by avoiding activation of the quadriceps. It may also be an indication of weakness at the joint. Adapted motor patterns, as seen here, are commonly retained post-surgery [19].
Parameterization analyses indicated a significantly decreased mean peak hip extension angle in the TKA group compared to the control group. Significantly increased peak hip flexion was also noted using parameterization for the TKA group compared to the control group. As described by the principal component scores and coefficients, significant differences in the first principal component scores were observed between the TKA and control group for the hip. Waveform analysis using principal components showed that the variability in the curve exists throughout the cycle (Figure 2(a)), not solely at peak hip flexion and extension as is typically tested using parameterization techniques. Compared to the control group, the hip flexion/extension waveform is shifted upwards for the TKA group throughout the gait cycle (Figure 2(b)).
Previous work using parameterization analyses have also found decreased hip extension angles in TKA subjects compared to a control group [12,19]. Saari et al. (2005) indicated that abnormal flexion and extension of the knee in TKA subjects might cause reduced hip extension in order to maintain balance during walking. However, our results indicate that reduced hip extension occurs with no significant differences in knee flexion/extension angles between groups. This is not the first study to examine mean peak hip extension and find no significant differences between a TKA group and a control group [20].
In the present study, parameterization analyses indicated significant differences in peak anterior pelvic tilt in the control group (mean ± 1 SD: 6.95˚ ± 6.91˚) and the TKA group (mean ± 1 SD: 15.61˚ ± 8.24˚). Again, waveform analyses indicated that significant variability existed throughout the entire curve (Figure 3(a)). In Figure 3(b), a shift in the entire curve can be seen when comparing the control group and the TKA group. Since hip flexion and extension are calculated relative to the pelvis, it is likely that the increased mean hip flexion and decreased mean hip extension values in the TKA group are a function of increased pelvic tilt. Mean range of motion at the hip showed no significant differences between the control group (48.06˚) and the TKA group (47.06˚). Parameterization analyses indicated no significant differences in anterior trunk tilt between the control group (mean ± 1 SD: 27.69˚ ± 19.95˚) and the TKA group (mean ± 1 SD: 22.74˚ ± 20.26). Waveform analyses indicated that significant variability existed throughout the entire trunk tilt curve (Figure 4(a)), likely as a response to increased anterior pelvic tilt. The pattern of gait seen here indicates a strategy adopted to reduce compressive forces at the knee by limiting quadriceps activation. Since all TKA subjects had severe osteoarthritis prior to surgery, pain in the knee, over time modified gait patterns in an attempt to reduce pain at the knee. This modified gait seems to have been retained by the subjects post surgery.
5. Conclusion
This study indicates that gait patterns of TKA subjects differ significantly from a control group, based on hip flexion and extension, pelvic and trunk tilt, and sagittal ankle angle. Results suggest that waveform analysis was effective at identifying magnitude shifts as sources of variability between groups, which would not necessarily be analyzed using conventional parameterization techniques unless one knew a priori where the variability would exist. TKA subjects were characterized first by reduced hip extension, increased anterior pelvic tilt, increased trunk tilt, reduced hip extension moment, and by reduced dorsiflexion compared to control group. Our results indicate that changes in gait in the TKA group may be due to pain avoidance patterns that were likely developed prior to surgery. Although our subjects reported no pain at the time of testing, altered gait patterns persist, which has been reported by others [21]. Since no preoperative data was collected, this explanation cannot be verified, although there is indication that subjects with severe untreated arthritis at the knee are different than the control subject group [22]. Our results are limited by a small sample size, which may lead to issues identifying the differences in walking speed between the two groups. This study showed that waveform analysis using PCA is a valuable tool for assessing gait waveform in addition to using parameterization. It is also evident that gait patterns of subjects who have received TKA are significantly different compared to a control group.
REFERENCES
- R. D. Scott, “Total Knee Arthroplasty,” Saunders, Philadelphia, 2006.
- K. J. Deluzio, U. P. Wyss, B. Zee, P. A. Costigan and C. Serbie, “Principal Component Models of Knee Kinematics and Kinetics: Normal vs. Pathological Gait Patterns,” Human Movement Science, Vol. 16, No. 2-3, 1997, pp. 201- 217. doi:10.1016/S0167-9457(96)00051-6
- K. J. Deluzio, U. P. Wyss, P. A. Costigan, C. Sorbie and B. Zee, “Gait Assessment in Unicompartmental Knee Arthroplasty Patients: Principal Component Modelling of Gait Waveforms and Clinical Status,” Human Movement Science, Vol. 18, No. 5, 1999, pp. 701-711. doi:10.1016/S0167-9457(99)00030-5
- H. Sadeghi, F. Prince, S. Sadeghi and H. Labelle, “Principal Component Analysis of the Power Developed in the Flexion/Extension Muscles of the Hip in Able-Bodied Gait,” Medical Engineering & Physics, Vol. 22, No. 10, 2000, pp. 703-710. doi:10.1016/S1350-4533(01)00010-8
- H. Sadeghi, P. Allard, F. Barbier, S. Sadeghi, S. Hinse and R. Perrault, “Main Functional Roles of Knee Flexors/Extensors in Able-Bodied Gait Using Principal Component Analysis (I),” The Knee, Vol. 9, No. 1, 2002, pp. 47-53. doi:10.1016/S0968-0160(01)00134-X
- H. Sadeghi, F. Prince, K. F. Zabjek, S. Sadeghi and H. Labelle, “Knee Flexors/Extensors in Gait of Elderly and Young Able-Bodied Men (II),” The Knee, Vol. 9, No. 1, 2002, pp. 55-63. doi:10.1016/S0968-0160(01)00137-5
- T. P. Andriacchi, J. O. Galante and R. W. Fermier, “The Influence of Total Knee-Replacement Design on Walking and Stair Climbing,” Journal of Bone and Joint SurgeryAmerican, Vol. 64, No. 9, 1992, pp. 1328-1335.
- L. D. Dorr, J. L. Ochsner, J. Gronley and J. Perry, “Functional Comparison of Posterior Cruciate-Retained versus Cruciate-Sacrificed Total Knee Arthroplasty,” Clinical Orthopaedics and Related Research, Vol. 236, No. 1, 1988, pp. 36-43.
- Y. Ishii, K. Terajima, Y. Koga, H.E. Takahashi, J. E. Bechtold and R. B. Gustilo, “Gait Analysis after Total Knee Arthroplasty: Comparison of Posterior Cruciate Retention and Substitution,” Journal of Orthopaedic Science, Vol. 3, No. 6, 1998, pp. 310-317. doi:10.1007/s007760050058
- A. Kramers-de Quervain, E. Stussi, R. Muller, T. Drobny, U. Munzinger and N. Gschwend, “Quantitative Gait Analysis after Bilateral Total Knee Arthroplasty with two DifFerent systems within Each Subject,” The Journal of Arthroplasty, Vol. 12, No. 2, 1997, pp. 168-179. doi:10.1016/S0883-5403(97)90063-2
- A. A. Bolanos, W. A. Colizza, P. D. McCann, R. S. Gotlin, M. E. Wootten and B. A. Kahn, “A Comparison of Isokinetic Strength Testing and Gait Analysis in Patients with Posterior Cruciate-Retaining and Substituting Knee Arthroplasties,” The Journal of Arthroplasty, Vol. 13, No. 8, 1998, pp. 906-915. doi:10.1016/S0883-5403(98)90198-X
- T. Saari, R. Tranberg, R. Zugner, J. Uvehammer and J. Karrholm, “Changed Gait Pattern in Patients with Total Knee Arthroplasty But Minimal Influence of Tibial Insert Design,” Acta Orthopaedica, Vol. 76, No. 2, 2005, pp. 253- 260. doi:10.1080/00016470510030661
- A. T. Berman, S. J. Bosacco and C. Israelite, “Evaluation of Total Knee Arthroplasty Using Isokinetic Testing,” Clinical Orthopaedics and Related Research, Vol. 271, 1991, pp. 106-113.
- S. A. Wilson, P. D. McCann, R. S. Gotlin, H. K. Ramakrishnan, M. E. Wootten and J. N. Insall, “Comprehensive Gait Analysis in Posterior-Stabilized Knee Arthroplasty,” The Journal of Arthroplasty, Vol. 11, No. 4, 1996, pp. 359- 367. doi:10.1016/S0883-5403(96)80023-4
- H. Sadeghi, “Local or Global Asymmetry in Gait of People without Impairments,” Gait and Posture, Vol. 17, No. 3, 2003, pp. 197-204. doi:10.1016/S0966-6362(02)00089-9
- R. B. Davis, S. Ounpuu, D. Tyburski and J. R. Gage, “A Gait Analysis Data Collection and Reduction Technique,” Human Movement Science, Vol. 10, No. 5, 1991, pp. 575- 587. doi:10.1016/0167-9457(91)90046-Z
- T. Wrigley, W. J. Albert, K. J. Deluzio, J. M. Stevenson and J. M. “Principal Component Analysis If Lifting Waveforms,” Clinical Biomechanics, Vol. 21, No. 6, 2006, pp. 567-578. doi:10.1016/j.clinbiomech.2006.01.004
- J. E. Jackson, “A User’s Guide to Principal Components,” John Wiley & Sons Ltd., Hoboken, 1991. doi:10.1002/0471725331
- J. M. Winter and S. L-Y. Woo, “Multiple Muscle Systems: Biomechanics and Movement Arganization,” Spinger-Verlag, New York, 1990.
- S. Simon, H. Trieshmann, R. Burdett, F. Ewald and C. Sledge, “Quantitative Gait Analysis after Total Knee Arthroplasty for Monarticular Degenerative Arthritis,” Journal of Bone and Joint Surgery, Vol. 65, No. 5, 1983, pp. 605-613.
- T. P. Andriacchi, “Dynamics of Pathological Motion: Applied to the Anterior Cruciate Deficient Knee,” Journal of Biomechanics, Vol. 23, No. 1, 1990, pp. 99-105. doi:10.1016/0021-9290(90)90044-4
- J. L. Astephen, K. J. Deluzio, G. E. Caldwell, M. J. Dunbar, C. L. Hubley-Kozey, “Gait and neuromuscular pattern changes are associated with differences in knee osteoarthritis severity levels” Journal of Biomechanics, Vol. 41, No, 4, 2007, pp. 868-876.