Open Journal of Radiology
Vol.4 No.1(2014), Article ID:43484,8 pages DOI:10.4236/ojrad.2014.41018
Diffusion-Weighted MR Imaging of the Benign Hepatic Focal Lesions
Adel El-Badrawy1, Germeen Albair Ashmallah1, Ahmed Mohamed Tawfik1, Sherif Abdelfattah1, Manal Salah-Eldin2, Emad Eldin Azmy3, Amro Awad El-Karef4, Ghada A. Salem5, Omar Farouk6
1Radiology Department, Faculty of Medicine, Mansoura University, Mansoura, Egypt
2Medical Oncology Department, Faculty of Medicine, Mansoura University, Mansoura, Egypt
3Clinical Hematology Department, Faculty of Medicine, Mansoura University, Mansoura, Egypt
4Pathology Department, Faculty of Medicine, Mansoura University, Mansoura, Egypt
5Tropical Medicine Department, Faculty of Medicine, Zagazig University, Egypt
6Department of Surgical Oncology, Faculty of Medicine, Mansoura University, Mansoura, Egypt
Email: adelelbadrawy@hotmail.com
Copyright © 2014 by authors and Scientific Research Publishing Inc.
This work is licensed under the Creative Commons Attribution International License (CC BY).
http://creativecommons.org/licenses/by/4.0/


Received 12 December 2013; revised 12 January 2014; accepted 19 January 2014
ABSTRACT
Purpose: To determine the role of diffusion weighted MR imaging and apparent diffusion coefficient (ADC) in benign hepatic focal lesions. Method and Materials: This study included 47 patients (29 M, 18 F with mean age of 43 years) with benign hepatic focal lesions. They were cyst (n = 8), hemangioma (n = 23), abscess (n = 5), adenoma (n = 5), focal nodular hyperplasia (n = 4) and nodular regenerative hyperplasia (n = 2). They underwent routine MR imaging and diffusion MR weighted imaging using 1.5 tesla MR unit (Symphony-Siemens). Diffusion MR imaging was done using spin echo type of single shot echo planar imaging (EPI) with b value of 0, 500 & 1000 sec/mm2. The apparent diffusion coefficient (ADC) map was reconstructed and ADC value was measured. The mean ADC values correlated with histo-pathological results as well as follow-up imaging results. Results: Adequate ADC maps were obtained in 47 patients. The mean ADC values were 3.4 ± 0.12 × 10⁻³ mm2/sec in cystic lesion, 2.23 ± 0.08 × 10⁻³ mm2/sec in hemangioma, 1.94 ± 0.05 × 10⁻³ mm2/sec in abscess, 1.72 ± 0.07 × 10⁻³ in focal nodular hyperplasia, 1.65 ± 0.06 × 10⁻³ mm2/sec in adenoma, 1.62 ± 0.07 × 10⁻³ mm2/sec in nodular regenerative hyperplasia. The mean ADC values were significantly different within benign hepatic focal lesions (P < 0.001). The differences between the mean ADC values of FNH, adenoma and NRH were not statistically significant (P < 0.23). Conclusion: Diffusion weighted MR imaging is a new imaging modality for diagnosis and characterization of different benign hepatic focal lesions, particularly in patient with renal dysfunction.
Keywords:Diffusion; MR Imaging; Apparent Diffusion Coefficient; Benign Hepatic Focal Lesion

1. Introduction
Diffusion-weighted (DW) MR imaging can now be applied to liver imaging with improved image quality. DW MR imaging enables qualitative and quantitative assessment of tissue diffusivity (apparent diffusion coefficient) without the use of gadolinium chelates, particularly in patients with severe renal dysfunction at risk for nephrogenic systemic fibrosis [1] . DWI yields qualitative and quantitative information that reflects changes at a cellular level and provides unique insights about tumor cellularity and the integrity of cell membranes. Recent advances enable the technique to be widely applied for tumor evaluation in the abdomen and pelvis and have led to the development of whole-body DWI [2] . DWI is a simple and sensitive method for screening focal hepatic lesions and is useful for differential diagnosis [2] -[4] . The purpose of this study was to determine the role of diffusion weighted MR imaging and apparent diffusion coefficient (ADC) in benign hepatic focal lesions.
2. Materials and Methods
2.1. Patients
Our study received institutional review board approval, and all patients provided informed consent. This is retrospective study of confirmed benign hepatic focal lesions. This study included 47 patients (29 M, 18 F with mean age of 43 years) with benign hepatic focal lesions. Patients with diffuse liver disease like cirrhosis or steatosis were excluded. Thirty-two patients underwent triphasic CT scanning using 64 MDCT scanner (Brilliance 64, Philips). Pathological confirmation was on the basis of tru-cut biopsy (n = 10), fine needle aspiration cytology (n = 11), characteristic triphasic CT and dynamic MRI findings (n = 26). Follow up was done of more than 1 year. The methods of examination were fully explained to patient before imaging to obtain his consent. They were instructed to remove ferromagnetic materials.
2.2. MRI Techniques
All patients underwent MR examinations using a 1.5 tesla superconducting unit (Symphony; Siemens AG Medical systems, Forchheim, Germany) using body phased-array coil. The machine was equipped with a self-shielding gradient set (23 mT/m maximum gradient strength and 120 mT/m/s slew rate). All patients were examined in the supine position throughout the examination.
• All patients underwent diffusion MRI in addition to routine MR protocol. It included true FISP axial and coronal imaging (4.3/2.1 TR/TE, 80˚ flip angle, 4mm slice thickness, 350 × 350 FOV, 220 × 256 matrix size and 0.9 mm inter-slice gap), in phase (160/2.4 TR/TE, 78˚ flip angle, 4 mm slice thickness, 350 × 350 FOV, 256 × 256 matrix size and 0.9 mm inter-slice gap), and out phase (160/4.8 TR/TE, 78˚ flip angle, 4 mm slice thickness, 350 × 350 FOV, 256 × 256 matrix size and 0.9 mm inter-slice gap), axial FLASH (128/ 4.8 TR/TE, 70˚ flip angle, 4 mm slice thickness, 350 × 350 FOV, 256 × 256 matrix size and 0.9 mm inter-slice gap), heavy T2 10000/260 TR/TE, 150˚ flip angle, 4 mm slice thickness, 350 × 350 FOV, 256 × 256 matrix size and 0.9 mm inter-slice gap). A multiphase (arterial, portal and delayed phases), dynamic gadolinium-enhanced examination was performed for 37 patients. After injection of 20 mL of gadopentetate dimeglumine (Magnevist; Bayer HealthCare Pharmaceuticals, Wayne, NJ, USA) at a rate of 2 mL/sec. Sequential axial spoiled gradient echo MR images were obtained through the lesion at 25, 60 and 120 - 200 seconds after start of injection. The following parameters were used (3.3/1.4 TR/TE, 15˚ flip angle, 3 mm slice thickness, 350 × 350 FOV, 220 × 256 matrix size and no inter-slice gap). Then a 20 mL saline flush was delivered into the antecubital vein.
2.2.1. Diffusion-Weighted Imaging
It was performed for all patients before injection of contrast material. Diffusion-weighted images were obtained using a single shot echo planar imaging sequence EPI (5200/139 ms TR/TE, 5 mm slice thickness, 1 mm slice interval, 350 × 350 mm FOV, 256 × 512 matrix) with diffusion sensitivities of b values = 0, 500, 1000 sec/mm2. The diffusion gradient was applied sequentially in the three orthogonal directions. ADC map were reconstructed. Scan time was <2 min.
2.2.2. Image Analysis
• Qualitative Assessment of DWI and ADC Map All DW MR Images were analyzed. DW MR images were analyzed qualitatively by focusing on the signal intensity of the hepatic focal lesions, which was classified by using visual assessment of hypointensity, hyperintensity or mixed signal in comparison with the signal intensity of adjacent normal hepatic parenchyma. The abnormal regions on DWI and ADC map were outlined by using the conventional images as a guide. Signal intensity of ADC map assessed visually.
• Quantitative Assessment of ADC The ADC map was automatically calculated by commercially available software (Leonardo, version 2.0; Siemens AG Medical systems, Forchheim, Germany).
Measurement of ADC was made using an electronic cursor on the ADC map in different regions of interest (ROI) of the lesions. The region of interest with a diameter of approximately 1.0 cm was positioned for the measurement of ADC in each mass avoiding necrotic or hemorrhagic components. Scar of FNH was avoided during placing ROI. The ADC values were expressed in 10−3 mm2/sec. ROI for each lesion was placed not less than three times. Then the mean ADC value for the lesions was calculated.
2.3. Statistical Analysis
The statistical analysis of data was done using SPSS program [statistical package for social science version 10]. The mean ± SD was used for data description. One way ANOVA test was used when compared more than two groups, independent sample t-test when compare two groups. A P value is considered significant if <0.05 at confidence interval 95%.
3. Results
The final diagnoses of benign hepatic focal lesions were: cyst/cysts (n = 8), hemangioma (n = 23), abscess (n = 5), adenoma (n = 5), focal nodular hyperplasia (n = 4) and nodular regenerative hyperplasia (n = 2). The mean ADC values were 3.4 ± 0.12 × 10⁻³ mm2/sec in cystic lesion (figure 1), 2.23 ± 0.08 × 10⁻³ mm2/sec in hemangioma (figure 2), 1.94 ± 0.05 × 10⁻³ mm2/sec in abscess, 1.72 ± 0.07 × 10⁻³ in focal nodular hyperplasia, 1.65 ± 0.06 × 10⁻³ mm2/sec in adenoma, 1.62 ± 0.07 × 10⁻³ mm2/sec in nodular regenerative hyperplasia (figure 3) (tables 1 and 2). The mean ADC values were significantly different within benign hepatic focal lesions (P < 0.001). The difference between the mean ADC values of FNH, adenoma and NRH were not statistically significant (P < 0.23) (table 3).
4. Discussion
DWI technique yields qualitative and quantitative information that reflects changes at a cellular level and provides unique insights about tumor cellularity and the integrity of cell membranes [2] [5] [6] . DWI is an evolving technology with the potential to improve tissue characterization when findings are interpreted in conjunction with findings obtained with other conventional MR imaging sequences [7] . DWI is increasingly used for the evaluation of extracranial diseases. There is growing interest in the application of DWI for the evaluation of the patient with cancer [1] .
The ADC value is estimated to be lower in viable tumor tissue with densely packed diffusion-hindering obstacles than in tissue with less densely packed obstacles, such as tumor necrosis and benign tissue [8] . This coincides with our results that showed high ADC value of benign hepatic lesions.
DWI in the liver is a relative new and increasingly used imaging technique in addition to conventional unenhanced and contrast enhanced MRI [9] . Most prior studies [10] -[15] have used DW imaging for focal liver lesion characterization by enabling measurement of lesion apparent diffusion coefficient (ADC).
Sun et al., (2005) measured ADC in four sets (0, 100, 500, 1000) and stated that ADC values had higher stabilization with higher b value [16] . In the current study we measured ADC from high b value (b1000) to avoid false measurements related to T2 shine through effect or perfusion.
 (a)
(a)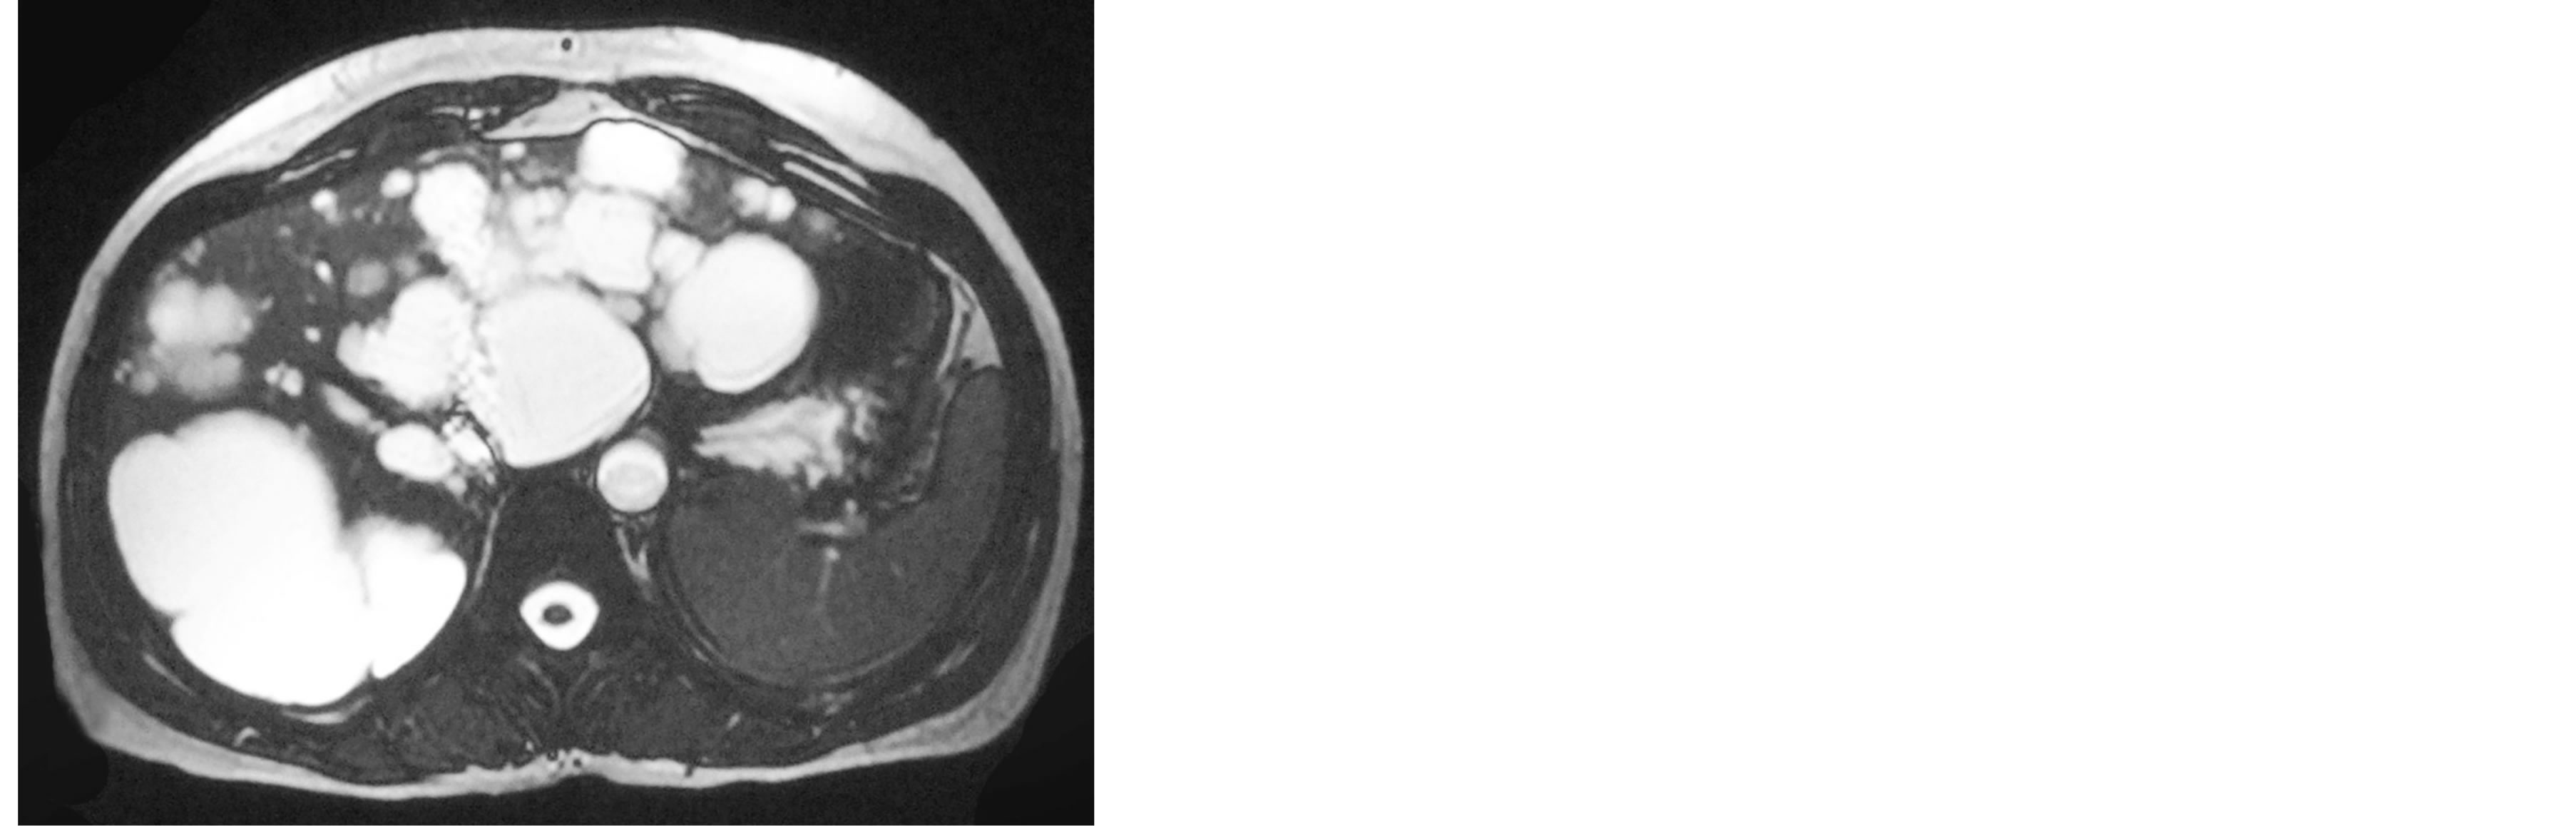 (b)
(b)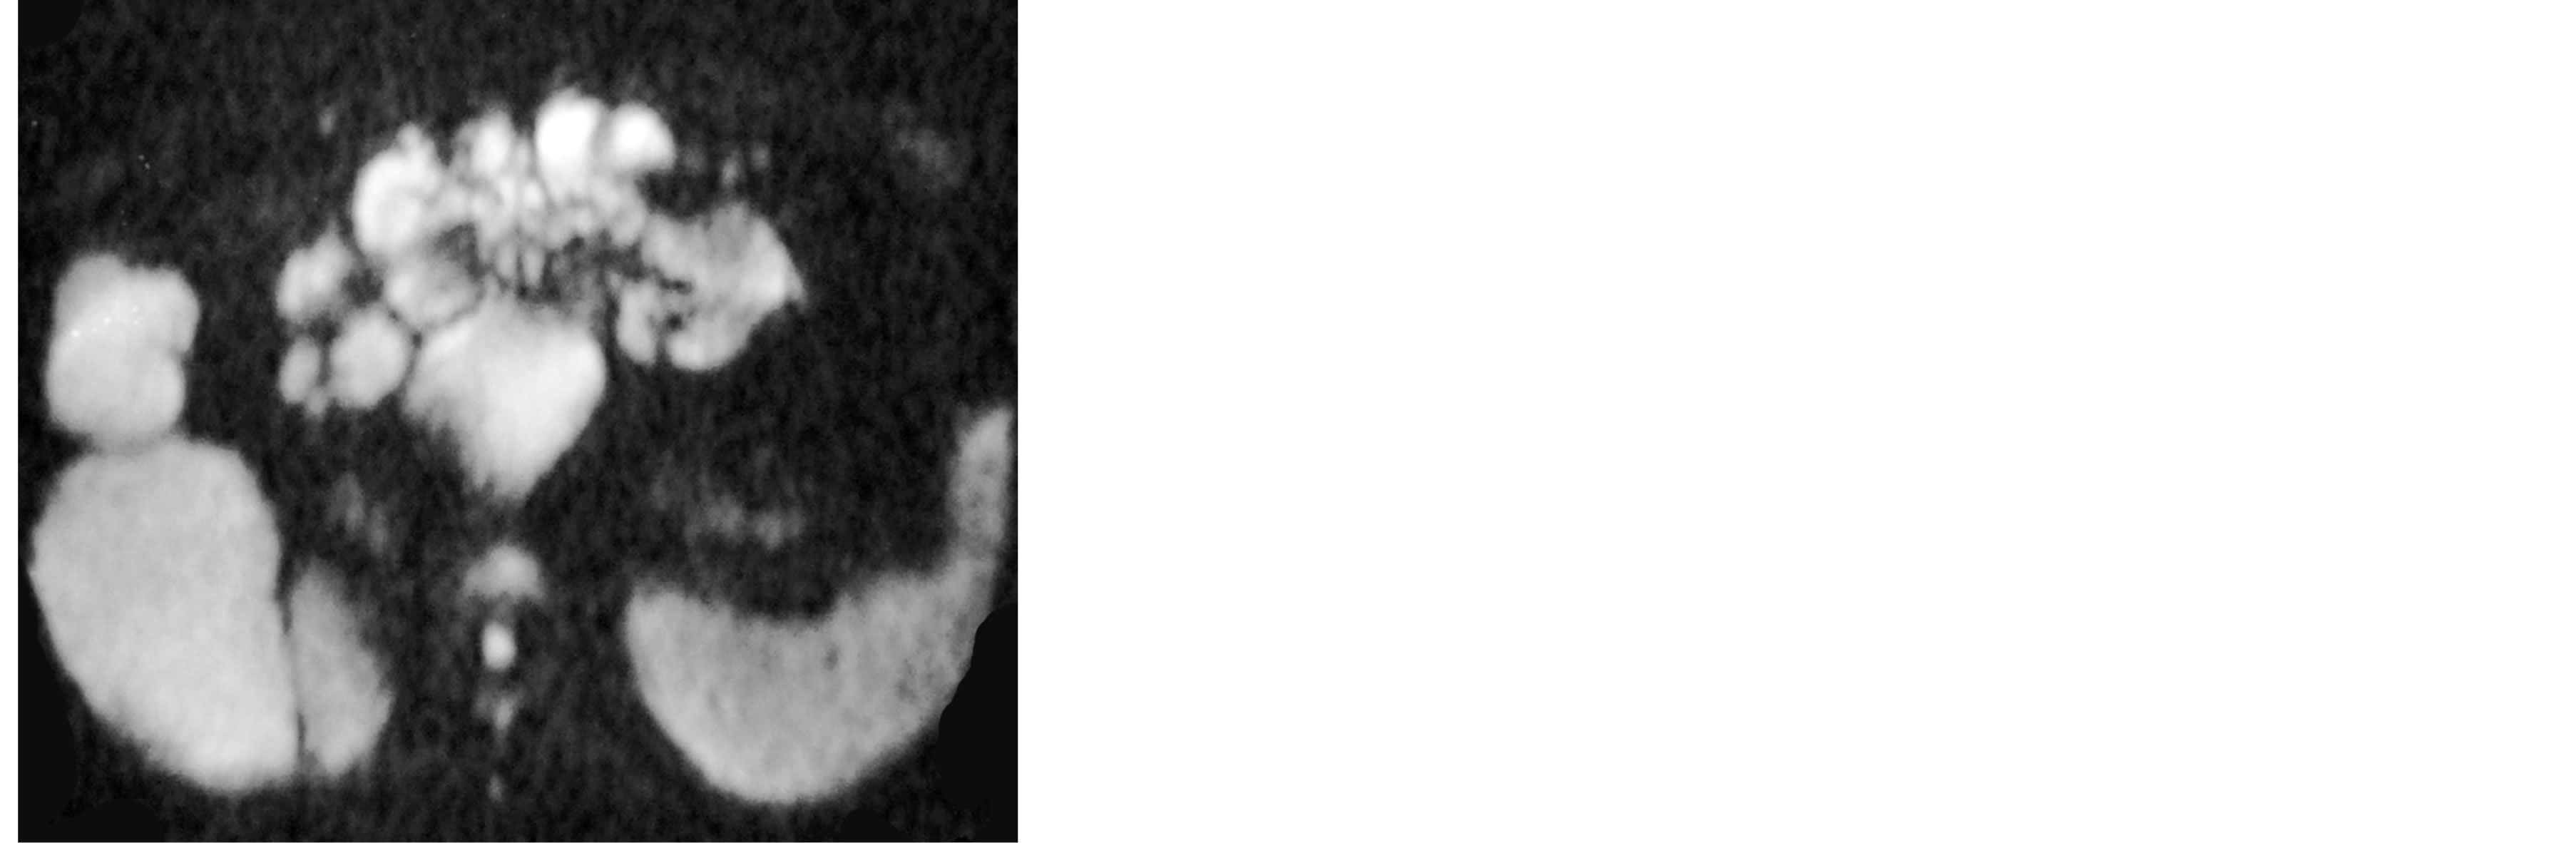 (c)
(c)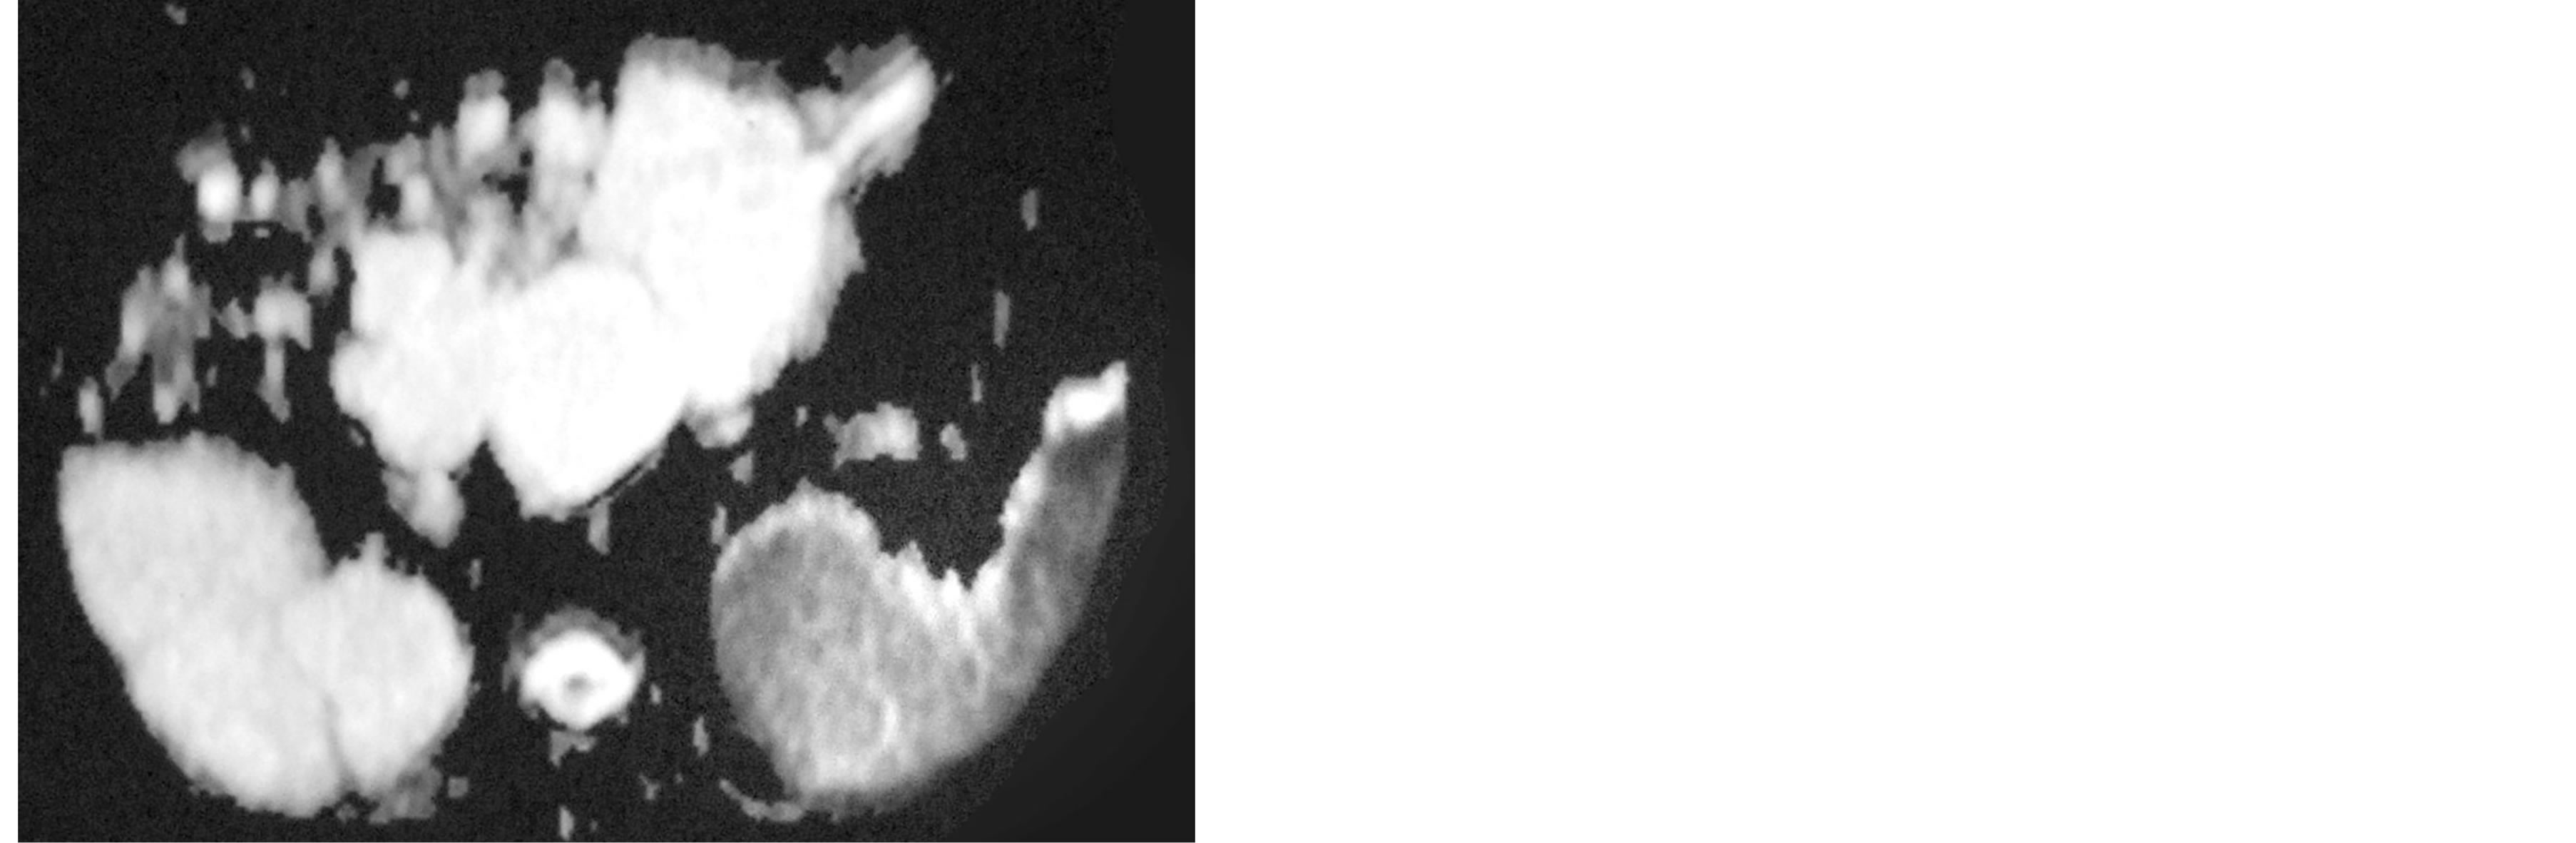 (d)
(d)
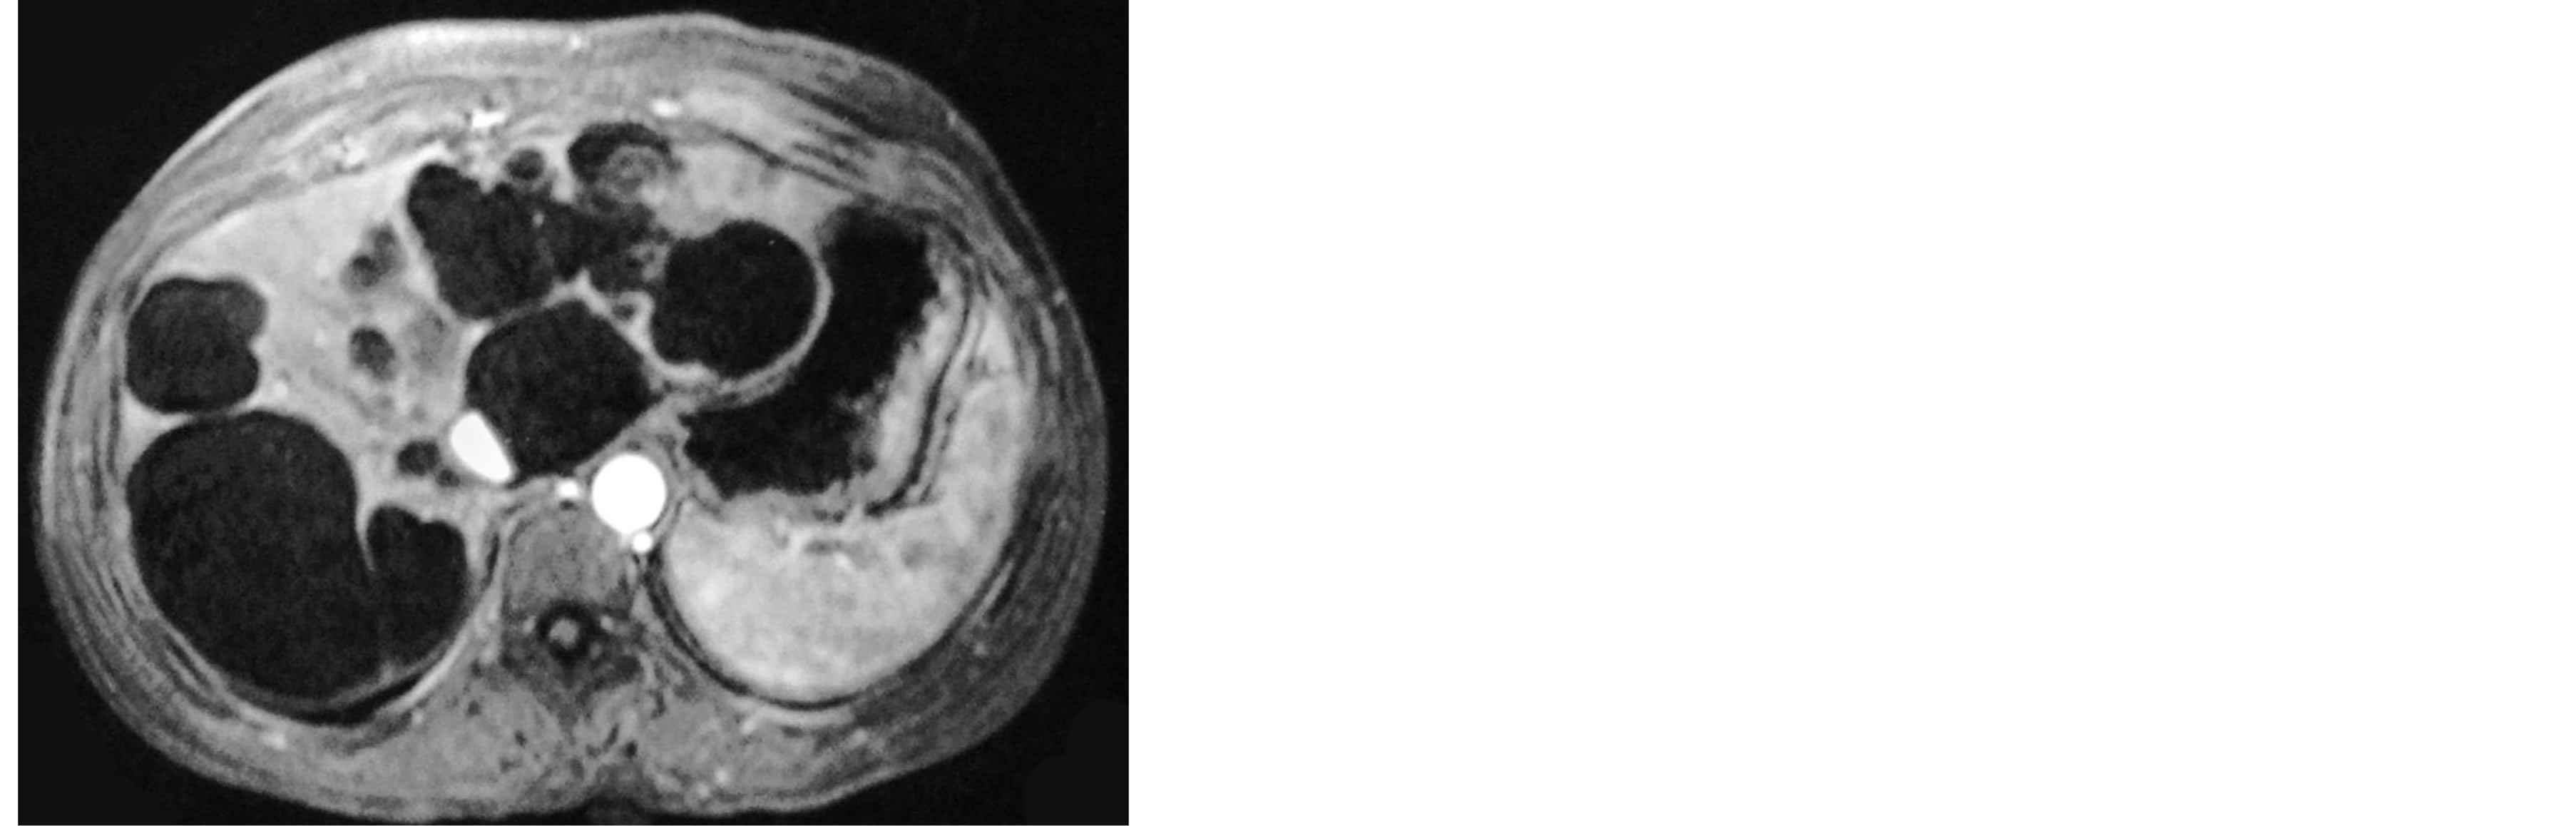
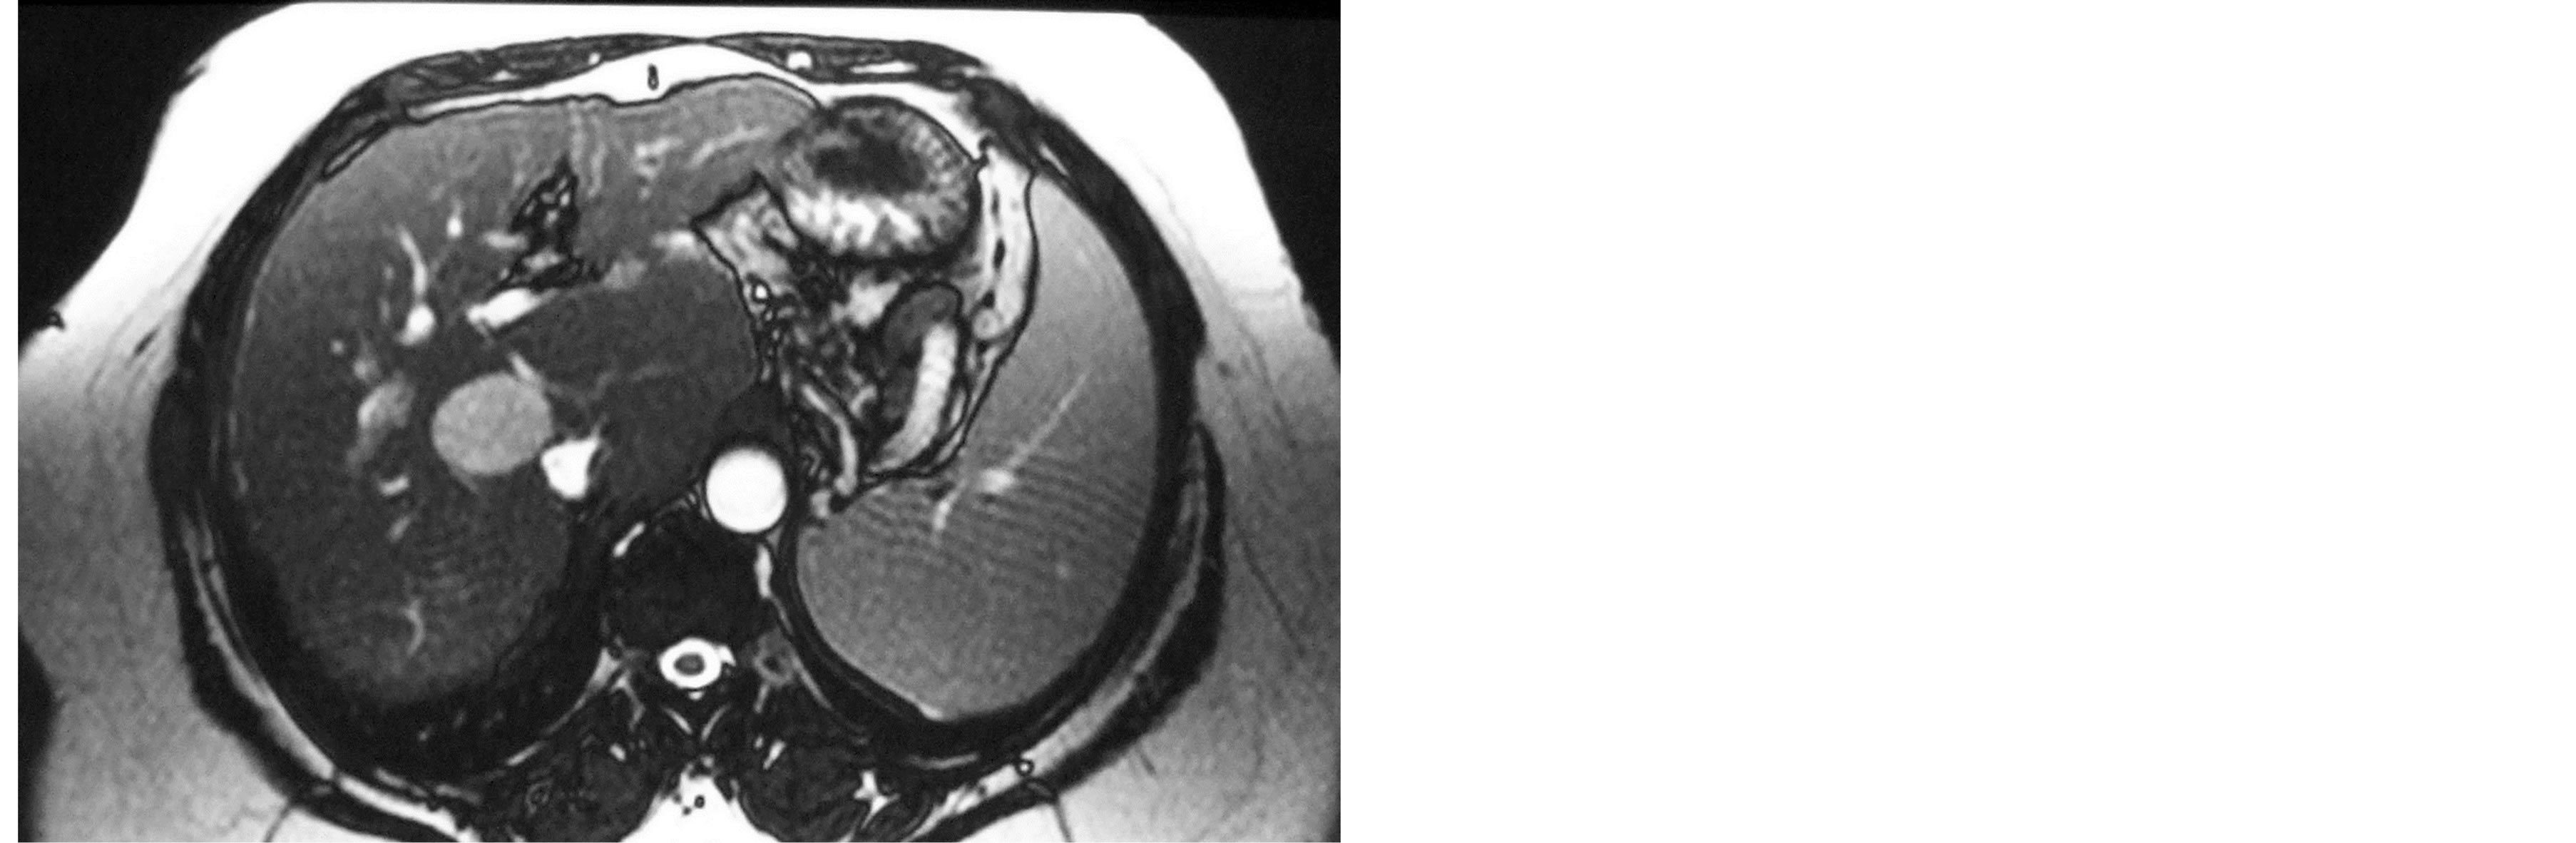
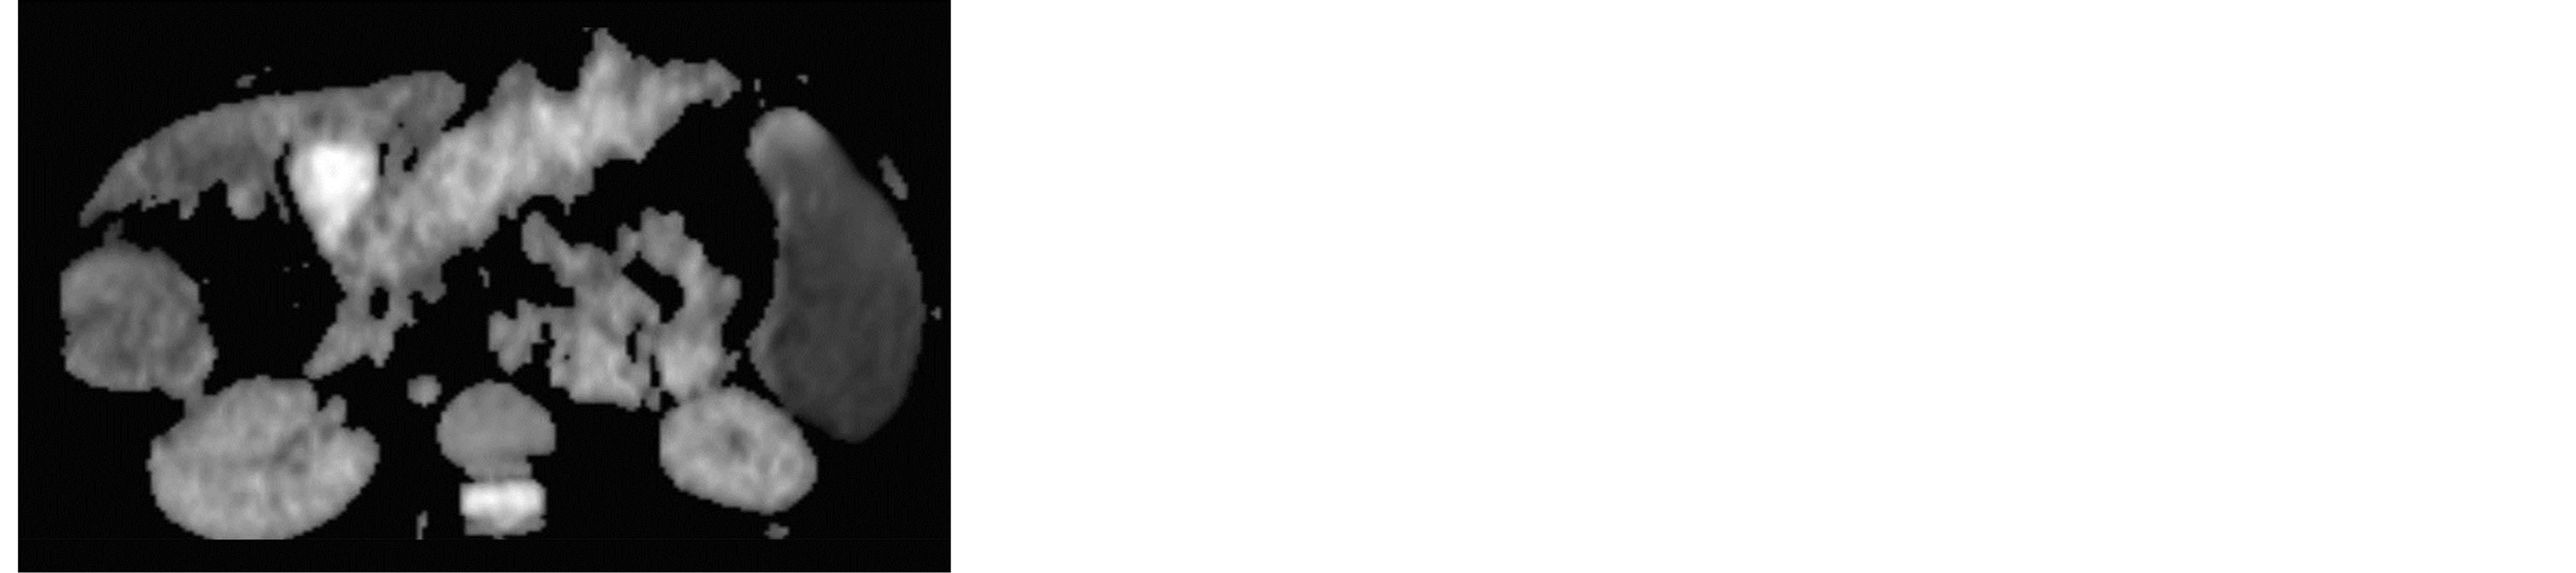
Figure 1. 40-year-old women presented with multiple hepatic cysts. (a) Post-contrast T1 WI and (b) T2 FISP show multiple non-enhanced cysts. (c) Cysts show high signal on DWI (b vale = 0 s/mm2). (d) ADC map shows high signal with ADC value is 3.4 ± 0.12 × 10⁻³ mm2/sec.

Table 1. Mean ADC value of 47 benign hepatic lesions.
FNH: Focal nodular hyperplasia; NRH: Nodular regenerative hyperplasia.
Table 2. Mean ADC value of benign hepatic lesions in this study and those previous reports.
N.: Number of patients; FNH: Focal nodular hyperplasia; NRH: Nodular regenerative hyperplasia; N.A.: Not applicable.
Table 3. Statistical results.
 (a)
(a)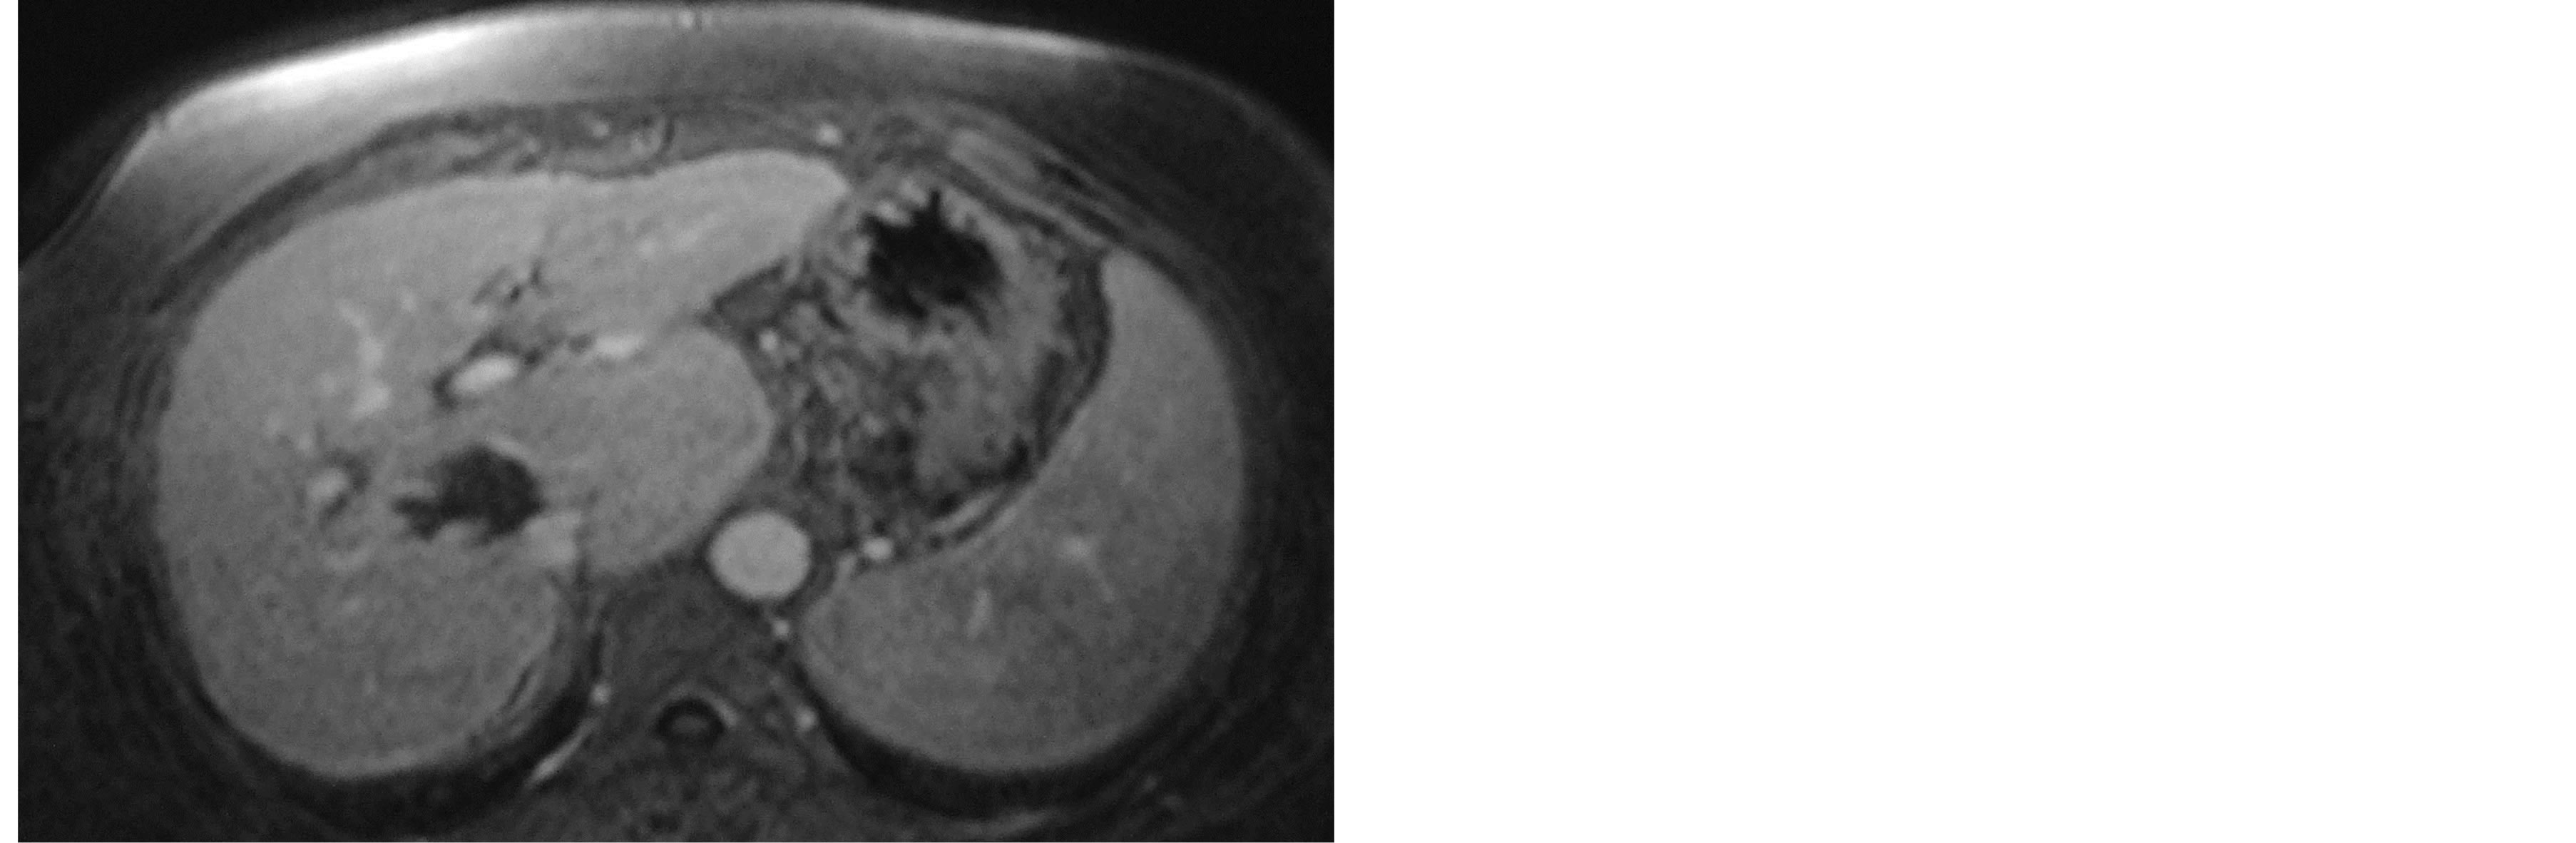 (b)
(b)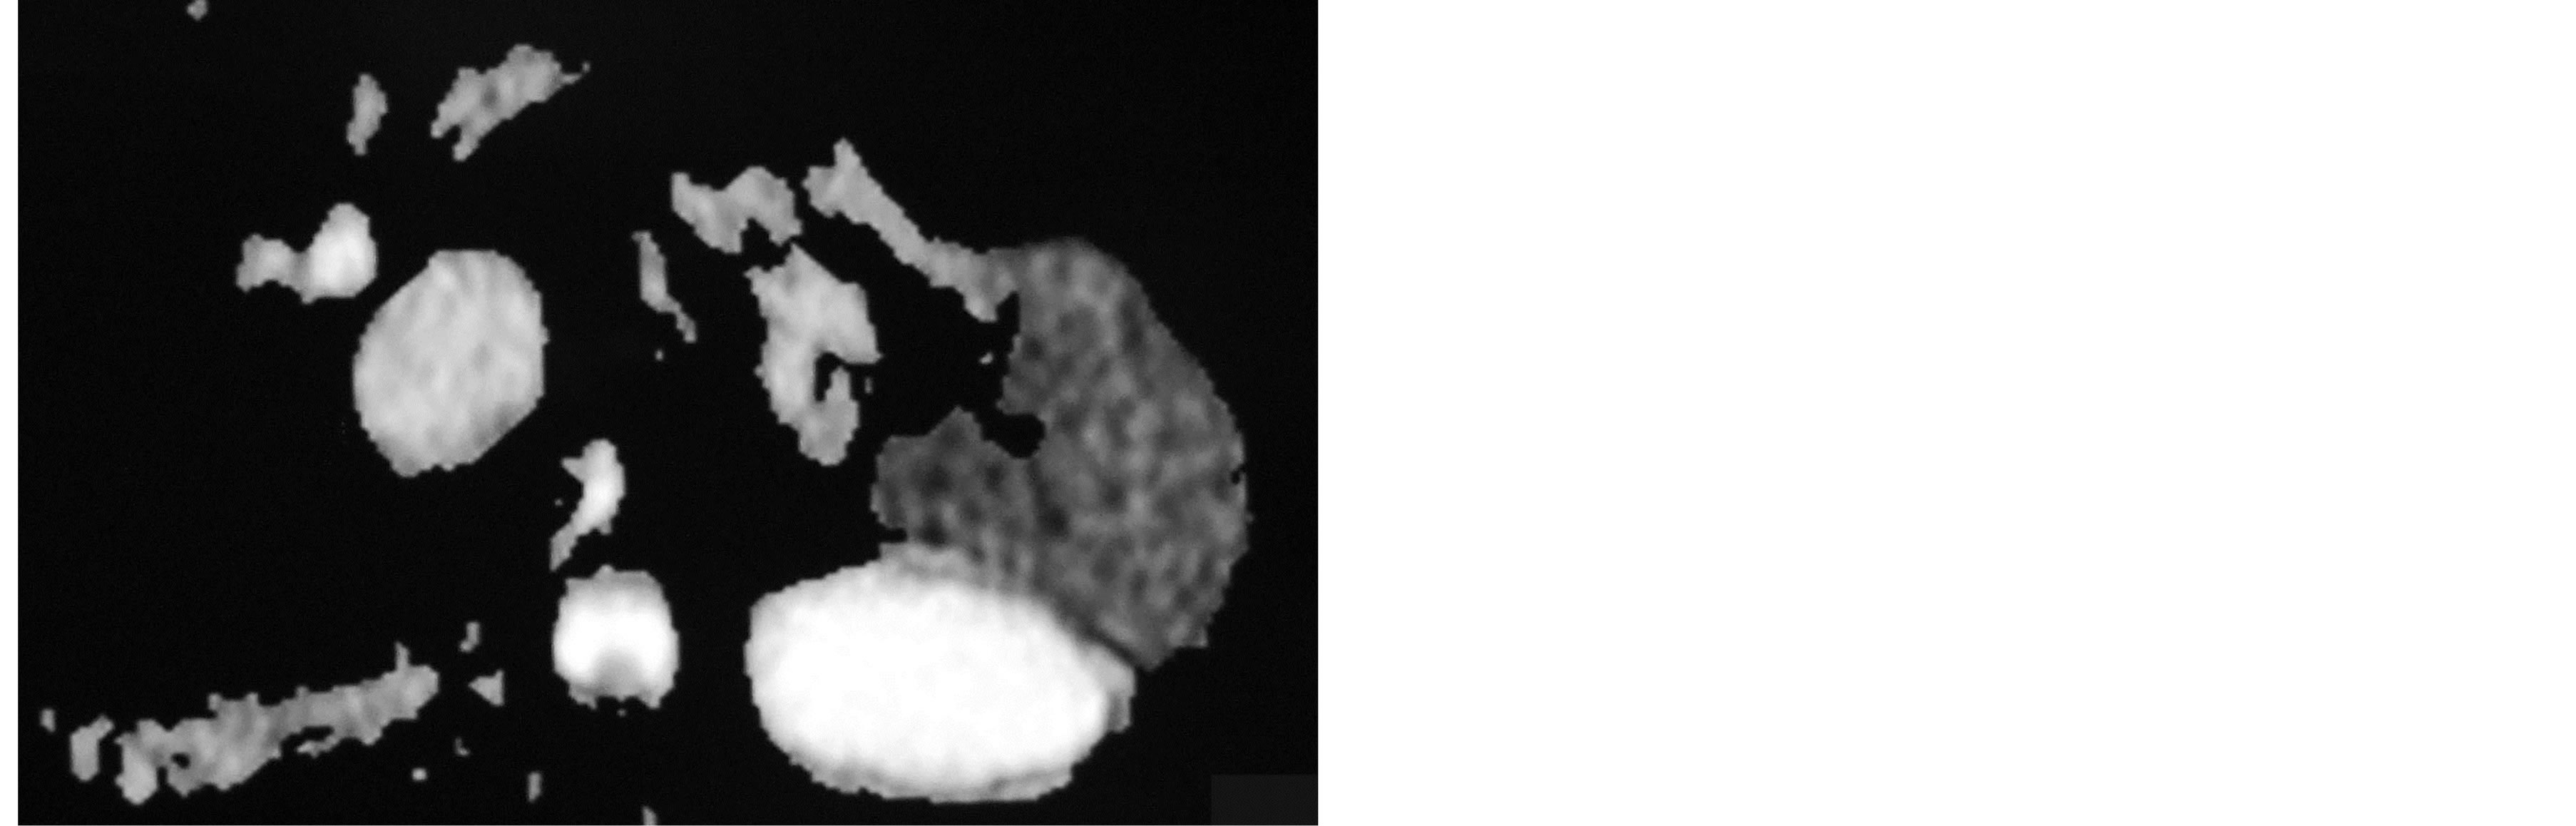 (c)
(c)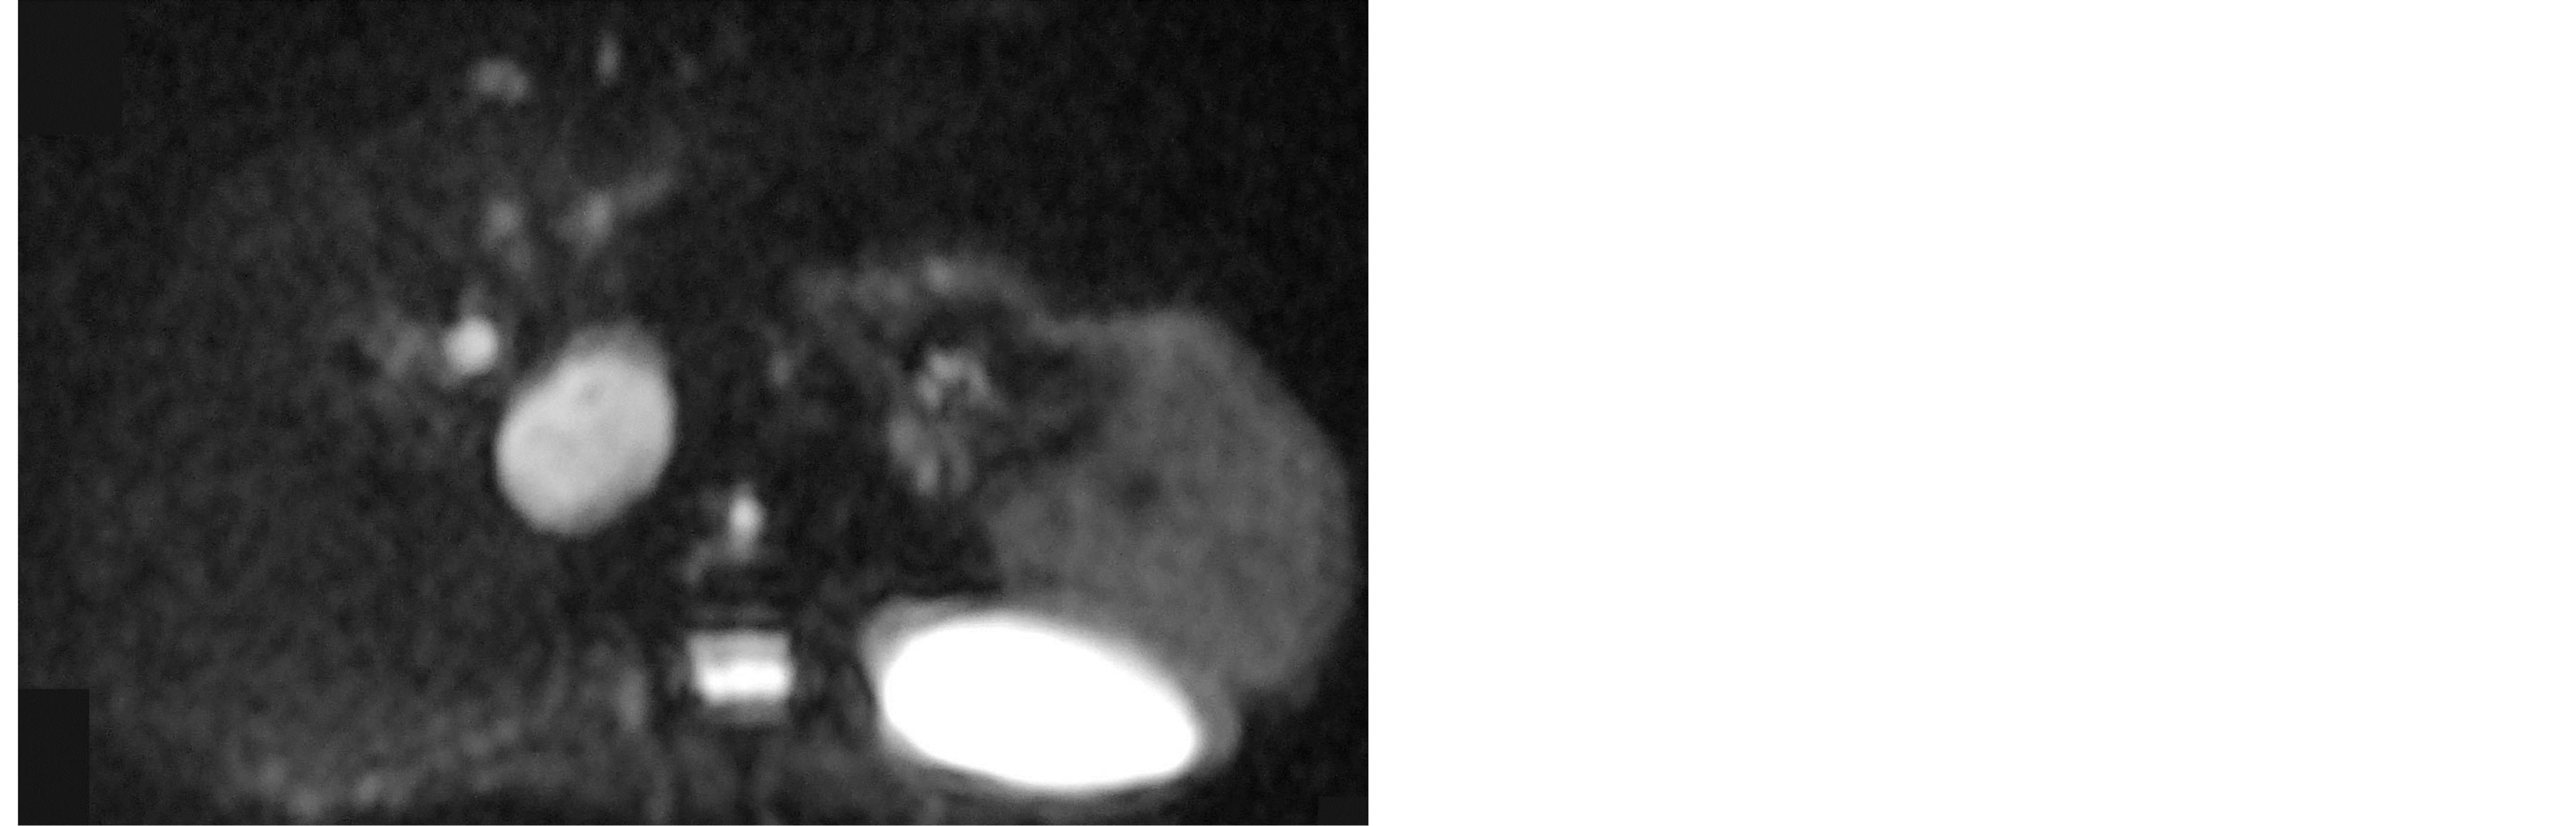 (d)
(d)
Figure 2. 55-year-old man presented with hepatic focal lesion imaging characteristic of haemangioma. (a) Post-contrast T1 WI shows peripheral nodular enhancement. (b) T2 FISP shows high signal. (c) The lesion shows high signal on DWI (b value = 500 s/mm2). (d) ADC map shows high signal with ADC value is 2.23 ± 0.08 × 10⁻³ mm2/sec.
 (a)
(a)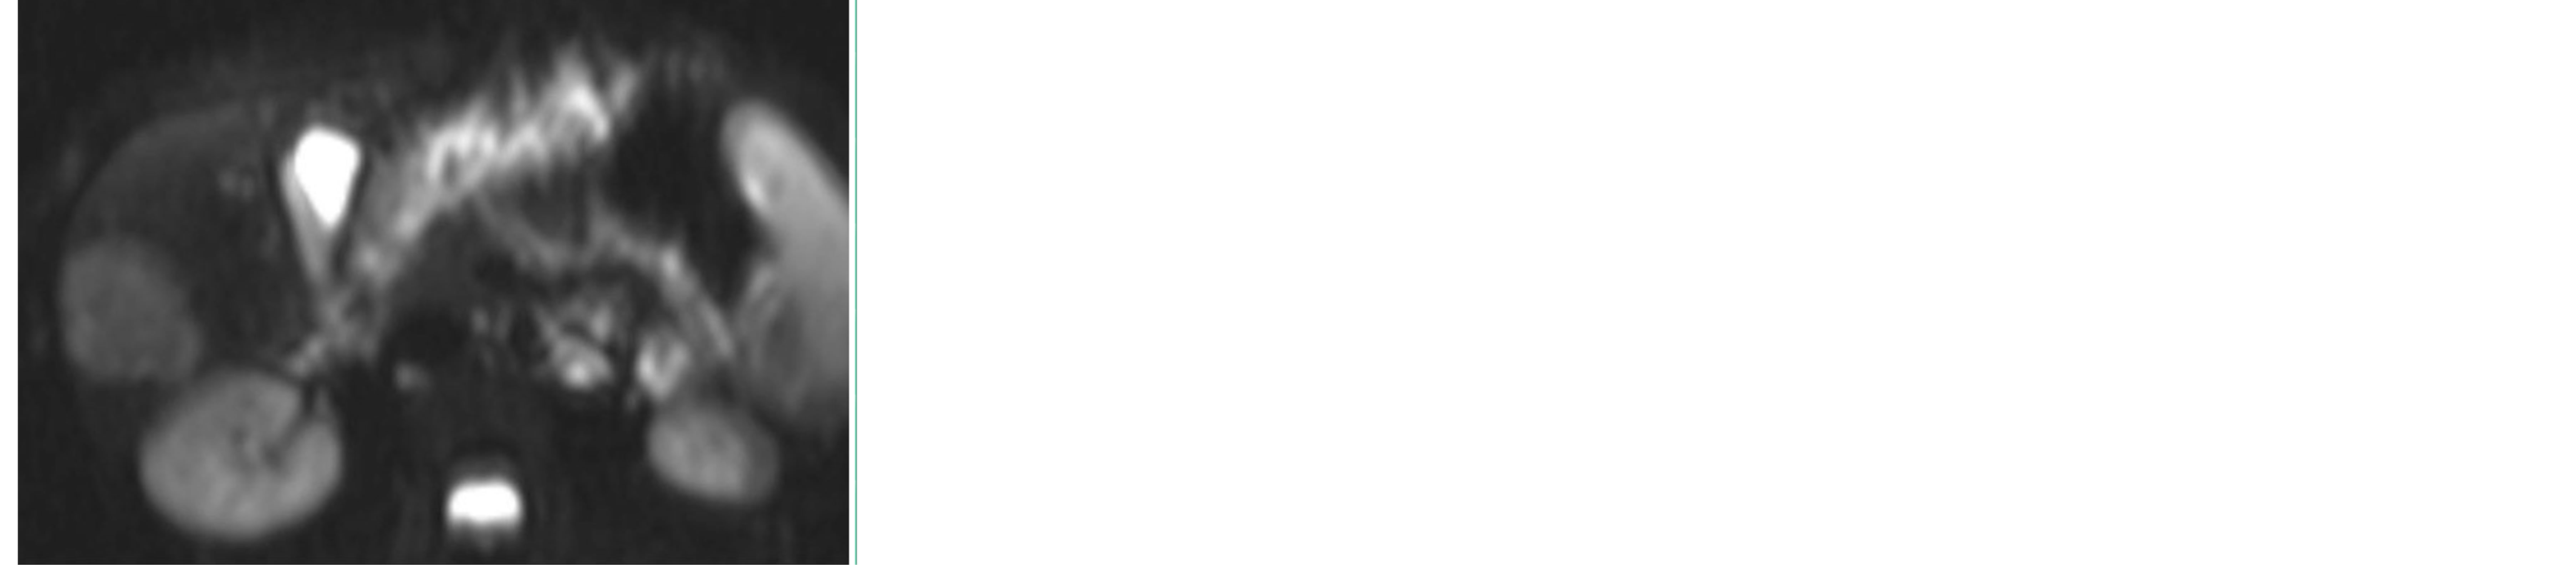 (b)
(b)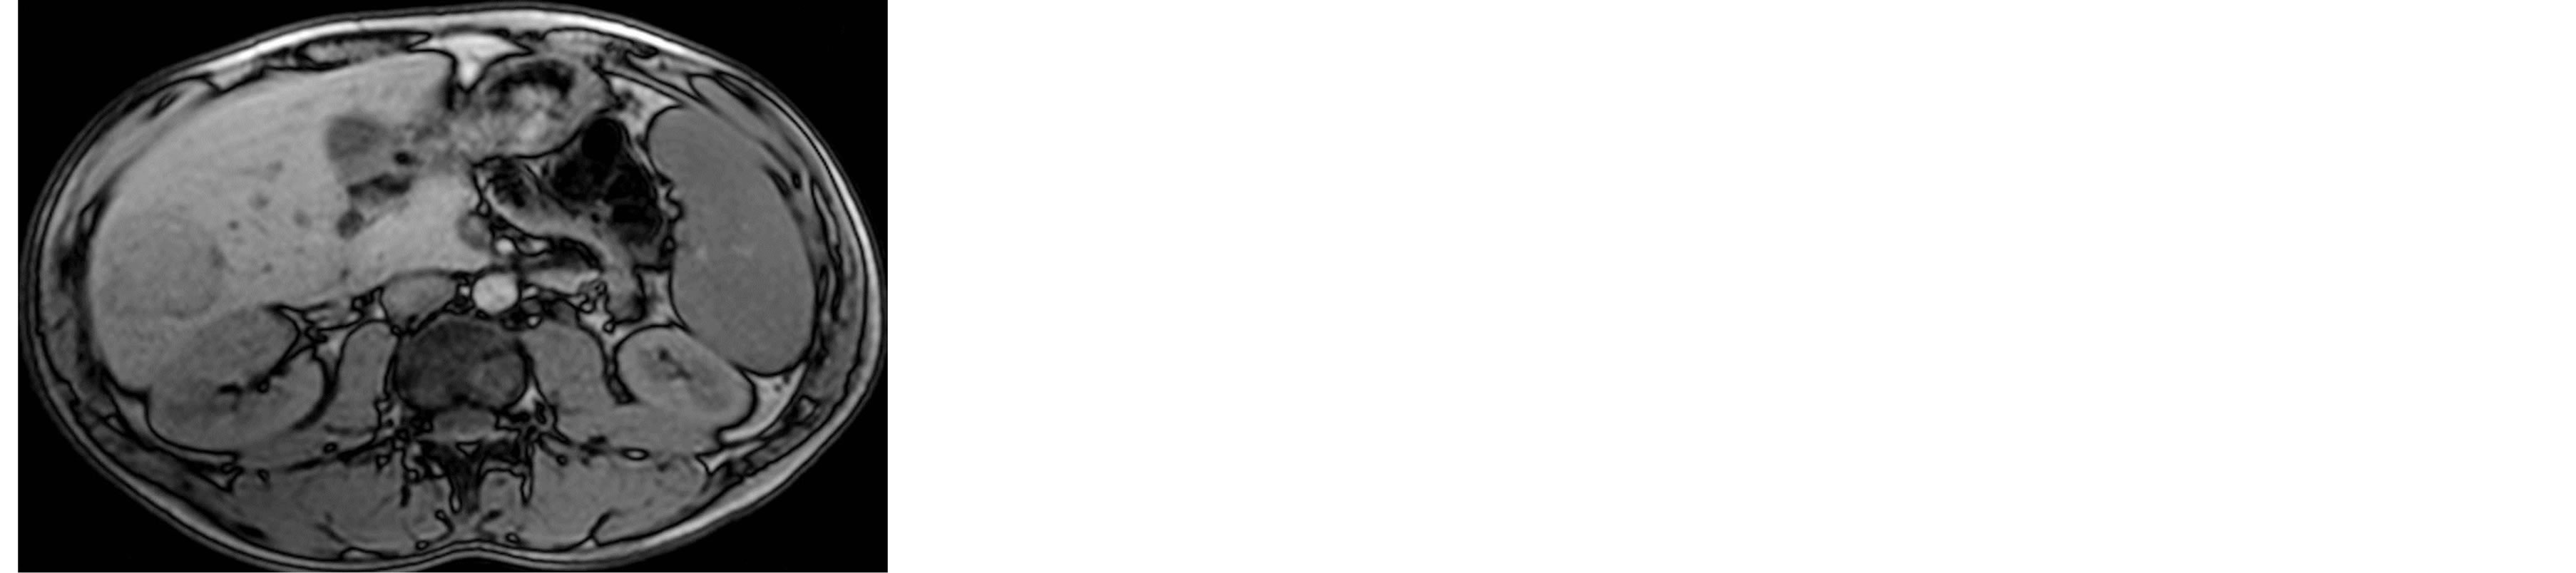 (c)
(c)
Figure 3. 24-year-old man presented with pathologically proved NRH. (a) Non-contrast T1WI shows low signal focal lesion. (b) The lesion shows high signal on DWI (b value = 0 s/mm2). (c) ADC map shows intermediate signal with ADC value is 1.62 + 0.07 × 10⁻³ mm2/sec.
ADC value of haemangioma in our study was 2.23 ± 0.08 × 10⁻³ mm2/sec in hemangioma. This coincides with previous results [4] [14] [17] -[21] . But, it does not correlate with other studies [22] -[24] . The difference may be due to using different b value, different technique either breath-hold or respiratory triggered, or different pathological types of haemangiomas.
Our results shows cyst has the highest ADC value. This is in agreement with previous studies [4] [19] -[22] . There is difference in ADC value of cyst from other study [3] [18] [19] [23] . This variability in ADC values is probably due to imaging parameters, b value combination or different technique either breath-hold or respiratory triggered.
Mean ADC value of cyst was significantly higher than haemangioma. Mean ADC values of cyst and haemangioma were significantly higher than other benign hepatic focal lesions. This coincides with other studies [18] [20] [24] .
Restricted diffusion within abscess cavities is assumed to be due to the presence of viscous fluid containing bacteria, inflammatory cells, mucoid proteins, and cellular debris [25] . An inverse correlation between ADC and cell density has been described in animal models [26] . During the process of abscess maturation, the central parts liquefy, and T2 shine-through gradually replaces the true restriction of diffusion with increasing signal intensity on low-b-value DW images and an increasing ADC [27] . Our results are in agreement with Miller et al., (2010) [12] . The difference between our results and other studies [18] [19] may be attributing to stage of abscess, type of abscess or under therapy.
On DW MR Images, FNHs and HCAs often show findings that suggest restricted diffusion. The mean ADC value of FNHs was significantly higher than that of HCAs (P < 0.001) [28] . Adenoma, FNH and NRH are high cellularity. So, they exhibit low ADC value in relation to other benign hepatic focal lesions. Our results are coincide with previous studies [18] [29] . But, variability in ADC values is probably due to tumor type, imaging parameters, b value combination, and region of interest placement (whether or not the solid part was included).
Our study results strongly suggest that there is an inverse relationship between lesion cellularity and ADC. Lesions with high cellularity as adenoma, FNH and NRH have low ADC values. Lesions with low cellularity as cyst and haemangiomas have high ADC values. This in agreement with previous study [29] .
The advantage of DWI is that it is completely noninvasive, does not require exposure to ionizing radiation or administration of exogenous contrast medium and does not cause patient discomfort. In this study, we found that the P value within benign hepatic focal lesion was <0.001. The differences in ADC values might reflect differences in histopathologic features: adenoma, FNH and NRH had high cellularity, so its ADC values tended to be lower in our study. Therefore, it is feasible to use DWI to distinguish cyst, haemangioma and abscess from adenoma, FNH and NRH and this technique would be of great benefit to radiologist for differential diagnosis of benign hepatic focal lesions.
Our study has several technical limitations. The main limitation was that the echo-planar sequence used with a higher b value had a lower SNR, resulting in greater image distortion. Second, avoiding susceptibility artifacts on DWI is rather difficult. Although we use phase array coil with cardiac gating and respiratory compensation techniques to improve image quality and speed, artifacts associated with echo-planar imaging sequences and macroscopic movement still existed which resulted in image distortion. Fortunately, these artifacts were not very severe and the images could fulfill the requirements needed to make the diagnosis. Lastly, FNH, adenoma and NRH were small in number.
5. Conclusion
Diffusion weighted MR imaging is a new imaging modality for diagnosis and characterization of different benign hepatic focal lesions, particularly in patient with renal dysfunction. Further studies are recommended to differentiate between FNH, adenoma and NRH using diffusion-weighted MRI.
Conflict of Interest
No financial disclosure.
References
- Koh, D.M. and Collins, D.J. (2007) Diffusion-Weighted MRI in the Body: Applications and Challenges in Oncology. American Journal of Roentgenology, 188, 1622-1635. http://dx.doi.org/10.2214/AJR.06.1403
- Taouli, B. and Koh, D.M. (2010) Diffusion-Weighted MR Imaging of the Liver. Radiology, 254, 47-66. http://dx.doi.org/10.1148/radiol.09090021
- Koike, N., Cho, A., Nasu, K., Seto, K., Nagaya, S., Ohshima, Y. and Ohkohchi, N. (2009) Role of Diffusion-Weighted Magnetic Resonance Imaging in the Differential Diagnosis of Focal Hepatic Lesions. World Journal of Gastroenterology, 15, 5805-5812. http://dx.doi.org/10.3748/wjg.15.5805
- Maksimović, R.M., Dunjić, M.S., Lilić, G.B., Milenković, R.M., Masulović, D.M. and Milićević, M. (2009) Diagnostic Value of Diffusion Weighted Imaging in Assessment of Malignant Focal Liver Lesions. Acta Chirurgica Iugoslavica, 56, 121-125. http://dx.doi.org/10.2298/ACI0904121M
- Kandpal, H., Sharma, R., Madhusudhan, K.S. and Kapoor, K.S. (2009) Respiratory-Triggered versus Breath-Hold Diffusion-Weighted MRI of Liver Lesions: Comparison of Image Quality and Apparent Diffusion Coefficient Values. American Journal of Roentgenology, 192, 915-922. http://dx.doi.org/10.2214/AJR.08.1260
- Gourtsoyianni, S., Papanikolaou, N., Yarmenitis, S., Maris, T., Karantanas, A. and Gourtsoyiannis, N. (2008) Respiratory Gated Diffusion-Weighted Imaging of the Liver: Value of Apparent Diffusion Coefficient Measurements in the Differentiation between Most Commonly Encountered Benign and Malignant Focal Liver Lesions. European Radiology, 18, 486-492. http://dx.doi.org/10.1007/s00330-007-0798-4
- Oner, A.Y., Celik, H., Oktar, S.O. and Tali, T. (2006) Single Breath-Hold Diffusion-Weighted MRI of the Liver with Parallel Imaging: Initial Experience. Clinical Radiology, 61, 959-965. http://dx.doi.org/10.1016/j.crad.2006.06.014
- Bruegel, M., Holzapfel, K., Gaa, J., Bruegel, M., Holzapfel, K., Gaa, J., Woertler, K., Waldt, S., Kiefer, B., Stemmer, A., Ganter, C. and Rummeny, E.J. (2008) Characterization of Focal Liver Lesions by ADC Measurements Using a Respiratory Triggered Diffusion-Weighted Single-Shot Echo-Planar MR Imaging Technique. European Radiology, 18, 477-485. http://dx.doi.org/10.1007/s00330-007-0785-9
- Holzapfel, K., Bruegel, M., Eiber, M., Ganter, C., Schuster, T., Heinrich, P., Rummeny, E.J. and Gaa, J. (2009) Characterization of Small (http://dx.doi.org/10.1016/j.ejrad.2009.05.014
- Parikh, T., Drew, S.J., Lee, V.S., Wong, S., Hecht, E.M., Babb, J.S. and Taouli, B. (2008) Focal Liver Lesion Detection and Characterization with Diffusion Weighted MR Imaging: Comparison with Standard Breath-Hold T2-Weighted Imaging. Radiology, 246, 812-822. http://dx.doi.org/10.1148/radiol.2463070432
- Taouli, B., Vilgrain, V., Dumont, E., Daire, J.L., Fan, B. and Menu, Y. (2003) Evaluation of Liver Diffusion Isotropy and Characterization of Focal Hepatic Lesions with Two Single-Shot Echo-Planar MR Imaging Sequences: Prospective Study in 66 Patients. Radiology, 226, 71-78. http://dx.doi.org/10.1148/radiol.2261011904
- Miller, F.H., Hammond, N., Siddiqi, A.J., Shroff, S., Khatri, G., Wang, Y., Merrick, L.B. and Nikolaidis, P. (2010) Utility of Diffusion-Weighted MRI in Distinguishing Benign and Malignant Hepatic Lesions. Journal of Magnetic Resonance Imaging, 32, 138-147. http://dx.doi.org/10.1002/jmri.22235
- Le Bihan, D. (1995) Molecular Diffusion, Tissue Microdynamics and Microstructure. NMR in Biomedicine, 8, 375- 386. http://dx.doi.org/10.1002/nbm.1940080711
- Türkbey, B., Aras, Ö., Karabulut, N., Turgut, A.T., Akpınar, E., Alibek, S., Pang, Y., Ertürk, S.M., El Khouli, R.H., Bluemke, D.A. and Choyke, P.L. (2012) Diffusion-Weighted MRI for Detecting and Monitoring Cancer: A Review of Current Applications in Body Imaging. Diagnostic and Interventional Radiology, 18, 46-59.
- Qayyum, A. (2009) Diffusion-Weighted Imaging in the Abdomen and Pelvis: Concepts and Applications. Radiographics, 29, 1797-1810. http://dx.doi.org/10.1148/rg.296095521
- Sun, X.J., Quan, X.Y., Huang, F.H. and Xu, Y.K. (2005) Quantitative Evaluation of Diffusion-Weighted Magnetic Resonance Imaging of Focal Hepatic Lesions. Hepatobiliary and Pancreatic Disease International, 11, 6535-6537.
- Herneth, A.M., Guccione, S. and Bednarski, M. (2003) Apparent Diffusion Coefficient: A Quantitative Parameter for in Vivo Tumor Characterization. European Journal of Radiology, 45, 208-213. http://dx.doi.org/10.1016/S0720-048X(02)00310-8
- Kele, P.G. and van der Jagt, E.J. (2010) Diffusion Weighted Imaging in the Liver. World Journal of Gastroenterology, 16, 1567-1576. http://dx.doi.org/10.3748/wjg.v16.i13.1567
- Yamada, I., Aung, W., Himeno, Y., Nakagawa, T. and Shibuya, H. (1999) Diffusion Coefficients in Abdominal Organs and Hepatic Lesions: Evaluation with Intravoxel Incoherent Motion Echo-Planar MR Imaging. Radiology, 210, 617- 623. http://dx.doi.org/10.1148/radiology.210.3.r99fe17617
- Yoshikawa, T., Kawamitsu, H. and Mitchell, D.G. (2006) ADC Measurement of Abdominal Organs and Lesions Using Parallel Imaging Technique. American Journal of Roentgenology, 187, 1521-1530. http://dx.doi.org/10.2214/AJR.05.0778
- Moteki, T. and Horikoshi, H. (2006) Evaluation of Hepatic Lesions and Hepatic Parenchyma Using DiffusionWeighted Echo-Planar MR with Three Values of Gradient b-Factor. Journal of Magnetic Resonance Imaging, 24, 637- 645. http://dx.doi.org/10.1002/jmri.20682
- Quan, X.Y., Sun, X.J., Yu, Z.J. and Tang, M. (2005) Evaluation of Diffusion Weighted Imaging of Magnetic Resonance Imaging in Small Focal Hepatic Lesions: A Quantitative Study in 56 Cases. Hepatobiliary & Pancreatic Diseases International, 4, 406-409.
- Inan, N., Kilinc, F., Sarisoy, T., Gumustas, S., Akansel, G. and Demirci, A. (2010) Diffusion Weighted MR Imaging in the Differential Diagnosis of Haemangiomas and Metastases of the Liver. Radiology and Oncology, 44, 24-29. http://dx.doi.org/10.2478/v10019-010-0001-4
- Goshima, S., Kanematsu, M., Kondo, H., Yokoyama, R., Kajita, K., Tsuge, Y., Watanabe, H., Shiratori, Y., Onozuka, M. and Moriyama, N. (2008) Diffusion-Weighted Imaging of the Liver: Optimizing b Value for the Detection and Characterization of Benign and Malignant Hepatic Lesions. Journal of Magnetic Resonance Imaging, 28, 691-697. http://dx.doi.org/10.1002/jmri.21467
- Desprechins, B., Stadnik, T., Koerts, G., Shabana, W., Breucq, C. and Osteaux, M. (1999) Use of Diffusion-Weighted MR Imaging in Differential Diagnosis between Intracerebral Necrotic Tumors and Cerebral Abscesses. American Journal of Neuroradiology, 20, 1252-1257.
- Lyng, H., Haraldseth, O. and Rofstad, E.K. (2000) Measurement of Cell Density and Necrotic Fraction in Human Melanoma Xenografts by Diffusion Weighted Magnetic Resonance Imaging. Magnetic Resonance in Medicine, 43, 828- 836. http://dx.doi.org/10.1002/1522-2594(200006)43:6<828::AID-MRM8>3.0.CO;2-P
- Feuerlein, S., Pauls, S., Juchems, M.S., Stuber, T., Hoffmann, M.H.K., Brambs, H.J. and Ernst, A.S. (2009) Pitfalls in Abdominal Diffusion-Weighted Imaging: How Predictive Is Restricted Water Diffusion for Malignancy. American Journal of Roentgenology, 194, 1070-1076. http://dx.doi.org/10.2214/AJR.08.2093
- Agnello, F., Ronot, M., Valla, D.C., Sinkus, R., Van Beers, B.E. and Vilgrain, V. (2012) High-b-Value DiffusionWeighted MR Imaging of Benign Hepatocellular Lesions: Quantitative and Qualitative Analysis. Radiology, 262, 511- 519. http://dx.doi.org/10.1148/radiol.11110922
- Humphries, P.D., Sebire, N.J., Siegel, M.J. and Olsen, O.E. (2007) Tumors in Pediatric Patients at Diffusion Weighted MR Imaging: Apparent Diffusion Coefficient and Tumor Cellularity. Radiology, 245, 848-854. http://dx.doi.org/10.1148/radiol.2452061535
Abbreviations
DWI: diffusion-weighted imaging ADC: apparent diffusion coefficient FNH: focal nodular hyperplasia NRH: nodular regenerative hyperplasia MDCT: multi-detector computed tomography HCAs: hepatocellular adenomas SNR: signal-to-noise ratio