Theoretical Economics Letters
Vol.07 No.04(2017), Article ID:76954,24 pages
10.4236/tel.2017.74065
Value at Risk (VaR) Historical Approach: Could It Be More Historical and Representative of the Real Financial Risk Environment?
Evangelos Vasileiou
Department of Business Administration, University of the Aegean, Chios, Greece

Copyright © 2017 by author and Scientific Research Publishing Inc.
This work is licensed under the Creative Commons Attribution International License (CC BY 4.0).
http://creativecommons.org/licenses/by/4.0/


Received: May 1, 2017; Accepted: June 16, 2017; Published: June 19, 2017
ABSTRACT
The purpose of this paper is to suggest a new approach that improves the conventional Historical Value-at-Risk (HVaR) estimations’ accuracy and can be easily applied by anyone. The main assumption for the newly suggested method is “the more representative to the financial conditions the data inputs are, the better the VaR estimations”. Volatility is assumed to be the criterion for the “representative to the financial conditions” definition. In practice, the newly suggested approach does not use the previous x days observations as data inputs in the estimation process (as the HVaR does), but the last x filtered volatility (fv) observations of a “representative to the current financial conditions dataset”. Depending on the volatility value, each observation is classified in several regimes, from which the VaR is estimated depending on the examined day’s volatility. This way the HVaR approach is more historical. The empirical findings using data from the US and the Eurozone stock market show that the newly suggested filtered volatility approach not only significantly improves the VaR estimations, but also makes these estimations much more representative of the real financial conditions. The results using the filtered volatility approach are comparable to some previously documented VaR estimations that adopt advanced econometric models. In this point, we should note advanced econometric models have the drawbacks that are not usually applied in financial markets industry because of their complexity. The newly suggested approach: (i) popularizes some of the most advanced econometric techniques, (ii) improves the VaR estimations accuracy, and (iii) enables financial risk analysts and portfolio managers to estimate the risk-return under several volatility regimes in order to help them to apply their desired investment strategy. Finally, this paper not only examines accuracy using the traditional/conventional tests [1] , but also suggests some new measures for the comparison amongst different VaR models and their ability to accurately estimate the real financial risk.
Keywords:
Value at Risk, Risk Analysis, Volatility Regimes, US Stock Market, Eurozone Stock Market, Risk Measures Accuracy

1. Introduction
Recent financial crises made strong the necessity of a statistical measure which could enable financial economists, practitioners and regulators to estimate the financial risk even on a daily basis. The most popular measure for the financial risk estimation is the Value at Risk (VaR). VaR is a statistical measure which assumes that if the market conditions are normal over a given period of time, a portfolio’s (or a financial instrument’s) maximum losses will not be above the VaR estimation and this is statistically confident at a certain confidence level (usually 95% or 99%).
As the above definition suggests, the VaR is an estimation, not a measure. This means that in contrast to financial indicators/measures, such as the return and volatility, the VaR depends on several assumptions that several methodological approaches may adopt for the most accurate VaR estimation. This is obvious if anybody tries to examine how many different approaches/methodologies have been suggested in the financial literature as far as the VaR issue is con- cerned. The increasing interest for accurate financial risk estimation, in combination with the econometric advances has led to the establishment of the extensive VaR literature.
However, even if interest in the VaR has increased and advanced econometric methodologies have been suggested, there is still a huge discussion regarding the capability to accurately forecast the financial crises. In other words, could we be sure to state that “a financial crisis is coming in the following x days”? Additionally, could we predict how severe this financial crisis would be (e.g. there is a possibility p% to lose l% of the assets)? Even if we believe that a crisis comes during the next days, what preventive actions should be taken (and by whom) in order to protect the financial system? Finally, practitioners and regulators mainly examine a VaR model’s accuracy taking into consideration only the number of violations. In our opinions, some extra parameters should be examined, such as if method’s A VaR estimation is 3%, and method’s B VaR is 1%, and the next day’s real losses are 3.1%, both methods present violation, however could both of them considered to be similarly accurate? Moreover, in growth periods during which the greatest losses are 0.8% why both methods A, B should be assumed to be similarly accurate? This study tries to examine the VaR from these perspectives and to reply to such questions.
Using daily data from Standard and Poor’s 500 Index (SPX) and the Euro Stoxx 50 Index (SX5E) we apply the Historical approach as it is usually used and we present our alternative suggestion that could be easily applied by anyone and increases the VAR estimations’ accuracy2. The specific suggestion’s philosophy could be applied in other mainstream VaR approaches, such as Delta Normal, Monte Carlo etc. Moreover, we present some new views as far as the accuracy issue, additionally to the conventional Kupiec test [1] . Finally, we show an alternative version of the widely-examined Coefficient of Variance measure (CV), which could be applied from all the risk analysts and the investment managers as a part of their investment procedures. Taking into account all the aforementioned aspects, this study tries to contribute to the VaR literature.
The rest of this paper goes as following: Section 2 describes the VaR estimations in practice, the regulatory framework, and briefly presents the literature; Section 3 analyses and applies the historical approach in the traditional (conventional) and the new approach, and Section 4 concludes the study.
2. Value at Risk: Practitioners Side, Regulatory Framework and Literature Review
The necessity of risk measurement has been documented since 1922 when the New York Stock Exchange imposed capital requirements on its member firms. However, according to Holton [2] , the first crude VaR measure was published by Leavens [3] . The following years, the VaR progress that is worth highlighting is JP Morgan’s attempt under the name Risk Metrics [4] to standardize the VaR estimation process which boosted the VaR significance not only for practitioners, but for regulators also (Basle Committee on Bank Supervision [5] , European VaR Directive (CESR/ 10-788, ESMA/2011/2012, ESMA/2012/832)). Since then, the VaR measure has drawn the attention of many scholars, financial analysts and regulators.
Before we present the VaR literature review, it may be useful to examine what the VaR really offers to investors, financial economists and regulators. In general terms, VaR is a statistical risk measure. When a financial economist begins to study finance, the first risk measure that he/she learns is volatility [6] . It is believed that volatility increases during crises periods. Particularly, according to the “volatility feedback hypothesis”, the stock prices should fall (increased risk) when volatility rises. Therefore, the financial crises are linked to increased volatility, and in some way, volatility is assumed to be a risk indicator/measure. So, what is the VaR’s contribution in the field of financial risk?
Assuming that you are working in the financial markets industry and somebody (supervisor, client etc.) wants to know how much risk a fund is taking, what would the answer be? A response in the form of “y% volatility” certainly would not be an adequate reply. That is the VaR contribution as a statistical measure: it can estimate the potential losses in money terms. As we present below, several methodologies for the VaR estimation have been suggested, but we can assume that there are three mainstream VaR methods: the historical simulation, the Delta Normal and the Monte Carlo [7] .
Even if the econometric advances have contributed to increased VaR estimations accuracy, practically in the financial industry the abovementioned mainstream approaches are still widely used3. The reasons why the advanced econometric VaR methodologies are extremely difficult to be applied in practice are:
- Software set-up is extremely difficult to be applied in a multi-asset and complex portfolio, which may comprise of a large amount of securities. For example, let’s assume that we would like to apply a GARCH family model for a Fund of Fund portfolio, in which, in most of the cases, at least 1000 securities will be included. In such a case, the VaR estimation would require increased computer power and a very detailed code, which in most of the cases means increased cost. The increased VaR system’s cost, that some medium/small size fund companies may not afford, in most of the cases is avoided by taking into advantage some regulatory deficiencies [8] .
- The legislation framework is extremely flexible regarding the VaR estimation method. For example the European VaR Directive (CESR/10-788, ESMA/ 2011/2012, ESMA/2012/832, p. 26) only suggests that the VaR confidence level should be 99%, the historical data from which the VaR is estimated should be at least the last 250 observation, and a VaR method is accurate when up to 4 violations to the last 250 observations will be documented. In a recent paper, Vasileiou [8] shows that this framework is ineffective because risk managers could adopt a strict methodology, combined to the relative VaR approach, in order to avoid the VaR violations, without having further ramifications4. Similarly, Basel II is flexible regarding the methodology, and the capital surcharge depends on the backtesting violations. However, the recent financial crisis (following the Lehman Brother’s bankruptcy) revealed the VaR deficiencies: the short-term observation period and the Normal distribution assumption underestimated the extreme losses probability [9] . For more details on the Basel deficiencies see Rossignolo et al. [10] [11] .
Combining the abovementioned we could easily understand that if the regulatory framework does not oblige the banks and the investment companies to adopt advanced VaR methodologies, some companies will not have the motivation to invest in expensive and complicated financial risk systems. The scope of this paper is to examine what the term accurate in Risk Finance means and which is our view regarding the accuracy issue. However, before proceeding further, we believe that it is useful to briefly present the literature review and some of the VaR methodologies that have been documented.
The three mainstream VaR methods are: the Historical, the Delta Normal and the Monte Carlo. All these methods use as inputs the last year(s)’ observations and produce the VaR estimations using slightly different assumptions. Taking into account a portfolio’s securities and their weights, these three approaches estimate the VaR as following:
1) The historical approach uses real historical data and recalculates the portfolio’s returns for the last × observations, assuming that the following days will be similar to the previous x days, and from these x returns the VaR is the 1% or 5% of the lowest returns,
2) Delta Normal calculates the variance-covariance matrix, portfolios sigma and under the normal distribution assumption estimates the VaR, and
3) Monte Carlo has in most cases similar procedures to Delta Normal, but additionally generates several random scenarios using the same data set.
As it is mentioned above, VaR may be a regulatory necessity, but it also should be precise for stability reasons5. This means that VaR should be easily applied and to communicated, and these are the main reasons that many investment companies still apply them.
The historical approach is one of the most easily implemented as well as easy to communicate approach, while it does not present the drawback of fat tails. However, it has some drawbacks; if two of the most important parameters of the VaR estimation-the length of the historical data period and the confidence level-are not set correctly, the VaR estimations will be inaccurate [12] , Brooks and Persand [13] . The data inputs may be the reason for significant differences in VaR estimations for the same days when different historical VaR approaches are applied (equally and exponentially moving average, historical simulation), while the discrepancies amongst different historical VaR approaches may be significantly larger when the 1% confidence level is chosen [14] .
How could we improve the Historical VaR approach in order to produce fewer violations? The literature review offered some ideas that could be applied in the Historical VaR approach, because in most of the cases all the methodologies use the same data inputs, but they estimate the VaR under slightly different assumptions. The econometric and the computational advances enable financial economists and scholars to use more complicated procedures than the three mainstream methods, in order to achieve more accurate VaR estimations. Some of the advanced econometric approaches in recent years are: the filtered historical simulation [15] , extreme value theory [16] , Ozun et al. [17] , non-parametric Kernel Estimators [18] , GARCH family modeling [19] , Degiannakis et al. [20] , Markov Switching Regime [21] , copulas [22] , while a significant amount of technical literature that presents the VaR modeling has been documented [23] , Alexander [24] .
The new methods even if they are promising, in some cases present some drawbacks for their application in practice. Particularly, most of these models are not applied in the financial industry because they are: (i) complex (many times even for the financial risk analyst), (ii) difficult to be applied in a professional environment, and (iii) difficult to be modified if specific adjustments are required6. In this point, we should note that financial industry should follow the econometric advantages in order to promptly forecast and resolve the next financial crisis.
The detailed analysis of the aforementioned approaches is beyond the scope of this paper. However, some ideas that these papers gave us and we tried to incorporate to a newly suggested approach are the following: (i) most of the approaches try to incorporate volatility into their models, and this is a key factor because as it is explained above, volatility is hardwired as risk indicator in most financial economists brain, (ii) in most cases it is useful to divide volatility into several regimes not only regarding the changes in standard deviation terms (Markov Switching Regimes), but also in absolute values, because the absolute volatility may be an indicator for the financial risk environment. If we finally incorporate these features to the newly suggested approach we will examine whether violations are reduced, and whether we can accurately reflect the real financial risk.
In order to incorporate volatility into the traditional VaR approach, we filter the data inputs depending on their volatility level, and we examine how the markets react when such volatility level is observed. These returns are the x filtered volatility (xfv) observations that are used for our newly-suggested VaR methodology. This way, as we analytically present in the next section, we assume that estimating VaR using representative data of the similar current financial conditions (Filtered Historical VaR (FHVaR)), we may have better fitted to the real financial conditions VaR estimations, than in the conventional/traditional Historical VaR (HVAR) case.
3. Filtered Volatility vs. Traditional Historical Approach: Theoretical Discussion and the US Evidence
(A) Theoretical discussion: Historical VaR vs. filtered historical VaR, why could the latter be better?
HVaR is one of the easiest VaR estimation to apply. It is based on three parameters which are defined by the Financial/Risk analyst usually in accordance to the regulatory framework:
- The historical data input length (x days of observations): which is usually defined by the Risk Analyst or the mandate that has to be followed7. The main assumption and the criterion for the x-days definition period is that the financial market will have in the future similar to the last x days performance.
- The other parameter is the confidence level (c.l.) which is usually set at 1% or 5%. This parameter is defined depending on the risk tightness that regulators and/or companies desire.
- The third parameter is the period in which the financial instruments are supposed to be held. This holding period parameter is depended on the mandates that the portfolio managers should serve, e.g. mutual funds managers usually examine the 20-day holding period (dhp), pension funds 20 day up to a year (depending on the actuarial study). The holding period is estimated by the product Daily VaR × sqrt (dhp).
In practice usually two out of the three parameters, c.l. and dhp, are defined either from the legislation framework or from specific mandates. Following the practice, in this study we estimate the VaR at 5% c.l. for a day holding period as most VaR studies do. This means that the financial/risk analyst who adopts the HVaR approach, has to define the most appropriate data input length, the right x8.
The HVaR calculation process, at the 5% c.l. and the one dhp is divided in following three steps:
a) The daily returns of the previous × days are calculated,
b) These daily returns are sorted from the lowest to the highest prices, and
c) The worst 5% of the daily returns is the estimated daily VaR. This approach suggests that for the day the risk is estimated, we are 95% confident that the potential losses could not be more than the estimated VaR.
This approach assumes that the performance of the financial markets could not be significantly different from the last × days performance, or, in other words, the last x days adequately represent the current financial risk.
The latter hypothesis is the major drawback for representative financial risk estimations. The HVaR assumptions turn VaR into a “statistical method”, without a significant financial theory background. In this study, we try to include some financial and behavioral theory views in order to improve the VaR estimations to adequately represent the financial environment without increasing the violations. In order to fill this gap, we pay significant attention to the volatility level.
Volatility is the first risk measure that a financial economist learns when he/ she begins to study finance [6] , and it is generally accepted that increased volatility is linked to increased financial risk periods. Therefore, depending on the volatility the financial market overruns a financial risk regime and triggers the investors’ risk aversion behavior [25] . Volatility is one of the most crucial measures in finance. This is obvious not only in financial theory, but in practice also. Some of the most popular and better performing econometric models (GARCH, Markov Switching Regimes) are deemed superior to the traditional approaches (OLS regressions) because they enable financial economists, scholars and practitioners to incorporate volatility into their estimations. As we mentioned in the literature section, the VaR field of study has incorporated these econometric advantages; however, these approaches are too complex for daily implementation.
Taking as granted that volatility is important in financial economics, our scope is to find a way to include the specific measure in a historical VaR framework. Assuming that financial economists link the increased volatility to increased financial risk, the volatility level may be a very representative indicator of the financial conditions (and risk). The next assumption is that investors react in similar way when similar financial conditions exist in the market. Therefore, in order to incorporate volatility in the HVaR estimation method, we follow the steps described below:
- We estimate the market’s volatility, since when we have data,
- We examine how the market reacts when the volatility moves in specific levels. As market’s reaction we define the respective daily returns, depending on the volatility level (filtered volatility returns (fv)), and
- When the VaR is going to be estimated, depending on the specific day’s volatility level, the data inputs for the VaR estimation are not the last x observations, as in the HVaR approach, but the last xfv observations of similar volatility periods,
- These xfv daily returns are sorted from the lowest to the highest prices, and
- The worst 5% of the xfv daily returns is the estimated daily VaR, which in this way turns from HVaR to FVHVaR.
This way assuming that financial markets may have the tendency to perform similarly in similar conditions of risk, the VaR estimations when the FVHVaR approach is adopted, may be more representative of the real financial conditions, because more representative inputs are used. This way the FVHVaR approach is much more based on behavioral and financial theory than the conventional HVaR. Figure 1 presents the HVaR-FVHVaR differences in the estimation process. In next paragraphs, we practically present these assumptions for the US and the Eurozone case.
Before we move to the empirical section we should present some alternative views regarding the accuracy issue. Usually, when the VaR estimations accuracy is examined the one (1) day holding period is set. The traditional accuracy tests examine the violations taking into account the daily VaR estimation [1] . Violations are defined as the days during which the daily losses are greater than the estimated VaR according to the legislation framework. However, is the viola-
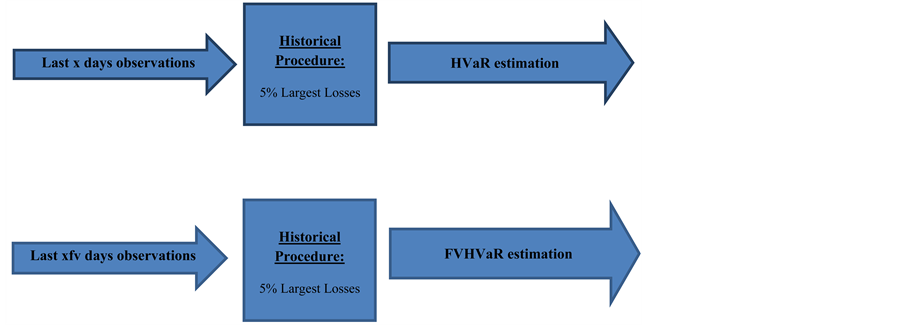
Figure 1. Traditional vs. Filtered Volatility Historical VaR (HVaR vs. FVHar). The HVaR calculation process, at the 5% c.l. and the one dhp is divided in following three steps: (a) the daily returns of the previous x days are calculated, (b) these daily returns are sorted from the lowest to the highest prices, and (c) the worst 5% of the daily returns is the estimated daily VaR. On the other hand, the FVHVaR estimation procedure is as following: (a) the market’s volatility is estimated, (b) the market’s returns depending on the volatility level (filtered volatility returns (fv)) are divided in several regimes, (c) when the VaR is going to be estimated, depending on the specific day’s volatility level, the data inputs for the VaR estimation are the last xfv observations of similar volatility periods, (d) these xfv daily returns are sorted from the lowest to the highest prices, and (e) the worst 5% of the xfv daily returns is the estimated daily VaR (FVHVaR).
tions number the only parameter in which we should pay attention to concerning the accuracy issue? In practice, if a financial manager wants to avoid the regulatory consequences(s) he may adopt a length period for which the VaR estimation is large and this way the VaR violations may be as few as possible. In this case, does the VaR estimation represent the real financial risk, which theoretically is its primary scope, or does it simply conform to the legislative requirements9? As we present below, an alternative/extra view to the term “accuracy”, beyond the number of violations, should be how little the difference between the daily returns and the VaR estimation is. An extremely strict VaR during a normal/growth period does not represent the real financial risk, but it is accurate according to the law. Could another set of VaR estimations which present more violations than the stricter one, but it is closer to the daily returns be (more) “accurate”? VaR’s accuracy is an additional issue that this study tries to discuss and is practically analyzed in the rest of the paper.
(B) Historical VaR vs. filtered historical var: Empirical evidence from the US case
We apply the Historical VaR approach and the newly suggested Filtered Volatility Historical VaR (FVHVaR) for the US case, and specifically the S & P500 Index (SPX). We examine the VaR models for the period 2000-15, because this time span offers us the opportunity to empirically test the VaR methods during two financial crises periods (2000-3, 2008-9). Figure 2 presents the S & P500 Performance and the Daily Returns during the examined period, and it can be easily observed that during the recession periods volatility increases.
Figure 2 enables us to present the theoretical difference in HVaR and FVHVaR methodologies. The traditional Historical VaR approach suggests that the previous year’s (years’) could be representative of the current financial conditions, therefore, the VaR estimations may be accurate. However, let’s assume that we estimate the VaR for the days near the spots G (R) (Figure 2) which is the peak (troughs) of a specific period. Why could the previous year’s (years’) observations be representative for the current VaR estimation? If the data inputs are not representative, how could the VaR estimations be accurate?
The FVHVaR’s main assumption is that volatility could be a reliable indicator for the financial conditions. The reasons are, at least, the following:
High volatility means a stressed period for the financial markets, while low volatility is linked to normal/growth periods (Figure 2 confirms this linkage), which means that during similar volatility periods financial markets tend to perform in a similar way, therefore such data inputs may be more appropriate than the last x observations for the VaR estimation, and
Most of the advanced methodologies, such as GARCH family, Markov Switching Regimes, try to incorporate the volatility in their estimation process in order to estimate better fitted models than the conventional OLS models. Similarly, we try to incorporate volatility in HVaR estimation process.
 (a)
(a) (b)
(b)
Figure 2. S & P500 Performance, Daily Returns and Volatility relationship 1996-2015. The figures below show that the previous x days observations when the HVaR approach is examined may be the reason for the HVaR model’s inadequacy when a financial crisis emerges. For the same reasons, when a growth period comes after a recession, the VaR estimations may be too strict. In other words, the VaR may lag and to not instantly represent the real financial risk (part (a)). On the other hand, the FVHVaR approach may better represent the financial risk conditions because volatility increases during the crises periods, and falls during the growth/normal periods (part (b)). Source: Bloomberg. (a) S & P500 Performance and Daily Returns; (b) S & P500 Performance and Volatility relationship 1996-2015.
The volatility’s significance in financial economics and its appropriateness as data filtering indicator may be the easiest part of our analysis. The hardest part is to quantitatively define the low, intermediate and high volatility terms. We assume that market behavior is similar when volatility levels are similar. For example, when the volatility is v% the last x observations at this volatility level predict an l% VaR. However, we do not have sufficient data for each volatility level in order to estimate the VaR. Therefore, we set some regimes amongst the volatility’s absolute values assuming that in this range volatility is considered as similar. For example, we assume that in day t the volatility is 1.5%. If we had a large number of observations, we could filter our data and estimate the VaR taking into consideration the last x return observations in which the volatility was 1.5%. This way the historical VaR could be … really historical, because it estimates the VaR taking into consideration historical data of similar conditions.
However, we do not have such a large amount of data, therefore, we should make some further assumptions, such as that when the volatility is between 1% and 2% the financial conditions are considered as similar, the market reacts in a similar way, therefore the dataset has inputs from the specific regime and the VaR could be closer to the real financial risk. This way we assume that the FVHVaR may be better fitted to the real financial environment risk estimations.
In order to set the model’s volatility periods, we calculate the 22-day volatilities. Supposing that we would like to estimate VaR taking into consideration the volatility data up to 2000 we have to set the regimes. The data show that the 22-day volatility presents prices from 0.16% up to 6.43%10. For the US case, we set the following 5 regimes:
Up to 1%,
1% - 2%,
2% - 3%,
3% - 4.5%, and
Higher than 4.5%.
The main FVHVaR scenario that is presented in this study is estimated at 5% significance level because: (a) most studies report VaR at this level [20] , and (b) to show that even at this level, the newly suggested approach presents increased discrepancies relative to the HVaR estimations (in contrast to Hendricks’s [14] conclusions). The dataset that is used as inputs is 250 observations in order to be typically in accordance to international legislations regarding the VaR11.
Table 1 presents the VaR results not only for the whole period (2000-15), but also for each year separately, because the legislation framework usually requires yearly back testing12. The results out of parentheses and brackets indicate the VaR violations. If there is an asterisk this is an indication that the model is not adequate for the one day trading VaR forecasting when the the Kupiec test [1] at p-value < 0.05 significance level is applied. The percentages of violations relative to the total number of violations are reported in parentheses. The mean VaR

Table 1. HVaR vs. FVHVaR Results Per Year (2000-15): the US case. The table below presents the VaR results not only for the period 2000-15, but also for each year separately. The results out of parentheses and brackets indicate the VaR violations. Violations are defined as the days during which the daily losses are greater than the estimated VaR. If there is an asterisk this is an indication that the model is not adequate for one day trading day ahead VaR forecasting using the Kupiec test (p-value < 0.05). The percentages of violations relative to the total number of violations are reported in parentheses. Squared brackets are used to report the mean VaR values, while curly brackets report the VaR standard deviations.
values are reported in squared brackets, while the VaR standard deviations are reported in curly brackets. The mean return and the standard deviations are reported because they could be an indication for the VaR’s estimation flexibility to adjust so as to account for the real risk in the financial environment.
Comparing the FVHVaR versus the HVaR empirical results it can be easily observed that in some cases historical VaR estimations may present the lowest number of violations when the whole period is examined, but this may mislead our conclusions. That is the reason why in contrast to most VaR studies, we present not only the whole period’s violations, but also each year’s back testing results (as the CERS/10-788 requires). Characteristically, the long term HVaRs presents fewer violations when the whole period is examined, but it is not accurate according to Kupiec test [1] when each year individually is examined. Indicatively, the 4 Years Traditional Historical VaR presents 217 violations (fewer amongst all the examined Historical VaR estimations (filtered included)), however it fails to accurately predict the VaR when each year separately is examined in 2000, 2002, 2007, 2008 and 2009. The reason for the low number of violations is that in the last years (2010-15) of the examined period, the estimated VaR is too strict, because the 2007-9 financial crisis data are included in the calculation process, and this results in fewer violations. The HVaR estimations are not flexible to instantly capture the financial environment’s risk (see the VaR standard deviation in Table 1). The aforementioned benefit of the long period historical VaR estimations during the post crisis period is a drawback when the crisis period comes because it is not flexible enough to be accurately adjusted to the new financial conditions. Specifically, upon examining the recent financial crisis 2007-9 we notice the following:
- All the traditional VaR measures fail to accurate predict the financial risk (according to Kupiec Test [1] ) during the years 2007-8. In 2009, the longer-term traditional VaRs (4Y and 5Y) still fail, because they include pre-crisis observations13,
- The FVHVaR fails to accurately predict the crisis only in 2008 (borderline), the mean VaR estimations seem to be in line with the environment, because it is the most flexible methodology.
The results in Table 1 show that FVHVaR is the most accurate methodology, because it fails the yearly Kupiec test [1] only once, and the most flexible (see the mean VaR from year to year, and the increased VaR standard deviation (Table 1)). As it has been mentioned above, this study tries to present an alternative view regarding the term “accuracy” as far as VaR estimations. The VaR estimation is an indication of the expected risk. We should not be focused only on the number of violations, but also examine if the VaR estimations adequately represent the financial environment. Therefore, the VaR should be flexible enough to take into account changes in the financial environment. Table 2 reports:
Table 2. Deviations of the VaR estimations. The following table reports: (i) the average deviation of VaR estimations from the negative return days (excluding violation days14) in order to show which method presents the strictest, but not necessarily the most representative financial environment VaR estimations, and (ii) the average deviations of the VaR estimations when violations are documented in order to examine which method even if it violated its VaR estimations is closer to the financial risk during each period15.
1) The average deviation of VaR estimations from the negative return days without violations16 in order to show which method presents the strictest, but not always the most representative of the financial environment VaR estimations, and
2) The average deviations of the VaR estimations including violations in order to examine which method, even if it has violated its VaR estimations, is closer to the financial risk during each time period17.
As the results show, the VaR estimations using the filtered volatility approach are not as strict as the traditional approaches (on average the FVHVaR estimations are 1.21% lower than the negative (but not violated) return days, which is the lowest deviation amongst the examined methods)18. Moreover, even when FVHVaR is violated the risk is very close to the real returns, and it certainly performs better than the traditional approaches (on average FVHVaR fails to predict the losses by about 0.65%, which is the lowest deviation amongst the examined models).
From all the above mentioned we may conclude that the newly suggested approach:
- Improves the traditional VaR estimations (fewer Kupiec test failures [1] (Table 1)),
- Is almost instantly adjustable to financial conditions (see VaR’s mean estimations and standard deviations per year (Table 1)), and
- Better equipped to estimate real risk (lowest VaR deviations from negative return days even when the VaR estimation is violated (Table 2)).
All the aforementioned are presented in Figure 3.

Figure 3. S & P500 value at risk estimations (absolute values) and performance. Source: Bloomberg.
Additionally, we should not forget that the newly suggested approach could be optimized-updated periodically, depending on the new observations; however, such optimization never took place in the basic example presented in this study (see note 10). In real life risk assessment, the approach could be updated annually, thereby resetting some of the methodology parameters using the well know optimization procedures. Such parameters are: (i) the volatility regimes, (ii) the days for which volatility is used as a criterion, and/or (iii) the number of observations that will be included in the VaR estimation process. Moreover, during the back-testing process the risk analyst may work as a team with a portfolio (or investment) manager and analyze the portfolio performance under a new-alternative view that the FVHVaR offers.
Table 3 reports some scenarios of FVHVaR estimations by changing some of the aforementioned parameters in practice. Let’s assume that a Portfolio Analysis Team (PAT), made up of a risk analyst and a portfolio manager, examines the VaR-Return relationship for portfolio optimization. PAT examines if the 44-day volatility is a better indicator for the financial conditions of the examined market. As the back-testing results show, the settings in alternative Scenario 1 vs. the basic scenario produce VaR estimation for which: the number of violations is reduced (231 vs. 234), VaR deviation from the negative return days is reduced too (1.17% vs. 1.21%), but when the VaR is violated then deviation increases (0.75% vs. 0.65%). The PAT is able to decide which scenario fits their strategy better.
Table 3. Descriptive Statistics and Measures for the comparison amongst VaR model capability to accurately represent/estimate the financial risk/conditions.
The new method offers an additional view in portfolio analysis: it offers a PAT the ability to examine the risk-return relationship in VaR terms and in several volatility regimes19. Particularly, PAT analyses the regimes (basic scenario) and the results show that when the 22-day volatility is up to 1% and/or belongs into the regime 2% - 3% the returns are positive. Therefore, statistics show that when these VaR levels are observed, investing seems an appropriate choice. On the other hand, when a 3% - 4.5% volatility value is observed the risk is quite large, and the returns confirm it, so a short or a zero position may be more appropriate in this regime. However, as the theory suggests increased risk may offer increased profit opportunities, therefore, when the volatility value is more than 4.5% the average daily returns are very high.
Taking into account the aforementioned procedures a PAT may examine several FVHVaR scenarios. For example, a PAT may
- Change the number of observations (Alternative Scenario 2) because it may assume that the last 300 observations may be statistically safer than the 250, or
- Set up a completely new scenario such as Alternative Scenario 3, which uses different volatility regimes, shorter volatility period (because PAT assumes that shorter volatility more accurately represents the financial conditions), and fewer observations that are used in the calculation process (because more recent observations are more representative of market behavior than the oldest) than the basic scenario.
The filtered volatility approach enables a PAT not only to easily apply several scenarios, but also to instantly back-test them.
Up to this point, we have argued that the FVHVaR improves the traditional VaR approach. A counterargument that could emerge is that even if the specific approach improves the old-fashioned traditional VaR, its results are comparable to the estimations of other advanced econometrical approaches? In Appendix 1, we show a comparison between FVHVaR and some advanced econometric approaches as estimated and presented in the Degiannakis et al. [20] study.
Another possible counterargument that could emerge is whether or not the suggested filtered historical approach could be easily applied to other financial markets? We have already presented the US case, and how the FHVaR is applied. We replicated the procedure for the Eurozone case, examining the Eurostoxx 50 index, as a robustness test. The conclusions were the same. The FHVaR significantly improves the traditional VaR approach, presenting fewer violations and better fitted VaR estimations.
4. Conclusions
The scope of this study is to present an easy to apply and to explain VaR approach that enables risk analysts, scholars and financial economists to improve the VaR estimations not only in terms of fewer VaR violations, but also in terms of more representative VaR estimations.
In order to achieve the aforementioned scopes, we reviewed the most recent and econometrically advanced VaR methodologies, and we tried to popularize them. Most of these approaches take the concept of volatility into serious consideration (GARCH family, and Markov Switching Regimes models). Therefore, (i) we used volatility as the most representative of the real financial conditions indicator, (ii) we set several volatility regimes that fit the stock market under examination, (iii) we have filtered the data observations in different datasets depending on volatility value, (iv) in order to estimate the VaR we examined in which volatility regime the observation belongs to, and we applied the historical VaR approach (the simplest VaR methodology) using as inputs the suitable dataset. This way we estimate VaR taking into account how the stock market behaved in previous years, when the financial conditions (volatility) were similar. Therefore, the new Filtered Volatility Historical VaR is really historical because it is applied to historical data from similar financial conditions and not only to the last observations (as the traditional historical approach).
The newly suggested approach assumes that the better fitted the data inputs are, the better the VaR estimations are. The empirical findings show that this assumption is confirmed. The FVHVaR improves the HVaR estimations by presenting fewer rejections of the Kupiec test [1] on a yearly basis during the sample period (2000-15) for the US and the Eurozone20 stock markets. Moreover, when the VaR estimations are violated the deviation using the FVHVaR estimation is the minimum amongst the examined approaches (HVaR 1 - 5 years), while the estimations are the least strict and the most flexible (Table 2, Figure 3).
Additionally, the newly suggested approach is flexible enough to be applied to other VaR approaches such as Monte Carlo, Delta Normal, Exponentially Weighted VaR, because the filtered data sample could be included in the respective estimation processes (in Figure 1 instead of Historical we may adopt another approach). Therefore, in order to improve the VAR estimation models accuracy, there is no need to apply advanced mathematical models and programs which may prove expensive and in practice are not widely used. We could simply and easily improve the VaR estimations by improving the quality of the inputs, and the FVHVaR seems to be a very reliable suggestion.
The specific approach is significantly flexible and could be applied by risk analysts and scholars in order to examine the VAR estimation under different- desired scenarios, e.g. by changing (a) the volatility regimes, (b) the volatility length criterion and/or (c) the number of last observations that are included into the estimation process. This way the newly suggested approach enables: (i) the risk analyst to minimize the violations using an optimization process, and (ii) portfolio managers and/or financial analysts to examine the risk/return relationship under several assumptions. Further analysis on the specific issue may be useful in the future not only for VaR purposes, but also as part of a portfolio management strategy.
Cite this paper
Vasileiou, E. (2017) Value at Risk (VaR) Historical Approach: Could It Be More Historical and Re- presentative of the Real Financial Risk Environment? Theoretical Economics Letters, 7, 951-974. https://doi.org/10.4236/tel.2017.74065
References
- 1. Kupiec, P.H. (1995) Techniques for Verifying the Accuracy of Risk Measurement Models. The Journal of Derivatives, 3, 73-84. https://doi.org/10.3905/jod.1995.407942
- 2. Holton, G.A. (2002) History of Value-at-Risk: 1922-1988. Contingency Analysis Working Paper.
- 3. Leavens, D.H. (1945) Diversification of Investments. Trusts and Estates, 80, 469-473.
- 4. Morgan, J.P. (1996) Riskmetrics: Technical Document. Morgan Guaranty Trust Company of New York.
- 5. Basle Committee on Banking Supervision (1996) Overview of the Amendment to the Capital Accord to Incorporate Market Risks. Bank for International Settlements.
- 6. Brigham, E.F. and Ehrhardt, M.C. (2013) Financial Management: Theory & Practice. Cengage Learning.
- 7. Linsmeier, T.J. and Pearson, N.D. (2000) Value at Risk. Financial Analysts Journal, 56, 47-67. https://doi.org/10.2469/faj.v56.n2.2343
- 8. Vasileiou, E. (2016) Overview of the Greek Value at Risk (VaR) Legislation Framework: Deficiencies, Proposals for Future Revision and a New Suggested Method. Journal of Financial Regulation and Compliance, 24, 213-226.
- 9. Financial Services Authority (2009) The Turner Review: A Regulatory Response to the Global Banking Crisis. Publication Reference 003289.
- 10. Rossignolo, A.F., Fethi, M.D. and Shaban, M. (2012) Value-at-Risk Models and Basel Capital Charges: Evidence from Emerging and Frontier Stock Markets. Journal of Financial Stability, 8, 303-319. https://doi.org/10.1016/j.jfs.2011.11.003
- 11. Rossignolo, A.F., Fethi, M.D. and Shaban, M. (2013) Market Crises and Basel Capital Requirements: Could Basel III Have Been Different? Evidence from Portugal, Ireland, Greece and Spain (PIGS). Journal of Banking & Finance, 37, 1323-1339. https://doi.org/10.1016/j.jbankfin.2012.08.021
- 12. Vlaar, P.J. (2000) Value at Risk Models for Dutch Bond Portfolios. Journal of Banking & Finance, 24, 1131-1154. https://doi.org/10.1016/S0378-4266(99)00068-0
- 13. Brooks, C. and Persand, G. (2000) Value-at-Risk and Market Crashes. Journal of Risk, 2, 5-26. https://doi.org/10.21314/JOR.2000.029
- 14. Hendricks, D. (1996) Evaluation of Value-at-Risk Models Using Historical Data (Digest Summary). Economic Policy Review Federal Reserve Bank of New York, 2, 39-67.
- 15. Barone-Adesi, G., Giannopoulos, K. and Vosper, L. (1999) VaR without Correlations for Portfolios of Derivative Securities. Journal of Futures Markets, 19, 583-602.
- 16. Assaf, A. (2009) Extreme Observations and Risk Assessment in the Equity Markets of MENA Region: Tail Measures and Value-at-Risk. International Review of Financial Analysis, 18, 109-116. https://doi.org/10.1016/j.irfa.2009.03.007
- 17. Ozun, A., Cifter, A. and Yilmazer, S. (2010) Filtered Extreme-Value Theory for Value-at-Risk Estimation: Evidence from Turkey. The Journal of Risk Finance, 11, 164-179. https://doi.org/10.1108/15265941011025189
- 18. Huang, A.Y.-H. and Tseng, T.W. (2009) Forecast of Value at Risk for Equity Indices: An Analysis from Developed and Emerging Markets. The Journal of Risk Finance, 10, 393-409. https://doi.org/10.1108/15265940910980687
- 19. Angelidis, T., Benos, A. and Degiannakis, S. (2004) The Use of GARCH Models in VaR Estimation. Statistical Methodology, 1, 105-128. https://doi.org/10.1016/j.stamet.2004.08.004
- 20. Degiannakis, S., Floros, C. and Livada, A. (2012) Evaluating Value-at-Risk Models before and after the Financial Crisis of 2008: International Evidence. Managerial Finance, 38, 436-452. https://doi.org/10.1108/03074351211207563
- 21. Billio, M. and Pelizzon, L. (2000) Value-at-Risk: A Multivariate Switching Regime Approach. Journal of Empirical Finance, 7, 531-554. https://doi.org/10.1016/S0927-5398(00)00022-0
- 22. Huang, J.J., Lee, K.J., Liang, H. and Lin, W.F. (2009) Estimating Value at Risk of Portfolio by Conditional Copula-GARCH Method. Insurance: Mathematics and Economics, 45, 315-324. https://doi.org/10.1016/j.insmatheco.2009.09.009
- 23. Jorion, P. (2007) Value at Risk: The New Benchmark for Managing Financial Risk. Vol. 3, McGraw-Hill, New York.
- 24. Alexander, C. (2009) Market Risk Analysis, Value at Risk Models. Vol. 4, John Wiley & Sons, Hoboken.
- 25. Bollerslev, T., Gibson, M. and Zhou, H. (2011) Dynamic Estimation of Volatility Risk Premia and Investor Risk Aversion from Option-Implied and Realized Volatilities. Journal of Econometrics, 160, 235-245. https://doi.org/10.1016/j.jeconom.2010.03.033
- 26. Pritsker, M. (2006) The Hidden Dangers of Historical Simulation. Journal of Banking & Finance, 30, 561-582. https://doi.org/10.1016/j.jbankfin.2005.04.013
Appendix
Appendix 1: Exponentially Weighted Moving Average (EWMA), GARCH, APARCH and Filtered Volatility Historical VaR back-testing com- parisons.
Degiannakis et al. [20] examined the S & P500 at 5% significance level and applied several econometrically advanced VaR processes, such as Exponentially Weighted Moving Average (EWMA), GARCH, and APARCH models (the detailed analysis of these methods estimation is beyond this study’s scope, however, Degiannakis et al. [20] describe them in detail). In their study they report that for the pre-crisis period 17/8/2004-31/12/2007 EWMA, GARCH and APARCH models are adequate, considering the Kupiec test [1] as criterion (6.1%, 5.2% and 4.0% violations ratio, respectively21). However, since the crisis emerged in 2008 only the APARCH model is considered as accurate (5.9% violations).
The Basic FVHVaR approach that is mainly presented in this paper is adequate for the pre-crisis period, but fails during the crisis period (2/1/2008-31/12/ 2008). However, with some minor adjustments, as those reported in FVHVaR Scenario 3, the results are significantly improved and the number of violations during the crisis is the lowest amongst the examined models (5.53% violations ratio).
Therefore, the FVHVaR approach may be comparable (and/or better than) to some of the most advanced econometric VaR approaches. Moreover, the filtered volatility historical VaR method can be easily applied, it does not require development of extremely difficult code, it is flexible, while it is very easy to understand, because it relies more on economics theory than on statistical approaches.
The percentages indicate the violations ratios during the respective time periods depending on the VaR approach. An asterisk is used to denote models which are considered inadequate for one-trading-day-ahead VaR forecasting (p-value, 0.05).
Appendix 2. Traditional vs. Filtered Volatility Historical VaR Approach: the Eurostoxx 50 case.
In order to examine an additional case beyond the US and the S & P500 index, we have chosen to apply the FVHVaR approach to the Eurozone case, which is also one of the world’s most significant financial markets. The index which is chosen to represent the Eurozone case is the Eurostoxx 50, Europe’s leading blue-chip index, which provides a blue-chip representation of supersector leaders in the Eurozone. The index covers 50 stocks from 12 Eurozone countries. The Index is licensed to financial institutions to serve as underlying for a wide range of investment products such as Exchange Traded Funds (ETF), Futures and Options and structured products.
We use a data set 31.12.1986 up to 31.12.2015, which has been gathered from Bloomberg data base, but as examination period we have the same as in the S & P500 case 2000-2015. As Figure A1 shows the Eurostoxx 50 presents at least two recession periods, as in the US case, but the rebound after the global crisis of 2007-9 differs from the S & P500 case.
Examining the volatility from 31.12.1986 up to 30.12.1999 the 22-day volatility presents values up to 4.14%. We set the filtered data inputs to 250 observations, in order for the basic scenario to be similar to the core scenario of our study, and taking all these into account we set the following three regimes:
§ Up to 1.20%,
§ From 1.20% up to 2.00%, and
§ Higher than 2.00%.
The results are presented in Table A1, and show that the FVHVaR Approach presents the fewest VaR violations, without setting strict parameter values, while it is the most flexible amongst the examined methodologies. It only failed Kupiec’s accuracy test once (2008) just as in the US case (without any further parameter adjustments since the initial set up). Table A2, shows that the newly suggested approach depicts the real financial risk more accurately, because it estimates VaRs which are not too strict (it has the lowest deviation from the negative return days in comparison to the traditional approaches), and even when violations are documented, they are the lowest observed (0.74%), which means that PAT is in alert.

Figure A1. Eurostoxx 50 performance and daily returns. Source: Bloomberg.
Table A1. HVaR vs. FVHVaR results per year (2000-15): the Eurozone’s case.
Table A2. Deviations of the VaR estimations.
To sum up, the above-mentioned findings constitute extra proof, a robustness test, for the benefits of the new approach; the better the data inputs (filtering depending on the volatility regime), the better the VaR estimations. The main assumption is that the market will perform during the examined period in a way similar to comparable/analogous risk situations in the past.
NOTES
1As exception (VaR violation) we define cases when the real financial losses are more than those that have been estimated by the VaR model.
2The term accuracy as we defined it is analyzed below.
3Indicatively, professional databases and softwares, such as Bloomberg, offer to their clients the Historical, the Delta Normal and the Monte Carlo methodologies for the VaR estimation.
4For example, the Undertakings for the Collective Investment of Transferable Securities (UCITS) are not obliged to publish the VaR, therefore most of the clients are not aware of the financial risk they bear, and so they do not withdraw their investments. More details in Vasileiou ( [8] p. 217-219).
5Accurate VaR estimations increase the financial stability, because when financial crises are coming increased capital requirements absorb more of the financial shocks.
6For example, Bloomberg and Thomson Reuters, which are some of the most popular professional softwares, do not have econometrically advanced VaR models. An additional reason for the preference for the simplest approaches is that advanced VaR methodologies require advanced econometric and technical knowledge for regulators and investors in order to understand the methods and their outcomes [8] .
7As it has mentioned the legislation framework is very flexible as far as the specific parameter. It requires at least the last 250 daily observations.
8That is the reason why the sample’s length is so significant for the accurate VaR estimations [26] .
9Vasileiou [8] analytically presents the deficiencies of the EU Directive European VaR Directive (CESR/10-788, ESMA/2011/2012, ESMA/2012/832).
10We considered data only from 1928-1999. Theoretically, these calculations should be re-calculated and the regimes should be re-set every year. However, in order to present the procedure as simplest as we can, we assume that these regimes are stable, and in this way we reduce the optimization capability.
11Basel and European Directives 85/611/EEC, CERS/10-788, ESMA/2011/2012 mention that for the VaR estimation at least one year’s data are required (approximately 250 observations). For this reason, 250 observations are included in the basic scenario. In this point, we should stress that this combination is not the optimal, but as we present below the new approach is very flexible, and in any case its estimations are more representative of the real financial risk.
12The European VaR legislation framework (CERS/10-788, p. 35), requires modifications in the VaR (99% c.l.) model if the overshootings are more than 4 in the last years observations is applied. In this study we examine the VaR at 95% c.l., and we assume that the Kupiec test [1] is our criterion for the VaR model’s validation.
13The longer the data inputs the less volatile the VaR values are, and the mean VaR values are also significantly lower.
14We report the deviations excluding the reported deviations, because these deviations will be tempered if the violation days are included due to the opposite signs.
15A 2% VaR estimation when the actual losses are 3% is less accurate than for example a VaR estimation of 2.9%. The Law considers both VaR estimations as violations, but in reality, the second one is closer to the financial risk.
16We report the deviations excluding the reported deviations, because these deviations will be tempered if the violation days are included due to the opposite signs.
17A 2% VaR estimation when the actual losses are 3% is less accurate than for example a VaR estimation of 2.9%. The Law considers both VaR estimations as violations, but in reality, the second one is closer to the financial risk.
18This is another confirmation that traditional VaR approaches are stricter than the filtered volatility VaR (see Table 2, mean VaR estimations).
19Even as undergraduate students, financial economists learn that the optimal financial decision amongst several investment choices is the one that presents the higher return/volatility ratio (Brigham and Ehrhardt [6] ).
20In Appendix 2, we briefly provide the evidence for the Eurostoxx 50 index. The conclusions are similar to the US case, but in order to save space and to not repeat the procedure we present the specific evidence in the Appendix.
21Unfortunately, in Degiannakis et al. [20] there are evidence only for the number of cumulative VaR violations (as percentage of the respective observations), and the Kupiec test [1] . There is not reported evidence for the yearly back testing, the VaR deviation from the negative return day, or the deviation when violations are documented.