Paper Menu >>
Journal Menu >>
 Vol.2, No.5, 435-440 (2010) doi:10.4236/health.2010.25065 Copyright © 2010 SciRes. http://www.scirp.org/journal/HEALTH/ Health Openly accessible at Effect of apigenin on the reproductive system in male mice Hui Li, Hong-Bo Li, Ming Zhang, Fang Yan, Zhong-Xian Zhang, Zhi-Lan Li* School of Public Health, Lanzhou University, Lanzhou, China; *Corresponding Author: lizhl@lzu.edu.cn Received 23 November 2009; revised 7 January 2010; accepted 8 January 2010. ABSTRACT This study aimed to characterize the effect of apigenin on the reproductive system in male mice. Adult male mice were treated with intrap- eritoneal injection of apigenin at the dose levels of 5, 10, 15, 20 and 25 mg/kg.bw, 0.05% DMSO and 0.9% normal saline daily for seven days. Then, testis and epididymis sperms in sperm motility, sperm morphology, the percentages of ploidy cells and seminiferous epithelium cells at the cell-circle phase, and the ratio of ploidy cells were evaluated. The results showed that sperm density significantly reduced in the 25 mg/kg group compared with the solvent control group. The abnormal sperms were mainly amorphous; non-hook sperms took the second largest group; and banana, double-tail and folded-tail sperms were rare. Abnormal sperms were mainly in the head sperm. Moreover, after intraperitoneal in- jection of 5 mg/kg apigenin, the percentage of 1C population increased, and the percentage of 4C declined, leading to a significant increase of the 1C:4C ratio, compared with the solvent and negative control groups. The percentage of seminiferous epithelium cells at the cell-circle phase of G0/G1 exhibited a significant increase in the 25 mg/kg group compared with the con- trol groups. Taken together, that apigenin has adverse effects on the reproductive system in adult male mice is demonstrated. Keywords: Apigenin; Male Mice; Intraperitoneal Injection; Sperm Motility; Sperm Morphology; Flow Cytometry 1. INTRODUCTION In the early 1970s, several studies in the United States first suggested a possible decline in human sperm con- centration [1]. Since then, there has been increased awareness of the possible effects of chemicals on male fertility [2,3]. It is of paramount importance to assess potential health risks associated with exposure to chemical or physical agents since these agents may in- terfere with the ability of individuals to produce normal progeny. Apigenin is a common flavone present in diet: it is not only in aromatic plants (camomilla, rosemary and parsley), but also in celery, apple, honey, fennel and wheat germ [4-6]. Although apigenin is less active than its homologous isoflavone, genistein, much attention has been paid to its endocrine properties and potential effects on fertility recently. As a ligand of estrogen receptor [7,8], in vitro apigenin has estrogenic activity on the growth of trans- fected cells that are estrogen-dependent and have addi- tive effects on 17-estradiol [6]. It has been shown that apigenin reduces the endogenous level of estrogen re- ceptors in mouse uterus [9], enhances the estrogenicity of low-dose estradiol in immature rats [10], and has a protective effect on skin tumorigenesis, a hormonal- dependent cancer [11]. Moreover, anti-fertility proper- ties of apigenin have been observed: apigenin is an ac- tive constituent of Striga orobanchioides, a medicinal plant with contraceptive properties [12]. Many potential mechanisms have been proposed to explain these (anti-) estrogenic and (anti-) carcinogenic properties including interaction with estrogen receptors [6,13], modulation of biosynthesis and metabolism of steroidhormones [14,15], enhancement of gap-junction intercellular communica- tion, and apoptosis induction [16,17]. While the effect of apigenin on the reproductive system has been studied, to our best knowledge, the adverse effects of apigenin on sperm motility, sperm morphology and is still not very clear. Here these ef- fects in male mice were investigated. 2. MATERIALS AND METHODS 2.1. Test Materials This work was supported by the research foundation for the young an d the middle-aged scientist in Gansu Province, China (Grant No. 099RJYA003). Apigenin was obtained from Shanxi Hui Ke Plant Ex-  H. Li et al. / HEALTH 2 (2010) 435-440 Copyright © 2010 SciRes. http://www.scirp.org/journal/HEALTH/Openly accessible at 436 ploitation Limited Company (China), whose purity was 98.00%. Dimethyl sulfoxide (DMSO) was purchased from Shanxi Hua Mei Bioengineering Company (China). All other chemicals were obtained from standard com- mercial sources and were with the highest available quality. 2.2. Animals Eight-four healthy, adult male SPF mice of Kunming strain, whose body weights ranged from 32 to 35 g, ap- proximately seven weeks old, were obtained from Ex- perimental Animal Center, Gansu College of Traditional Chinese Medicine, Lanzhou, Gansu, China (Animal Cer- tificate of Quality No: SCXK [Gan]: 2004-0006-0000 328). The use of these animals was approved by the Chinese Association for Laboratory Animal Sciences. They were housed in the GLP laboratory (Laboratory Certificate of Quality No: SCXK [Gan]: 2004-0006-000 0328-0000120), where the temperature of 25°C, the relative humidity of approximately 50%, and a photope- riod of 12 h light: 12 h dark were maintained. All ani- mals were housed on sawdust beds in cages and given the standard diet and distilled water of ad libitum during the whole study. 2.3. Chemicals and Experimental Design A stock solution of 1.88 mg/ml apigenin was prepared by dissolving 376 g apigenin in 1ml DMSO and 199 ml 0.9% normal saline (NS). The solvent was 0.05% DMSO, and different concentrations of apigenin were prepared after the dilution with 0.05% DMSO. According to their body weights, male mice were randomly assigned to seven groups (12 animals per group) including one sol- vent group, one negative control group, and five experi- mental groups. The solvent and negative control groups were given 0.05% DMSO and 0.9% NS by intraperito- neal injection, respectively. The five experimental groups were given apigenin at the dose levels of 5, 10, 15, 20 and 25 mg/kg.bw once a day for seven consecu- tive days. Solution concentrations were adjusted so that a 30 g mouse received a solution of 0.4 ml. The body weights were recorded since the start of dosing, then once every two days, until the day of necropsy. The ac- tual dose volume was adjusted according to the recorded body weight. Male mice were killed after cervical dislo- cation on the day following the last injection. On the day of sacrifice, the body weight was recorded. Immediately after sacrifice, both testes and epididymes were excised, trimmed free fat, placed on a paper towel to remove any liquid, and then weighted separately. 2.4. Sperm Motion Analysis Sperm motion was analyzed with the WLJY-9000 sperm quantity detection system (Beijing Wei Li New Century Science and Technology Development Limited Company, China).The left epididymes were excised and placed in a pre-warmed peridish (37°C) consisting of 1 ml NS (0.86% sodium chloride). The tissue was made three cuts in the mid-to-distal region with a scalpel blade to release spermatozoa into the medium, which was then placed in a 37°C thermostatic water-bath box for 30 min prior to the measurement of sperm motility. The suspension was stirred, and 10 µl was placed on a clean counter board, mounted with a special cover lip, and then observed with four to six microscope fields. With the sperm quantity detection system, the percentages of mobile sperms, cur- vilinear velocity (VCL), straight-line velocity (VSL), average path velocity (VAP), mean moving angle (MAD), amplitude of lateral displacement (ALH), beat cross frequency (BCF), linearity (LIN), straightness (STR), wobble (WOB)and sperm density were calcu- lated, respectively. 2.5. Sperm Morphology Analysis The right epididymes were minced with an eye scissor in 3 ml NS (0.86% NaCl), repetitively beaten by pipette, kept for 5 min and then filtered with four-layer lens pa- per. The sperm morphology was assessed by smearing the sperm suspension on a pre-cleaned slide with a drop from the filtrate. Once air-dried, the samples were fixed with methanol for 15 min, stained with 2% eosin for 1h, rinsed thoroughly with distilled water and dried in air. For each sample, 1,000 sperms from different fields were observed under 40 × magnification with a light microscope (Olympus, Japan), and according to the de- scription of Huang et al. [18], classified as normal, amorphous, non-hook, banana, double-tail and folded-tail. 2.6. Cell Cycle Analysis The right testis was surgically removed, stripped of ad- hering fat and connective tissues, and weighted. The germ cells were released from seminiferous tubules in cold phosphate buffered saline (PBS) at pH 7.4 by mincing the testes with fine curved scissors. The cell suspension was aspirated with PBS and filtered in a 200 mesh nylon mesh in order to remove tissue debris. The suspension was centrifuged at 1,500 rpm for 5 min. The supernatant was discarded, and the pellet was re-suspended in 10 ml PBS, and then centrifuged at 800 rpm for 5 min. After rinsing three times as above, the pellet was fixed in 75% ethanol and stored at 4°C. After 24 h, the fixed germ cells were washed with PBS to re- move ethanol, and then the suspension was centrifuged at 1,500 rpm for 5 min. The supernatant was discarded, and the pellet was stained with Propidium iodide (PI) in darkness for 30 min. The pellet was filtered in a 320 mesh nylon mesh to remove cell mass. The filtrates were detected with flow cytometry (Epics. COULTER XL, USA).  H. Li et al. / HEALTH 2 (2010) 435-440 Copyright © 2010 SciRes. http://www.scirp.org/journal/HEALTH/Openly accessible at 437 437 2.7. Statistical Analyses Statistical analyses were performed with SPSS (ver- sion15.0). Body weights, organ indexes, sperm motility parameters, the percentages of cell subpopulation were analyzed by one-way ANOVA, and the obtained data were expressed as mean ± SD. For parameters with sig- nificant differences among groups, multiple comparison tests were carried out. The percentages of sperm mor- phology were analyzed by the χ2 test, and the data were expressed as the constituent ratio. The parameters values were compared at the 5% significance level. 3. RESULTS 3.1. Effect of Apigenin on Body and Reproductive Organ Weights The body weights of mice in seven groups increased at different levels, but compared with the solvent and nega- tive control groups, none of the experimental groups showed statistically significant differences in body weight, relative testes and epididymides weight (Table 1). 3.2. Effect of Apigenin on Sperm Motion and Density The mouse sperm densities in five experimental groups reduced at different levels, and compared with the sol- vent control group, there was a statistically significance in the 25 mg/kg group (Table 2). 3.3. Effect of Apigenin on Sperm Morphology The mean percentage of abnormal sperms ranged from 2.69% to 3.16% in the experimental groups. The five experimental groups did not significantly differ from each other or the control groups. Furthermore, abnormal sperms were mainly classified as amorphous; non-hook sperm took the second largest group; banana, double-tail and folded-tail sperms were rare, which were mainly concentrated in the head sperms. 3.4. Effect of Apigenin on Cell Cycle After injection of 5 mg/kg apigenin, the percentage of 1C population increased significantly compared with the other groups; that of 4C decreased compared with the negative control group; and a significant increase of 1C:4C ratio was observed compared with the control groups. Compared with the solvent and negative control groups, the percentage of seminiferous epithelium cells at the cell-circle phase of G0/G1 exhibited a significant increase in the 25 mg/kg group. 4. DISCUSSION The study on apigenin investigated whether apigenin had any toxic effect on the reproductive system in adult male mice. Intraperitoneal injection of apigenin for seven days to mice led to no obvious change in their body weights. The relative weights of testis and epididymis showed no marked changes as well, when normalized with the whole body weights. Sperm motion is important for the sperm functional capacity, and the assessment of sperm motion is very useful for detecting or evaluating male reproductive tox- icity [19]. For this purpose, both percentage of mobile spermatozoa and characteristics of sperm movement might provide key information. More quantitative and qualitative evaluation of toxic effects on sperm motion (e.g., motility) has been possible with the computer- assisted sperm analysis (CASA) system. Besides the conventional parameters, the system also describes sperm kinematics movements [20-27]. In this study,the results showed that compared with the solvent control group, sperm density had a significantly reduction in the 25 mg/kg group was shown, which is consistent with the results of Pu et al. [28]. On the other side, others pa- rameters did not show significant variation in any ex- perimental group. Taken together, our results suggested that apigenin had some effects on sperm motion pa- rameters in mice. Sperm morphology is another important aspect in as- sessing sperm quality as well as a key index to evaluate reproductive toxicity and mutagenicity of exogenous chemicals [29]. The results showed that abnormal sperms were mainly concentrated in the head sperm, which is consistent with the observation that the changes of sperm morphology are mainly in the head. In recent years, the flow cytometry analysis has grown rapidly, which allows the recognition of several cell types at various stages of spermagenesis [30,31]. In par- ticular, after treatment with toxic agents, the flow cy- tometry analysis of testicular tissue can be used to detect variations in terms of the relative fractions of different cell subpopulations, thus providing crucial evidence on possible toxic effects [32]. In this study, the percentages of different germ cell types in male mice as a function of dose after the treatments with different doses of apigenin were reported. Based on the DNA content, three germ-cell peaks could be identified through flow cy- tometry: 1C (round spermatids), 2C (spermatogonia) and 4C (primary spermatocytes). After intraperitoneal injec- tion of 5 mg/kg apigenin, the percentage of 1C popula- tion increased, the percentage of 4C decreased and so the 1C:4C ratio significantly increased, indicating that pri- mary spermatocytes decreased but round spermatids increased. This observation suggested that apigenin stimulated the meiosis of spermatogonia, and the effect 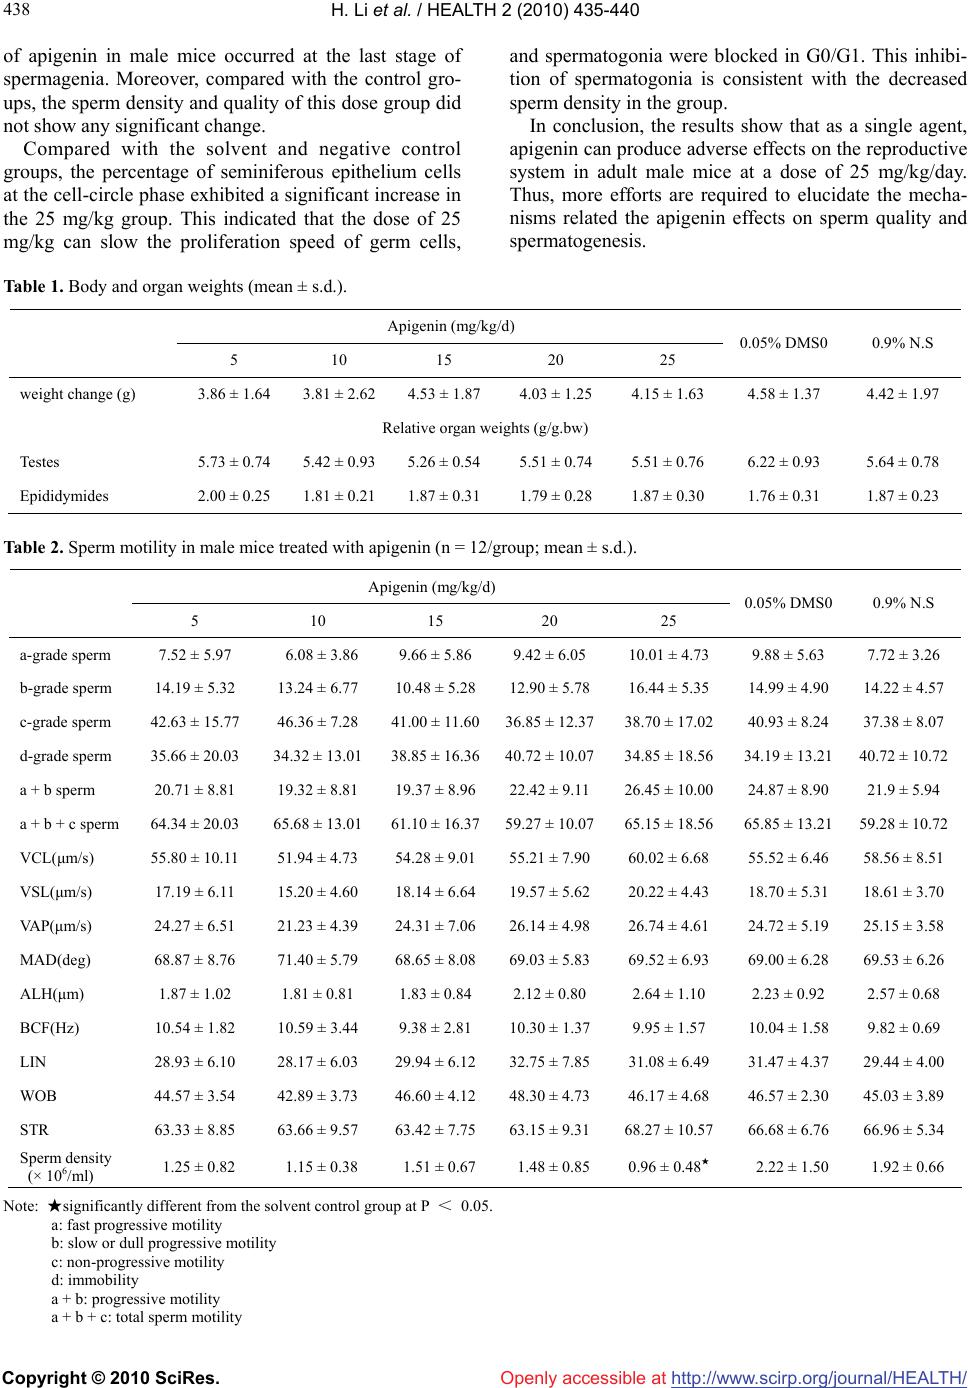 H. Li et al. / HEALTH 2 (2010) 435-440 Copyright © 2010 SciRes. http://www.scirp.org/journal/HEALTH/Openly accessible at 438 of apigenin in male mice occurred at the last stage of spermagenia. Moreover, compared with the control gro- ups, the sperm density and quality of this dose group did not show any significant change. Compared with the solvent and negative control groups, the percentage of seminiferous epithelium cells at the cell-circle phase exhibited a significant increase in the 25 mg/kg group. This indicated that the dose of 25 mg/kg can slow the proliferation speed of germ cells, and spermatogonia were blocked in G0/G1. This inhibi- tion of spermatogonia is consistent with the decreased sperm density in the group. In conclusion, the results show that as a single agent, apigenin can produce adverse effects on the reproductive system in adult male mice at a dose of 25 mg/kg/day. Thus, more efforts are required to elucidate the mecha- nisms related the apigenin effects on sperm quality and spermatogenesis. Table 1. Body and organ weights (mean ± s.d.). Apigenin (mg/kg/d) 5 10 15 20 25 0.05% DMS0 0.9% N.S weight change (g) 3.86 ± 1.64 3.81 ± 2.62 4.53 ± 1.87 4.03 ± 1.25 4.15 ± 1.63 4.58 ± 1.37 4.42 ± 1.97 Relative organ weights (g/g.bw) Testes 5.73 ± 0.74 5.42 ± 0.93 5.26 ± 0.54 5.51 ± 0.74 5.51 ± 0.76 6.22 ± 0.93 5.64 ± 0.78 Epididymides 2.00 ± 0.25 1.81 ± 0.21 1.87 ± 0.31 1.79 ± 0.28 1.87 ± 0.30 1.76 ± 0.31 1.87 ± 0.23 Table 2. Sperm motility in male mice treated with apigenin (n = 12/group; mean ± s.d.). Apigenin (mg/kg/d) 5 10 15 20 25 0.05% DMS0 0.9% N.S a-grade sperm 7.52 ± 5.97 6.08 ± 3.86 9.66 ± 5.86 9.42 ± 6.05 10.01 ± 4.73 9.88 ± 5.63 7.72 ± 3.26 b-grade sperm 14.19 ± 5.32 13.24 ± 6.77 10.48 ± 5.28 12.90 ± 5.78 16.44 ± 5.35 14.99 ± 4.90 14.22 ± 4.57 c-grade sperm 42.63 ± 15.77 46.36 ± 7.28 41.00 ± 11.6036.85 ± 12.3738.70 ± 17.02 40.93 ± 8.24 37.38 ± 8.07 d-grade sperm 35.66 ± 20.03 34.32 ± 13.01 38.85 ± 16.3640.72 ± 10.0734.85 ± 18.56 34.19 ± 13.21 40.72 ± 10.72 a + b sperm 20.71 ± 8.81 19.32 ± 8.81 19.37 ± 8.96 22.42 ± 9.11 26.45 ± 10.00 24.87 ± 8.90 21.9 ± 5.94 a + b + c sperm 64.34 ± 20.03 65.68 ± 13.01 61.10 ± 16.3759.27 ± 10.0765.15 ± 18.56 65.85 ± 13.21 59.28 ± 10.72 VCL(μm/s) 55.80 ± 10.11 51.94 ± 4.73 54.28 ± 9.01 55.21 ± 7.90 60.02 ± 6.68 55.52 ± 6.46 58.56 ± 8.51 VSL(μm/s) 17.19 ± 6.11 15.20 ± 4.60 18.14 ± 6.64 19.57 ± 5.62 20.22 ± 4.43 18.70 ± 5.31 18.61 ± 3.70 VA P ( μm/s) 24.27 ± 6.51 21.23 ± 4.39 24.31 ± 7.06 26.14 ± 4.98 26.74 ± 4.61 24.72 ± 5.19 25.15 ± 3.58 MAD(deg) 68.87 ± 8.76 71.40 ± 5.79 68.65 ± 8.08 69.03 ± 5.83 69.52 ± 6.93 69.00 ± 6.28 69.53 ± 6.26 ALH(μm) 1.87 ± 1.02 1.81 ± 0.81 1.83 ± 0.84 2.12 ± 0.80 2.64 ± 1.10 2.23 ± 0.92 2.57 ± 0.68 BCF(Hz) 10.54 ± 1.82 10.59 ± 3.44 9.38 ± 2.81 10.30 ± 1.37 9.95 ± 1.57 10.04 ± 1.58 9.82 ± 0.69 LIN 28.93 ± 6.10 28.17 ± 6.03 29.94 ± 6.12 32.75 ± 7.85 31.08 ± 6.49 31.47 ± 4.37 29.44 ± 4.00 WOB 44.57 ± 3.54 42.89 ± 3.73 46.60 ± 4.12 48.30 ± 4.73 46.17 ± 4.68 46.57 ± 2.30 45.03 ± 3.89 STR 63.33 ± 8.85 63.66 ± 9.57 63.42 ± 7.75 63.15 ± 9.31 68.27 ± 10.57 66.68 ± 6.76 66.96 ± 5.34 Sperm density (× 106/ml) 1.25 ± 0.82 1.15 ± 0.38 1.51 ± 0.67 1.48 ± 0.85 0.96 ± 0.48★ 2.22 ± 1.50 1.92 ± 0.66 Note: ★significantly different from the solvent control group at P < 0.05. a: fast progressive motility b: slow or dull progressive motility c: non-progressive motility d: immobility a + b: progressive motility a + b + c: total sperm motility 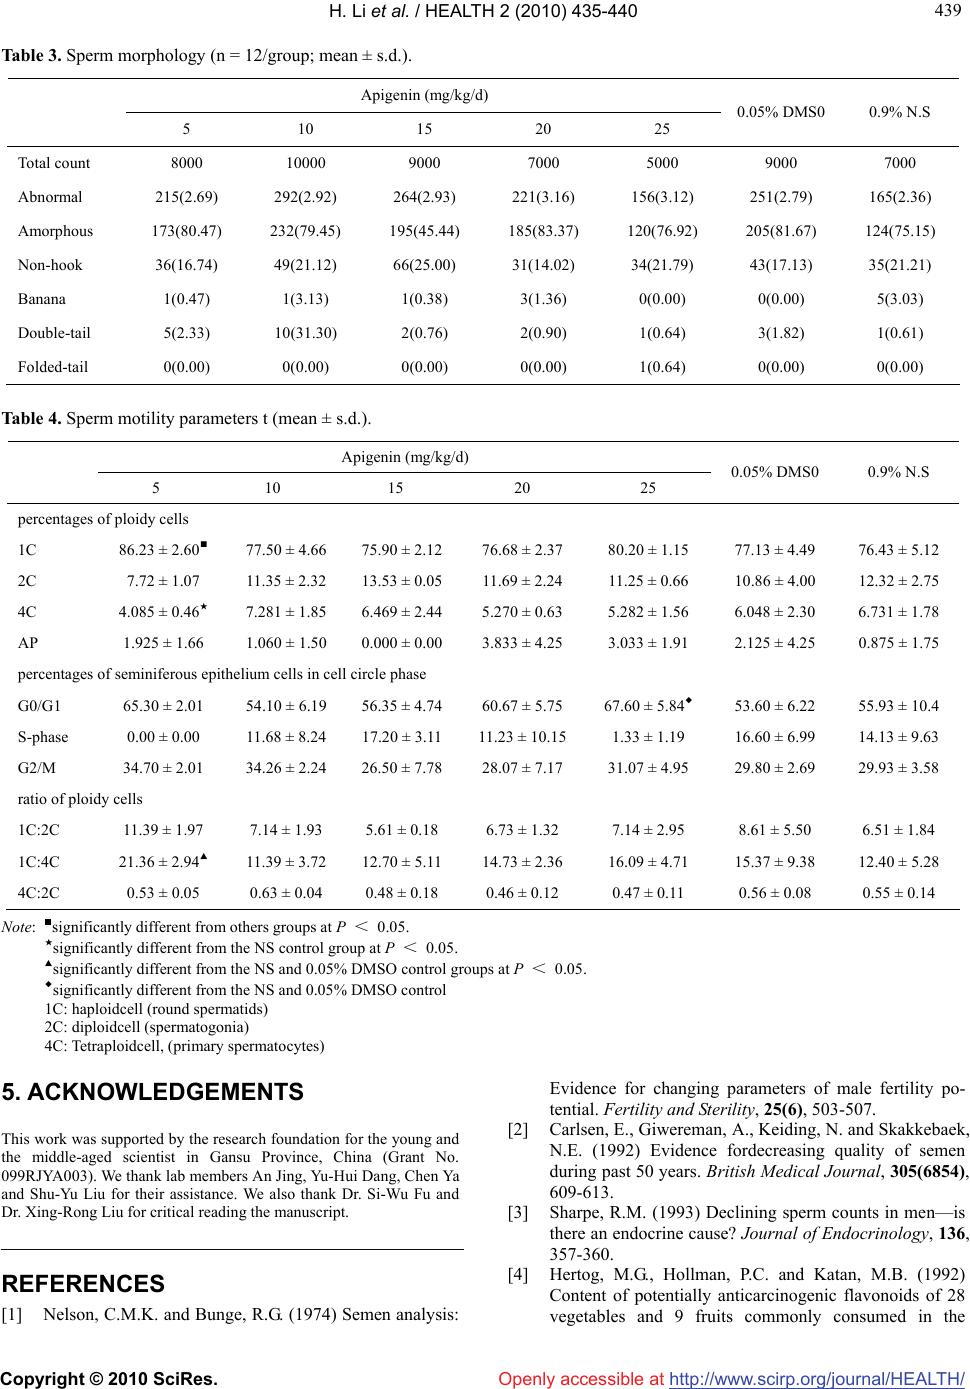 H. Li et al. / HEALTH 2 (2010) 435-440 Copyright © 2010 SciRes. http://www.scirp.org/journal/HEALTH/ 439 439 Openly accessible at Table 3. Sperm morphology (n = 12/group; mean ± s.d.). Apigenin (mg/kg/d) 5 10 15 20 25 0.05% DMS0 0.9% N.S Total count 8000 10000 9000 7000 5000 9000 7000 Abnormal 215(2.69) 292(2.92) 264(2.93) 221(3.16) 156(3.12) 251(2.79) 165(2.36) Amorphous 173(80.47) 232(79.45) 195(45.44) 185(83.37) 120(76.92) 205(81.67) 124(75.15) Non-hook 36(16.74) 49(21.12) 66(25.00) 31(14.02) 34(21.79) 43(17.13) 35(21.21) Banana 1(0.47) 1(3.13) 1(0.38) 3(1.36) 0(0.00) 0(0.00) 5(3.03) Double-tail 5(2.33) 10(31.30) 2(0.76) 2(0.90) 1(0.64) 3(1.82) 1(0.61) Folded-tail 0(0.00) 0(0.00) 0(0.00) 0(0.00) 1(0.64) 0(0.00) 0(0.00) Table 4. Sperm motility parameters t (mean ± s.d.). Apigenin (mg/kg/d) 5 10 15 20 25 0.05% DMS0 0.9% N.S percentages of ploidy cells 1C 86.23 ± 2.60■ 77.50 ± 4.66 75.90 ± 2.12 76.68 ± 2.37 80.20 ± 1.15 77.13 ± 4.49 76.43 ± 5.12 2C 7.72 ± 1.07 11.35 ± 2.32 13.53 ± 0.05 11.69 ± 2.24 11.25 ± 0.66 10.86 ± 4.00 12.32 ± 2.75 4C 4.085 ± 0.46★ 7.281 ± 1.85 6.469 ± 2.44 5.270 ± 0.63 5.282 ± 1.56 6.048 ± 2.30 6.731 ± 1.78 AP 1.925 ± 1.66 1.060 ± 1.50 0.000 ± 0.00 3.833 ± 4.25 3.033 ± 1.91 2.125 ± 4.25 0.875 ± 1.75 percentages of seminiferous epithelium cells in cell circle phase G0/G1 65.30 ± 2.01 54.10 ± 6.19 56.35 ± 4.74 60.67 ± 5.75 67.60 ± 5.84◆ 53.60 ± 6.22 55.93 ± 10.4 S-phase 0.00 ± 0.00 11.68 ± 8.24 17.20 ± 3.11 11.23 ± 10.15 1.33 ± 1.19 16.60 ± 6.99 14.13 ± 9.63 G2/M 34.70 ± 2.01 34.26 ± 2.24 26.50 ± 7.78 28.07 ± 7.17 31.07 ± 4.95 29.80 ± 2.69 29.93 ± 3.58 ratio of ploidy cells 1C:2C 11.39 ± 1.97 7.14 ± 1.93 5.61 ± 0.18 6.73 ± 1.32 7.14 ± 2.95 8.61 ± 5.50 6.51 ± 1.84 1C:4C 21.36 ± 2.94▲ 11.39 ± 3.72 12.70 ± 5.11 14.73 ± 2.36 16.09 ± 4.71 15.37 ± 9.38 12.40 ± 5.28 4C:2C 0.53 ± 0.05 0.63 ± 0.04 0.48 ± 0.18 0.46 ± 0.12 0.47 ± 0.11 0.56 ± 0.08 0.55 ± 0.14 Note: ■significantly different from others groups at P < 0.05. ★significantly different from the NS control group at P < 0.05. ▲significantly different from the NS and 0.05% DMSO control groups at P < 0.05. ◆significantly different from the NS and 0.05% DMSO control 1C: haploidcell (round spermatids) 2C: diploidcell (spermatogonia) 4C: Tetraploidcell, (primary spermatocytes) 5. ACKNOWLEDGEMENTS This work was supported by the research foundation for the young and the middle-aged scientist in Gansu Province, China (Grant No. 099RJYA003). We thank lab members An Jing, Yu-Hui Dang, Chen Ya and Shu-Yu Liu for their assistance. We also thank Dr. Si-Wu Fu and Dr. Xing-Rong Liu for critical reading the manuscript. REFERENCES [1] Nelson, C.M.K. and Bunge, R.G. (1974) Semen analysis: Evidence for changing parameters of male fertility po- tential. Fertility and Sterility, 25(6), 503-507. [2] Carlsen, E., Giwereman, A., Keiding, N. and Skakkebaek, N.E. (1992) Evidence fordecreasing quality of semen during past 50 years. British Medical Journal, 305(6854), 609-613. [3] Sharpe, R.M. (1993) Declining sperm counts in men—is there an endocrine cause? Journal of Endocrinology, 136, 357-360. [4] Hertog, M.G., Hollman, P.C. and Katan, M.B. (1992) Content of potentially anticarcinogenic flavonoids of 28 vegetables and 9 fruits commonly consumed in the  H. Li et al. / HEALTH 2 (2010) 435-440 Copyright © 2010 SciRes. http://www.scirp.org/journal/HEALTH/Openly accessible at 440 Netherlands. Journal of Agricultural and Food Chemis- try, 40(12), 2379-2383. [5] Havsteen, B.H. (2002) The biochemistry and medicinal significance of the flavonoids. Pharmacology & Thera- peutics, 96(2-3), 67-202. [6] Le Bail, J.C., Varnat, F., Nicolas, J.C. and Habrioux, G. (1998) Estrogenic and antiproliferative activities on MCF-7 human breast cancer cells by flavonoids. Cancer Letters, 130(1), 209-216. [7] Breinholt, V.M., Offord, E.A., Brouwer, C., Nielsen, S.E., Brosen, K. and Friedberg, T. (2002) In vitro investigation of cytochrome P450-mediated metabolism of dietary flavonoids. Food and Chemical Toxicology, 40(5), 609- 616. [8] Havsteen, B.H. (2002) The biochemistry and medicinal significance of the flavonoids. Pharmacology & Thera- peutics, 96(2-3), 67-202. [9] Breinholt, V., Hossaini, A., Svendsen, G.W., Brouwer, C. and Nielsen, E. (2000) Estrogenic activity of flavonoids in mice. The importance of estrogen receptor distribution, metabolism and bioavailability. Food and Chemical Toxicology, 38(7), 555-564. [10] Stroheker, T., Cabaton, N., Berges, R., Lamothe, V., Lhuguenot, J.C. and Chagnon, M.C. (2003) Influence of dietary soy isoflavones on the accessory sex organs of the Wistar rat. Food and Chemical Toxicology, 41(8), 1175-1183. [11] Birt, D.F., Hendrich, S. and Wang, W. (2001) Dietary agents in cancer prevention: Flavonoids and isoflavon- oids. Pharmacology & Therapeutics, 90(2-3), 157-177. [12] Hiremath, S.P., Badami, S., Hunasagatta, S.K. and Patil, S.B. (2000) Antifertility and hormonal properties of fla- vones of Striga orobanchioides. European Journal of Pharmacology, 391(1-2), 193-197. [13] Miksicek, R.J. (1995) Estrogenic flavonoids: Structural requirements for biological activity. Proceedings of the Society for Experimental Biology and Medicine, 208(1), 44-50. [14] Dai, R., Jacobson, K.A., Robinson, R.C. and Friedman, F.K. (1997) Differential effects of flavonoids on testos- terone-metabolizing cytochrome P450s. Life Sciences, 61, L75-L80. [15] Ibrahim, A.R. and Abul-Hajj, H.Y. (1990) Aromatase inhibition by flavonoids. Journal of Steroid Biochemistry and Molecular Biology, 37(2), 257-260. [16] Suschetet, M., Siess, M.H., Le Bon, A.M. and Canivenc- Lavier, M.C. (1998) Anticarcinogenic properties of some flavonoids, In: Vercauteren, J., Che`se, C. and Triaud, J. Eds., Polyphenols 96, INRA Editions, Versailles, 165- 204. [17] Wang, I.K., Lin-Shiau, S.Y. and Lin, J.K. (1999) Induc- tion of apoptosis by apigenin and related flavonoids through cytochrome c release and activation of caspase-9 and caspase-3 in leukae mia HL-60 cells. European Journal of Cancer, 35(10), 1517-1525. [18] Huang, X. and Chen, X. (1985) Methodology of mutage- nic, teratogenic and carcinogenic environmental chemi- cals, Zhejiang Science & Technology Press, Hangzhou, 64. [19] Perreault, S.D. (1997) The mature spermatozoa as a tar- get for reproductive toxicants. In: Oekelheide, K., Chapin, R.E., Hoyer, P.B. and Harris, C., Eds., Comprehensive toxicology, Reproductive and Endocrine Toxicology, 10, 165-179. [20] Seed, J., Chapin, R.E., Clegg, E.D., Dostal, L.A., Foote, R.H., Hurtt, M.E., et al. (1996) Methods for assessing sperm motility, morphology, and counts in the rat, rabbit, and dog: A consensus report. Reproductive Toxicology, 10(3), 237-244. [21] Slott, V.L., Suarez, J.D. and Perreault, S.D. (1991) Rat sperm motility analysis: Methodologic considerations. Reproductive Toxicology, 5(5), 449-458. [22] Toth, G.P., Stober, J.A., George, E.L., Read, E.J. and Smith, M.K. (1991) Sources of variation in the com- puter-assisted motion analysis of rat epididymal sperm. Reproductive Toxicology, 5(6) 487-495. [23] Chapin, R.E., Filler, R.S., Gulati, D., Heindel, J.J., Katz, D.F., Mebus, C.A., et al. (1992) Methods for assessing rat sperm motility. Reproductive Toxicology, 6(3), 267- 273. [24] Slott, V.L., Suarez, J.D., Poss, P.M., Linder, R.E., Strader, L.F. and Perreault, S.D. (1993) Optimization of the Ham- ilton-Thorn computerized sperm motility analysis system for use with rat spermatozoa in toxicological studies. Fundamental and Applied Toxicology, 21(3), 298-307. [25] Slott, V.L., Linder, R.E. and Dyer, C.J. (1994) Method of euthanasia does not affect sperm motility in the labora- tory rat. Reproductive Toxicology, 8(4), 371-374. [26] Wier, P.J. and Rumberger, D. (1995) Isolation of rat sperm from the vas deferens for sperm motion analysis. Reproductive Toxicology, 9(3), 327-330. [27] Dostal, L.A., Faber, C.K. and Zandee, J. (1996) Sperm motion parameters in vas deferens and cauda epididymal rat sperm. Reproductive Toxicology, 10(3), 231-235. [28] Pu, Y., Li, Z., Zhao, J., Wang, X., Dang, Y. and An, J. (2007) The experimental study on the effect of celery on sperm quality in mice. Health Vocational Education, 25, 122-124. [29] Wang, H., Meng, Z. and Chang, F. (2006) The toxic ef- fects of in vivo derivatives of sulfur dioxide on sperms in male mice. Journal of Application and Environmental Biology, 12, 363-366. [30] Petim, J.M., Ratinaud, M.H., Cordelli, E., Spano, M. and Julien, R. (1995) Mouse testis cell sorting according to DNA and mitochondrial changes during spermatogenesis. Cytometry, 19(4), 304-312. [31] Suter, L., Bechter, R., Koch, E. and Bohadilla, M. (1998) Three parameter flow cytometric analysis of rat sper- matogenesis. Cytometry, 27(2), 161-168. [32] Spano, M., Baroleschi, C., Cordelli, E., Leter, G., Tiveron, C. and Pacchierotti, F. (1996) Flow cytometric assess- ment of trophosophamide toxicity on mouse spermato- genesis. Cytometry, 24, 174. |