Paper Menu >>
Journal Menu >>
 J. Biomedic a doi: 10.4236/j b Published O n An an a using t Chris C. S t 1 Bioprocess R 2 Department o 3 Department o Email: erik.b o Received 6 F e ABSTRA C There is co n surin g nucl e tions. The m thod is the r anal y zed wi t (Ct) method . performed h of initial co n a concentra t resultant Ct dard and n o riabilit y /reli a supports th rep li c a t e s , t h tically disti n ten orders o tion. As exp g row as the demonstrat e confound q u tion at low t that a misc l 3000 initial c tion re g ion thermal we a vide data t h detection st r and plate fi classificatio n becomes un r Keywords: M Molecule C o Replicates a n 1. INTR O Real time P o a l Science a n b ise.2010.350 6 n line May 201 a lysis o f t he Ct m t owers1, Fr e R &D Division D o f Biomedical E o f Biomedical I n o czko@vander b e bruary 2010; r e C T n siderable i n e ic acids fro m m ost commo n r eal-time pol y t h the crossi n . Utilizin g a m h undreds of r e n ditions whos e t ion ran g e of value distrib u o vel statistic a a bilit y of th e e followin g h e mean and/ o ng uishable an o f ma g nitude ected, the va r number of i n e that these v u antitative cl a t emplate con c l assification t c opies of tem p corr elates w a r o f t h e TA Q h at indicate r ate gy based llin g statisti c n transition w r eliable. M isclassificat i o unting; Rank n d Reliability O DUCTIO N o lymerase C h n d En g ineeri n 6 4 Published O n 0 in SciRes. h f quant i m ethod e derick R. H D ow AgroScie n E ngineering Va n n formatics Va n b ilt.edu e vised 1 Marc h n terest in qu a m sin g le cells n l y emplo y e d y merase chai n ng point or c r m ultiwell plat e e plicate reac t e initial num b ten orders o f u tions are an a l techniques e PCR proc e conclusions. o r me d i an Ct d can be ra n in initial te m r iances in th e n itial copies d v ariances are a ssification o f c entrations. T t ransition is p late DNA a n w ith indepen d Q pol y merase that an alte r on the theo r c s is accurat e w here the r e i on Transitio n Ordering Ru n N h ain Reaction ng , 2010, 3, 4 5 n line May 201 0 h ttp://www.sci r i tative P H aselton2, E r n ces LLC India n n derbilt Unive r n derbilt Univer s h 2010; accepte d a ntitat iv el y m to small po p d laborator y n reaction (P C r ossin g thres h e rea der w e h t ions each at a b er of copies s f ma g nitude. al y zed with s to assess th e e ss. Our ana l Given suffi c values are st a n k ordered a c m plate conce n e Ct distribu t d eclines to 1. lar g e enou gh f the init ial co T he data ind i centered ar o n d that the tr a d ent data on enz y me. We p r native end p ry of well mi x e below the m e al time me t n ; Single n ning Title; P (PCR) is wi 5 9-469 0 (http://www. S r p.org/journal /j P CR r e r ik M. Bocz k n apolis, Indian a r sity Nashville, s ity Medical C e d 2 March 201 0 m ea- p ula- me- C R) h old h ave a set s pan The s tan- e va- ly sis c ient a tis- c ross n tra- t ions We h to ndi- i cate o und a nsi- the p ro- p oint x in g m is- t hod P CR; dely us e cal mo [4- 6 p r o to u to s p r o fac t p e r mu a m I em e cro am p co n da n clo am p kn o tha t the cat e co s to u p e n T in t nu m the lo w 1 ini t tu d 2 b et w 3 ini t S ciRP.org/journ a /j bise e liabilit y k o3* a , USA; Nashville, US A e nte r Nashville , 0 . e d for quantit a and research dified foods, v 6 ]. In a real ti m o cess is recor d u se the ampli f s olve the inve o xy for the a m t ory solution r ed by the a m ltivariate nat u m odel that acc o I n its stead, t h e rged [12]. T ssing thresho p lification c u n ditions diver g n ce with this s e to the det e p lification er r o wn result fr o t averaging o v number of r e e s appears ty p s t, time, effor t u nderstand t h n dence on init i T he goal of t h t he distributi o m ber of identi initial temp l w ing: 1 ) Are meas u t ial template c d e? 2 ) How man y w een differe n 3 ) How does t ial template c a l/jbise / ). y throu A ; , Nashville, US a tive analysis areas includi n v accine effic a m e PCR reac t d ed. The goal o f ication time s rse problem o m ount of initi a of this inver s m plification o u re of the enz y o unts for the v h e ad-hoc cro s T he heuristic b ld is predica t u rves from i d g e dramatica l observation a e ction thresho r or. But vari a o m the statis t v er replicates e plicates. In p p ical. Since t t , and accura c h e requireme n i al template c o h is study was o n of Ct val u cally prepare d l ate concentr a u res of centr a c oncentration y replicates a r n t initial temp l the number o c oncentration ? gh r ep l A. [1-3] in a v a ng the study o a cy, and in sy s t ion the DNA o f a quantitat i s eries data, o f determinin g a l template, s e p roblem h a f error, dilut i y me system a n v ariability [1, 7 s sing point, C b ehind the se l t ed on the ob d entically pr e l ly with iterat i a threshold v a ld to limit v a a bility remain s t ics of Subse c reduces varia n p ractice, fro m t here is a bal a c y it is of pr a n t for replicat e oncentration. to examine t u es generated d replicates a s a tion to deter m a l tendency i n over 10 ord e r e required t o l ate concentr a o f replicates d ? JBiS E l icates a riety of clini - o f geneticall y s tems biolog y ampli ficatio n i ve analysis i s g a reasonabl e 0. A satis - a s been ham - i on error, th e n d the lack o f 7 -11]. C t, method ha s l ection of th e s ervation tha t e pared initia l i on. In accor - a lue is chose n a riability fro m s . It is a wel l c tion 4.8 [13 ] n ce in ratio t o m 1 to 5 repli - a nce betwee n a ctical interes t e s and its de - t he variabilit y from a larg e s a function o f m ine the fol - n formative o f e rs of magni - o discriminat e a tions? d epend on th e E - y y n s , e - - e f s e t l - n m l ] o - n t - y e f - f - e e  460 C. C. Stowers et al. / J. Biomedical Science and Engineering 3 (2010) 459-469 Copyright © 2010 SciRes. JBiSE Using a multiwell plate format we measured hundreds of replicates to produce Ct value distributions. Using standard and novel statistical techniques we analyze the Ct value distributions and demonstrate that the sample mean and/or median Ct values are statistically signifi- cantly distinguishable over ten orders of magnitude. Furthermore, we show that the sample mean Ct values are reliably ordered according to the initial concentration of template. In other words, if x and y are initial template concentrations with x < y and µx and µy are the corres- ponding sample mean Ct values then µx > µy. The order reverses because less initial template requires more cycles of PCR to amplify. We utilize ordering as a con- venient and natural device to quantify the role of repli- cates on reliability. We ask and answer the following question: Given an unlabeled dilution series how many replicates are required to reliably order the tubes? We find that the answer depends on the range of initial tem- plate. A focus of this work was to cover as broad a range of initial conditions as possible with the same experimental format. We observed that the mean and/or median Ct values had the smallest variance above 104 initial copies. Most published standard curves focus on this range [2]. Few studies have analyzed issues of variability and ro- bustness below this range. We show that below 104 ini- tial copies the probability of misclassification of the ini- tial template concentration given a Ct value grows ra- pidly and saturates near a half. The dispersion in the Ct value distributions and the rise in misclassification cor- relate with an independent measure of the thermal wear of the TAQ polymerase enzyme. Driven by the observed broadening of the Ct value distributions below a thousand initial copies, and in- spired by elegant methods that sidestep the issues created by the dynamics of exponential growth [14-18], we examined a format for single molecule detection uti- lizing an endpoint analysis and the statistical properties of well mixing and plate filling. We present data that such an assay is accurate where the real time method becomes unreliable. 2. MATERIALS AND METHODS 2.1. PCR Rt-PCR results were generated using linearized double stranded EC3 plasmid DNA containing the ybdO gene. The plasmid was linearized by digestion with the restric- tion enzyme BamH1 prior to PCR. The following primer sequences were used. 1) Forward: 5’-AAT TAT TCT AAA ACC AGC GTG TC-3’ 2) Reverse: 5’-TTT GGG ATT GAA TCA CTG TTT C-3’ The PCR supermix was prepared as described in [19], with the exception that we used Qiagen HotStarTaq Cat # 203203, Roche dNTPs Cat# 13583000, DMSO Sigma # D8418 at 2%, and Sybr Green (Sigma # 86205) at 5-times the recommended concentration. Primers were used at a concentration of 1 µM. All samples were run on the 384 well plate platform using an Applied Biosys- tems 7900HT thermocycler and the SDS 2.3 software. The Ct value threshold was set at 5.0 RFU (Relative Fluorescence Units) for all samples. The DNA concen- trations of concentrated stocks were measured using a Nano-Drop 100 spectrophotometer prior to use. Subse- quent dilutions were performed using sterile, nuclease free water from Ambion # AM9937. The following thermo-cycling program was used. 1) 2 min at 50°C Initial Warmup Phase; 2) 15 min at 95°C Initial TAQ Activation Step; 3) 1 min at 95°C DNA Denaturation; 4) 1 min at 50°C Primer Annealing; 5) 1 min at 72°C DNA Extension; 6) 0.25 min at 80°C Fluorescence Measurement; 7) Repeat Steps 3-6 forty times. 2.2. Preparation of Identical Replicates To ensure uniformity in the face of pipetting error the PCR supermix was prepared in well-mixed batches in a 14-mL conical tube. Each sample consisted of 184 rep- licates and 8 negative controls, requiring exactly half of a 384 well plate. All of the components except for DNA were loaded into a 14 mL conical tube in the following order: 800 µL PCR buffer, 5.6 mL of nuclease free water, 160 µL DMSO, 320 µL MgCl2 (Qiagen Cat # 124113012), 160 µL of a primer mix (a 1:1 mix of the forward and reverse primer stored at a concentration of 50 M each), 160 µL Sybr Green (100X stored in DMSO), 160 µL of dNTPs, and lastly 80 µL of Taq polymerase. We have noticed that the order at which these are added affects the reproducibility of the assay. The mixture was vortexed at high speed for 1 minute. 335 µL of supermix was then removed to be used as a negative control and placed into a 1 mL eppendorf tube and 25 µL of water was added. This mixture was then briefly vortexed to ensure well mixing. The remaining 7.105 mL of super- mix was then split equally four ways into 2 mL cryostat tubes, and 134 µL of water plus the amount of desired DNA was added to each cryostat tube. Each tube was then briefly vortexed. For each reaction contained within a single well of the plate, 10 µL of the respective reac- tion mix was loaded into a well of the 384 well plates. 2.3. TAQ Polymerase Pre-Wear Assay The PCR supermix was prepared as described above, but without template DNA. Steps 1 and 2 of the PCR process were executed following which samples were pre-worn by thermocycling the supermix as described in steps 3 through 6 above. Samples were pre-worn from 5 to 40 cycles. 108 copies of initial template DNA were  C. C. Stowers et al. / J. Biomedical Science and Engineering 3 (2010) 459-4 461 Copyright © 2010 SciRes. JBiSE added to the preworn enzyme with subsequent resump- tion of cycling. An efficiency was calculated by averag- ing the derivative over the resultant amplification curve. 2.4. Statistical Analysis of Ct Distributions The sample mean Ct values for each initial template con- centration were compared pairwise using a permutation test that is asymptotically valid and robust in situations where the distributions are not necessarily normal and/or the ratio of the variances is unknown, indicating that a t-test is not supported [20,21]. The test statistic T [20], measures the difference in mean rank of the samples within their union, scaled by a consistent estimator of their variance. Because the Ct value distributions may be skewed by outliers, we also considered the median as a measure of central tendency. The median Ct values were compared pair-wise using a bootstrap test that has been shown to outperform all reasonable alternative methods [22]. Given a linear regression, bmxy , of the mean/ median Ct values against x = log(n), the log of the num- ber of initial copies of template, a relative error was cal- culated from the quantiles of the Ct value distributions as follows. Allow x h Q and x l Q to be high and low quan- tile values chosen from the Ct value distribution gener- ated by initial log template x. Since the Ct value gener- ally increases with decreasing amount of initial template the slope m of the regression line(s) is negative. Thus, the difference in the predicted amount of initial template DNA from the distributions divided by the input amount is given as: x mbQmbQ x h x l n n 10 1010 )()( (1) Let U represent the universe of possible Ct values, and let T stand for the collection of possible initial template concentrations. The initial template concentrations are thought of as the class labels. We consider the probabil- ity of misclassifying an observed Ct value given a known class label. Suppose that we draw a Ct value from a giv- en class, how likely is it to find that value in any of the other classes? The mean misclassification probability is estimated from the Ct value distributions corresponding to different initial template concentrations according to the following formula. Ui x\T|iPx|iPxP )()()( (2) where )|( xiP is the conditional probability of finding the Ct value i, given the initial template concentration x, and the )\|( xTiP is the conditional probability of observing that same value given any initial template concentration other than x . The later conditional prob- ability is interpreted as the probability of misclassi- fication. The conditional probabilities are estimated from the measured Ct value frequency distributions. 2.5. Plate Filling with Microbeads Experiments were performed using 20µm latex beads from Beckman Coulter (#PN6602798) using flat bottom 96 well plates from Becton Dickinson Labware. 96 well plates were used in place of 384 well plates for ease of microscopic analysis. Various dilutions of beads were prepared using a Beckman Multisizer Coulter Counter 2. 25 µL of each dilution was loaded into each well of the 96 well plate. The number of beads in each well was counted with a Nikon TE-2000 microscope. 2.6. Plate Filling Simulations The statistics of the plate filling stochastic process were modeled using Monte-Carlo simulation. For instance, the expected number of empty wells in a 96 well plate was estimated by simulation using the following function: Table[Mean[ Table[Length[ Complement[Range[96], RandomInteger[Range[96], m]]], {10000}]], {m, 1, 600}] Here m is the number of molecules being plated from a well mixed solution. The mean is estimated from 10,000 realizations. The standard deviation is computed by replacing the function Mean by Standard Deviation. A graph of these functions is shown in Figure 9. All simulations and analysis were carried out in Mathemati- ca 6.03 (Wolfram Research), and the notebooks are available upon request. 3. RESULTS The Ct value data are summarized in Figure 1. The fig- ure shows that above 104 copies the data are distributed about the median with smaller variance than those below. Outliers exist across all the data, mostly trending upward of the median, indicative of reactions lagging behind the pack. The data show the distributions as collected across ten orders of magnitude in initial template. 3.1. Mean and Median Ct values While the Ct value distributions below 104 copies of ini- tial template DNA are broad and noisy, the sample means and medians form a monotone increasing series when stratified according to initial template. These data are shown in Table 1. The means and medians are very nearly equal in all cases and the data distributions appear unimodal. At initial template concentrations larger than 104 ini- tial copies the data distributions seen in Figure 1 appear  462 Copyright © F o r d to identify d no hypothes i template co n not within a another. W h count the m e a level of si g ception of t h cally differe n result of the in Table 2. The Ct v a b ecause we riances, stan © 2010 Sci Table 1. Sam p O b serve that t h Distribution N L og Copies T Replicates Mean C t Val u Median C t V a F igure 1. Sum m o f DNA ampli f r un at each init i d ots. Outliers a r istinguishabl e i s test appear s n centrations it a fraction o f h en all of the e ans and med i g nificance gr e h e smallest t w n t at the 3/1 0 significance t a lue distribut i do not a pri dard hypothe C. C. Stower s Res. p le mean and m h e sample mea n N umbe r T emplate u e a lue m ary of the C t f ied. As descri b i al condition. T r e defined as p o e mean and m s necessary. H is not clear t h f a standard data points a i ans are statis t e ater than 1/2 0 w o medians t 0 00 level of t est for the m i ons may no ori know th e sis tests to c o s et al. / J. Bi o m edian C t value s n s and medians 1 2 9.0 8.0 184 182 6.6 10. 6 6.6 10. 4 value data, str a b ed in the mate r T he box covers t o ints beyond 3 / m edian values H owever at l o h at the mean s deviation of a re taken int o t ically differe n 0 000 with th e t hat were sta t significance. m eans is displ a t be normal e ratio of the o mpare mean s o medical Scie n s . The correspo n form an order e 3 4 7.3 6.3 183 183 6 12.8 15. 6 4 12.8 15. 7 a tified as a fun c r ials and meth o t wo quartiles a b / 2 the discrete i n and o wer s are one o ac- n t at e ex- t is t i- The a yed and va- s are no t b e e ha v co n dis t de c up p fo u va r ex p tri b lar g im a cri m n ce and Engi n n ding distribut i e d sequence str a 5 6 5.7 4.1 184 183 6 19.5 25.5 7 19.3 25.5 c tion of the lo g o ds section, a m b out the media n n terquantile ra n t justified. S e n proposed f v e shown to n tains the T - t ributions. T h c lining as te m p er boundary u rth and fifth r iance estima t p lains the lar g b utions conta i g er variance s a tely 184 rep m ination ove r n eering 3 (20 1 i ons are shown a tified by initi a 789 3.1 2.11. 9 184 17973 0 27.6 28.8 30. 28.1 28.7 30. g of the initial n m inimum of 17 5 n with outliers n ge from the e d S everal non- p f or this com m have power. - statistic co m h e values of t h m plate decrea s of the null distribution s t or takes its g e T value. A l i n some ove r s . The data i n licates the C r nine orders 1 0) 459-469 in Figure 1. a l template. 10 11 9 1.1 0.3 0 175 178 7 35.5 36.4 7 35.0 35.7 n umber of copi e 5 replicates we r shown as the r e d ge of the box. p arametric m m on situatio n The last ro w m paring tem p h e T-statistic s es and come distribution. s are non-ov e minimum v a l l of the othe r r lap and hen c n dicate that C t method ca n of magnitud e JBiS E e s r e e d m ethods hav e n [20,21] an d w of Table 2 p late-adjacen t are generall y closer to th e Because th e e rlapping th e a lue and thi s r pairs of dis - c e have muc h with approx - n provide dis - e . One goal o f E e d 2 t y e e e s - h - - f  Copyright our work, t o analysis of h make the sa m 3.2. Stand a A linear re g initial copie s The regress i over the enti r contrast, Fi g described b y contains at l also be see n gression line In an ind e and supermi experiences C. C. St o © 2010 Sci o be describ e h ow few rep l m e claim. a rd Curves g ression of t h s of DNA te m i on line capt u r e range of i n g ure 1 gives t h y a function t l east two sig m n in the oscill a in Figure 2. e pendent exp e x, we exami n as a functio n Table 2. applied p treme va l with the T Table 1. applied t o side of t h thesis is r e Propert y Min Max T Figure 2. sion line i on the in d tributions . o wers et al. / Res. e d below, is l icates are re q h e mean Ct v m plate is sh o u res the dat a n itial template h e impressio n t hat is initiall y m oid like tra n a tion of the d e riment with t n ed the wear n of thermoc y Results of tes t airwise to C t v l ues of the dist T -statistic for a In each test, t h o the pooled d a h e range indica t e jected with co y 2v1 3 v -5.02 -3 3.93 4 . 684.33 3 9 Linear regres s i s shown in re d d ividual data p o . / J. Biomedi c to provide s o q uired to reli a alues against o wn in Fi g u r a reasonably w concentratio n n that the dat a y linear and t n sitions. This d ata about th e t he same enz y that the enz y y cling alone. t ing the null h y v alue distributi o ribution of the a djacent distri b h e null distribu t a ta as describe d t ing that the p- v nfidence. v 2 4v3 .85 -4.63 . 17 3.87 9 .61 51.45 2 s ion of the me a d along with a 9 o ints reflect o n c al Science a o me a bly log r e 2. w ell n . In a are t hen can e r e- y me y me The mi d of a we a wh e in d tra n gre G me a fro m eq u an d in F p r o sh a as tra n y pothesis of st o o ns adjacent i n T-statistic un d b utions. The di s t ion was simu l d in [20]. In ea c v alue is less t h 5v4 6v5 -4.25 -4.06 3.74 4.13 2 3809.7 91.0 a n C t values wi 9 5% confidenc e n e standard de v a nd Enginee r d dle of the tr a a pproximatel y a r transition c e re the distri b d ependent obs e n sition point ssion. The d a t G iven a regre a sure of the m the spread u ation fo r n, a d third quartil e F i g ure 5. Th e o ximately 20 % a rply below. T the red line, n sition region , o chastic equali t n initial templa t d er the null hy p s tributions, e.g . l ated using 20, 0 c h test the calc h an 1/20000. I n 7v6 8v7 -4.10 -3.94 5.03 4.77 24.27 7.29 t h log initial c o e interval in da iation comput e r ing 3 (2010 ) a nsition regio n y 25. As see n c orresponds t o b utions begin t e rvation, we s and conside r t a are summa r ssion model o relative erro r in the Ct va l a s described i n e s were used e data show t h % above 10 4 T he piecewis e produces a l , and agrees e t y. A hypothes t e concentratio n p othesis are s h . “2v1”, are la b 0 00 random p e ulated T-statis t n each case the 9v8 10v 9 -4.62 -4.5 0 4.87 3.73 18.37 81.7 o py number. T h shed line. The e d from the C t v ) 459-4 n correspond s n in Fi g ure 1 o the region n e t o broaden. B s plit the data r ed a piecew r ized in Fi g u r o f the data w r of the inve r l ue distributi o n Subsection to produce t h h at the relati v 4 initial copi e linear regr e l arger relativ e lsewhere. is test was n. The ex- h own along b ele d as in e rmutations t ic fell out- null hypo- 9 11v10 0 -3.57 3.74 4.22 h e regres- error bars v alue dis- 46 3 JBiS E s to a Ct valu e 1 , the therma l e ar 104 copie s ecause of thi s in two at thi s ise linear r e - r e 4. e computed a r sion process , o ns, using th e 2.4. The firs t h e data show n v e error is a p- e s, and rise s e ssion, show n e error in th e 3 E e l s s s - a , e t n - s n e 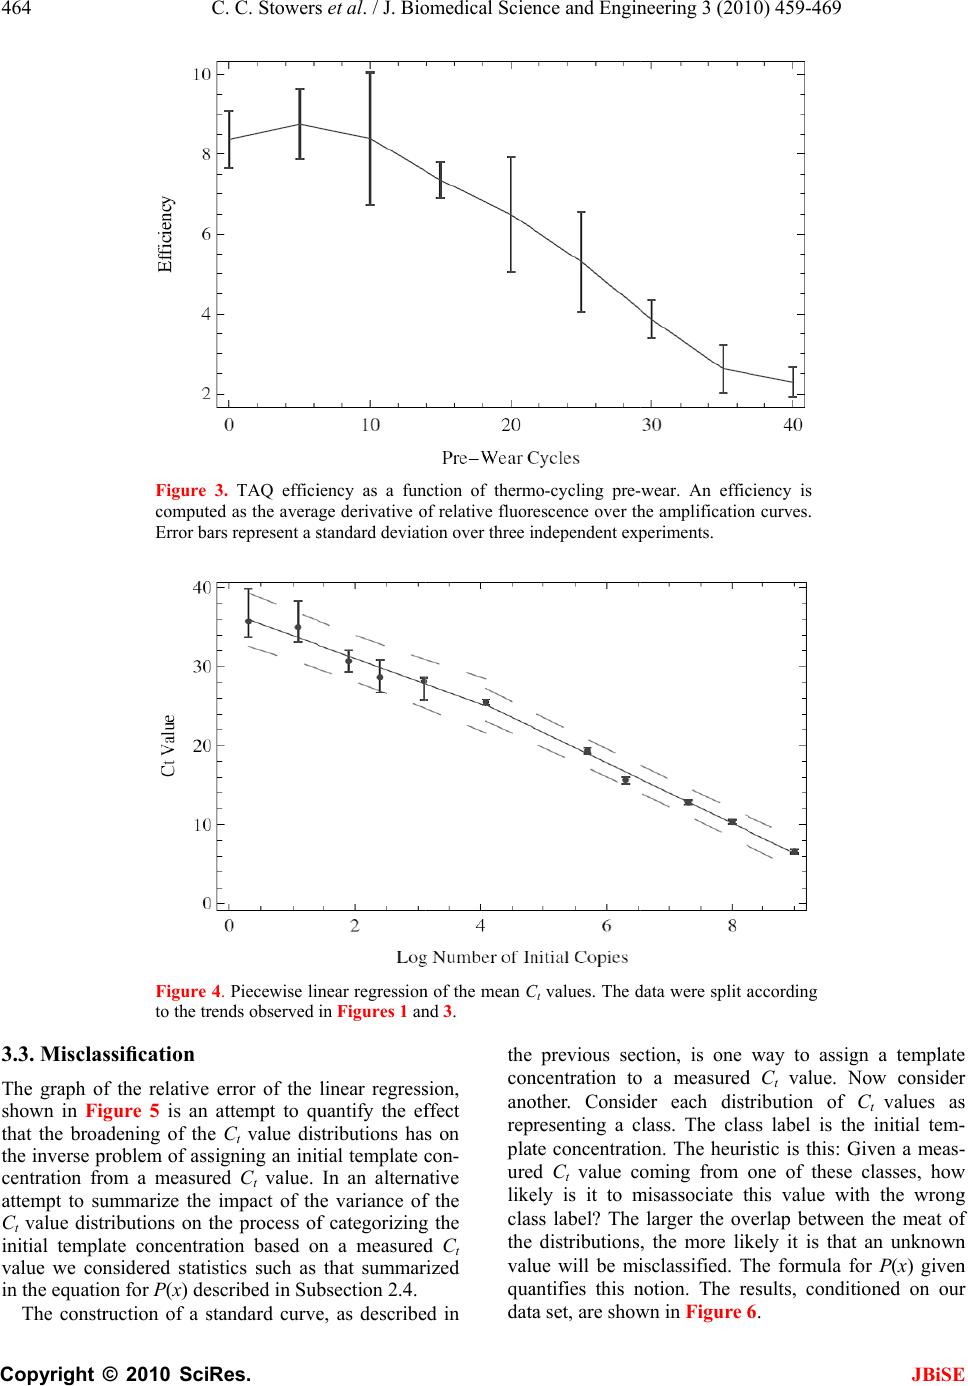 464 Copyright © 3.3. Miscla The graph o shown in Fi that the bro a the inverse p centration f r attempt to s u Ct value dis t initial templ value we co n in the equati o The const r © 2010 Sci Figure comput e Error b a Figure to the t r ssification f the relative g ure 5 is an a dening of th e p roblem of as s r om a measu r u mmarize the t ributions on t ate concentr a n sidered stat i o n for P(x) d e r uction of a s C. C. Stower s Res. 3. TAQ effic i e d as the aver a a rs represent a s 4. Piecewise li n r ends observed error of the attempt to q u e Ct value di s s igning an ini t r ed Ct value. impact of t h t he process o f a tion based o i stics such as e scribed in Su b s tandard curv e s et al. / J. Bi o i ency as a fu n a ge derivative o s tandard deviat i n ear regressio n in Figures 1 a n linear regres s u antify the e f s tributions ha s t ial template c In an altern a h e variance o f f categorizin g o n a measure d that summa r b section 2.4. e , as describ e o medical Scie n n ction of ther m o f relative fluo r i on over three i n of the mean C nd 3. s ion, f fect s on c on- a tive f the g the d Ct r ized e d in the co n an o rep p la t ure lik e cla s the val u qu a dat a n ce and Engi n m o-cycling pre- escence over t h i ndependent ex p C t values. The d previous se c n centration t o o ther. Consi d resenting a c t e concentrat i d Ct value c o e ly is it to m s s label? The distributions u e will be m i a ntifies this n a set, are sho w n eering 3 (20 1 wear. An effi c h e amplificatio n p eriments. d ata were split a c tion, is one o a measure d d er each dis t lass. The cla i on. The heur i o ming from m isassociate t larger the o v , the mo r e li k i sclassified. T n otion. The r e w n in Fi g ure 6 1 0) 459-469 c iency is n curves. a ccording way to assi g d Ct value. N t ribution of ss label is t h i stic is this: G one of these t his value wi t v erlap betwee n k ely it is tha t T he formula f e sults, condi t 6 . JBiS E g n a templat e N ow conside r Ct values a s h e initial tem - G iven a meas - classes, ho w t h the wron g n the meat o f t an unknow n f or P(x) give n t ioned on ou r E e r s - - w g f n n r  Copyright The analy s results sho w p robability o Over a narr o concentratio n quently, at l o less saturat e C. C. St o © 2010 Sci Figure and th e ues co r whose l given i n Figure Subsec t Hill's f u p roxim a s is indicates, a w n in Fi g ure o f misclassifi c o w range spa n n the probab i o wer concent r e s at the va l o wers et al. / Res. 5. Relative er r e standard curv e r responding to l imits were cal n Subsection 2. 6. Misclassific a t ion 2.4 and co n u nction is sho w a tely 2950 copi a s is clearly c 1, that abo v c ation are sm a n ning the ne x i lity rises to r ations, the p r l ue of one h / J. Biomedi c r or of the PCR e s shown in Fi g the first and t culated using t h 4. a tion frequenc y n ditioned upon w n as the das h es of initial te m orrelated wit h v e 105 copies a ll, less than x t two decad e one half. S u r obability mo r h alf and eq u c al Science a process as cal c g ures 2 and 4, B t hird quartile w h e regression l i y calculated ac c the C t value di s h ed line. The m m plate DNA. h the the 0.1. e s of u bse- r e or u ates cla s the cla s Hil tha t cu r ca n a nd Enginee r c ulated from t h B lue and Red r w ere used to c a i ne(s), accordi n c ording to the d s tributions sho w m idpoint of th e s sification to flip is interp r s s or out, in l’s function, s t the midpoi n r s at 103.47 ≈ 2 n be seen in F r ing 3 (2010 ) h e C t value dist r espectively. T h a lculate a ∆D N n g to the defin i d efinition of P( x w n in Figure 1 . e transition oc c coin flippin g r eted as the c h a one versus s hown as the n t of the mis c 2 950 initial c o F i g ure 2, the ) 459-4 t ributions h e C t val- N A value i tion of n x ) given in . A best fit c urs at ap- g . The two si d hance of bei n all sense. F r dotted curve, c lassification o pies of temp l ordered pair 46 5 JBiS E d ed nature o f n g in the righ t r om a bes t -fi t it is deduce d transition oc - l ate DNA. A s (3.47,25) lie s 5 E f t t d - s s  466 Copyright © close to the stripe, indic a error, miscla s 3.4. Rank O In the first s sample mea n data are sta t This was the p late conce n stand how fe w In this se c Suppose that in a set of tu b a correctly c a taining the scrambled a s that the amo u series. The q PCR runs ar e Ct values co r given level o is one level o closely relat e Condition e Monte-Carlo we draw k r their sample k-replicates. T numerical v a class labels, x fraction of p o sample mea n of k. The res u © 2010 Sci regression l i a ting the con s sification an d O rdering w i s ection we su m n and median C t istically dist i case using a l n tration. Doub w data are re q c tion we ima g an investigat o b es, with no e r a librated pipet t dilution seri e s to order, bu t u nt of DNA w q uestion is to e required suc h r rectly order, a o f confidence? o f quantitatio n e d pre-requisit e e d on our data simulation. F r eplicates uni f mean . T h T he resulting s a lues and if th i x , we score th i o sitive draws t n s, from a tota u lts are shown Figure 7. rank orde r C. C. Stower s Res. i ne and well cordance bet w d pre-wear da t i th Replicat e m marized the C t values co mp i nguishable a n l l 184 replica t tless it is of q uired to mak e g ine the foll o o r has produc e r ror other tha n t eman. Howe v e s are unlab e t not contents. w ithin the tube s determine h o h that the resu l a nd hence lab e We imagine n removed fro m e . we can answ e F rom each Ct f ormly at ran d h is mimics a n s et are sorte d i s order agree s i s trial positiv e t hat resulted i n l of 20,000 d r in Figures 7 a Reliability of r r ing the initial t s et al. / J. Bi o within the e w een the rel a t a. e s findings tha t mp uted from al l n d rank ord e t es per initial t interest to u n e this same cla i o wing experi m e d a serial dil u n that coming f v er, the tubes c e led and bec It is unequi v s form a mon o o w many repl i l tant sample m e l, the tubes w i that rank ord e m inversion, b e r this questio n value distrib u d om and co m n experiment w d according to t s with that of t e . We comput e n correctly or d r aws at each v a n d 8. r eplicates give n t emplate conce n o medical Scie n e rror a tive t the l the e red. t em- n der- i m. m ent. u tion f rom c on- ome v ocal o tone i cate m ean i th a e ring b ut a n by u tion m pute w ith t heir t heir e the d ered v alue F or d co p ou r ac c wh e in d 90 % ur e wi t vio 3. 5 In t var i 10 0 dar d b y mo sep co n an d we rev e S mi x mu the tio n the tiv e as t F n the task of ra n n trations with x n ce and Engi n F i g ure 7 sho w d er the highe s p ies with gre a r data. The us e c uracy. The i n e n all the d a d icate that 35 o % accuracy o v e 8 shows tha t h smaller ini t r of the samp l 5 . End Point t he previous s i ance that sh o 0 initial copie s d curves or c l erro r . As an a l ecule detecti o arated the an a n sider the pro c d experiment a show that th e e als the patter n S uppose, as b x ed, aliquots ltiwell plate a total number n limitation o f expected nu m e statistic tha t t he total num b F i g ure 9 sh o n k ordering a di l x ≥ 10 4 . n eering 3 (20 1 w s that indiv s t concentrati o a ter than 90 % e of 8 or mor e n set to Fi g ur e a ta are consi d o r more repli c v er the entir e t the larger v a t ial template i l e over the en t Detection s ections we h o ws that belo w s of template D l assification v i a lternative we o n utilizing an a lysis into tw o c ess of plate fi a re in good a g e process of a m n of plate filli n b efore, that w of a DNA s o a nd perform 4 of wells that f the machine . m ber of unam p t has the pro p b er of molecu l o ws the exce l ution series. T h 1 0) 459-469 idual data p o o ns from 104 % accuracy c o e replicates g u e 8 shows th e d ered togethe r c ates are requ i e concentrati o a riance of th e i s responsible t ire range. h ave detailed a w 104 and c e D NA, quantit a i a a Ct value i describe a fo r endpoint ana l o parts. In th e fi lling. We sh o g reement. In t h m plification b y n g. w e pipette i d o lution into t h 4 0 cycles of P C amplified ab o . Our data de m p lified wells i p erty that its e l es of DNA d e llent congru e h e results for JBiS E o ints can ran k to 109 initia l o nditioned o n u arantees 99 % e performanc e r . These dat a i red to excee d o n range. Fi g- e distribution s for the beha - a n analysis o f e rtainly belo w a tion via stan - i s confounde d r mat for singl e l ysis. We hav e e first part w e o w that theor y h e second par t y PCR simpl y d entical, wel l h e wells of a C R and coun t o ve the detec - m onstrate tha t i s an infor m a - e rror decline s e clines [23]. e nce betwee n E k l n % e a d - s - f w - d e e e y t y l a t - t - s n  Copyright theory and e solutions of methods. Ut i DNA from t h ical bead co u endpoint an a p endent exp e for PCR we r C. C. St o © 2010 Sci Figure results results Figur e p ected b uted a from t h dotted e xperiment fo r 20 micron l a i lizing PCR t o h ose that are n u nting. Fi g ur e a lysis. Each d e riment. The r e determine d o wers et al. / Res. 8. Reliability for rank order i over the entire e 9. Agreemen t number of e m a mong the wel l h eory is show n green line. Ex p r filling of 9 6 a tex beads as o discriminat e n ot, is more c e 10 describe s d ata point re p concentratio n d through dil u / J. Biomedi c of replicates g i ng the initial t range of initial t between expe r m pty wells is s h l s of a 96-well p n as the solid b p erimental data 6 -well plates w described i n e wells filled w c omplex than s the results o p resents an i n n s of DNA p l u tion as descr i c al Science a iven the task o t emplate distri b template DN A r imental and t h h own as a func t p late. The expe lue line, while are shown in r e w ith n the w ith opt- o f an n de- l ated i bed in m are re m the 4. C Wi t va r a nd Enginee r o f rank orderin g b utions with x A , see Table 1. h eoretical plate t ion of the tota cted number o f one standard d e d. m ethods. W h uniformly s c m arkably well plate filling c C ONCLU S t h a sensitive r iability of re r ing 3 (2010 ) g a dilution se r < 10 4 . Inset s h filling statisti c l number of b e f unfilled wells d eviation is sh o h en these put c aled by a f a with the the o c urve. S IONS PCR plate re a al time PCR ) 459-4 r ies. The h ows the c s. The ex- e ads dist r i- calculated o wn as the ative DNA c a ctor of 2.4 t h o ry over the e n a der we have process. W e 46 7 JBiS E c oncentration s h e data agre e n tire length o f examined th e e have show n 7 E s e f e n  468 Copyright © that using l e template co n are statistica p onding wit h have shown gressed over The Ct v a copies of in independent tion. Indepe n enzyme exp e in the corres p Given a s t used to qua n values on t h concentratio n over the hig ing near 20 % fication anal y to high. The p erhaps mor ror analysis fication ana approach to ing a standa r template co n cation into o We are curr e A questio n tribution dat a of replicates riance of th © 2010 Sci Figure cules s p theory i n e ss than a fe w n centration e n lly dis t inguis h h the initial a that the m e ten orders of a lue distribut i itial template statistical te c n dent data o n e riences a tra n p onding regi o t andard curve , n tify the imp a h e process of n . The relativ e hest initial t e % . Both the r e y sis capture t h misclassifica t e intuitive to perhaps mo r lysis sugges t solving the i n r d curve to c o n centration w e ne of a discr e e ntly explorin g n central to t h a concerns t h stems from t e distributio n C. C. Stower s Res. 10. The numb e p read over a 3 8 n blue. The re d w hundred re p n sures that th e h able and ra n a mount of te m e an/median v a magnitude. i ons appear DNA and t h c hniques con f n TAQ-wear n sition of dec r o n. , the Ct value d a ct of the va r predicting t h e error varies e mplate conc e e lative error a h e transition f t ion frequenc y interpret whi r e quantitativ e t s an altern a n verse proble o nvert a Ct v a e consider pro e te number o f g this idea. h e analysis o f h e role of rep l t he statistical n of sample m s et al. / J. Bi o e r of unamplif i 8 4 well plate. T d dots represent p licates per i n e mean Ct v a n k ordered co r m plate DNA. a lues can b e noisy below h e results of f irm this obs e indicate tha t r easing effici e d istributions w r iability of t h h e initial tem p from 7% to 5 e ntrations av e a nd the miscl a f rom low vari a y is smoother le the relativ e e . The miscl a a tive clasific a m. Instead o f a lue into an i n babilistic cla s f template cla s f the Ct value l icates. The v fact that the m eans is sm a o medical Scie n i ed wells as a f T he expected n u experimental P n itial a lues r res- We e r e- 104 two e rva- t the e ncy w ere h e Ct p late 5 0% e rag- a ssi- a nce and e er- a ssi- a tion f us- n itial s sifi- s ses. dis- v alue va- a ller tha n ca n cat e cib i nie n Ra n nu m ini t dat a 35 reg dis h lic a sc a tra t me t we l T de m tio n ti m D N Ho w hu n qu a alt e co u an a W lec u ha v tha n ce and Engi n f unction of the u mber of emp t P CR endpoint d n the varianc e n the data dis t e s are require i lity? Rank o r n t and meani n n k ordering s i m ber of repli c t ial template. a points prov i or more repl i ion for the sa m h eartening re s a tes are requi r rce. For sam p t ions it may b t hod using t h l ls than to co n T hese data, a n m onstrated th a n with statisti c m e PCR capa b N A samples r a w ever the da t n dreds of initi a ntitation. W e e rnative met h u nting. In thi s a lysis shows s i W e have des u le counting v e demonstra t t the expect e n eering 3 (20 1 number of D N t y wells calcul a d ata. e of the data d t ributions tea d in practice f r dering of th e n gful device f i mulations wi t c ates require d Below the t r i de better tha n i cates are sug g m e degree of s ult for the f o r ed precisely p les with sm a e more accur a h e expected n n sider replicat n d the work a t the use of c al replicates b le of quant i a nging from u t a presented a al copies real e and other g r h ods for sing l s regard, a p i gnificant pro m cribed a dec o into plate fill t ed through s e d number o f 1 0) 459-469 N A mole- a ted from d istributions. a ch about ho w f or resolutio n e sample mea n f or exploring t h our data s u d depends on r ansition regi n 90% rank a c g ested below rank accurac y o llowing reas o where the s a a ll initial te mp a te to consid e n umber of ( u es. of other gro u the Ct metho renders the p itative analy s u pwards of 1 a bove show t h time PCR is r oups have b e l e molecule d p rocess invol v m ise. o mposition o ing and amp l s imulation an f (un)amplifi e JBiS E What lesson s w many repli - n and reprodu - n s is a conve - this question . u ggest that th e the range o f on individua l c curacy, whil e the transitio n y . But this is a o n: More re p- a mple may b e p late concen - e r an endpoin t u n) amplifie d u ps [24] hav e d in conjunc - p rocess of rea l s is for initia l 04 molecules . h at for tens t o unreliable fo r e en explorin g d etection an d v ing endpoin t o f single mo - l ification. W e d experimen t e d wells is a E s - - - . e f l e n a - e - t d e - l l . o r g d t - e t a  C. C. Stowers et al. / J. Biomedical Science and Engineering 3 (2010) 459-4 469 Copyright © 2010 SciRes. JBiSE robust statistic on which to base an inverse problem or a rigorous hypothesis test to count small numbers of single molecules. The observed linear scaling between expected and perceived DNA concentration indicates that amplification by PCR is directly related to plate filling. It remains an open problem to determine the condi- tional probability with which PCR can amplify above threshold in 40 cycles from a single strand of DNA. While it is currently impossible to enumerate individ- ual molecules or particles smaller than a nanometer, it is straightforward to count macroscopic objects such as latex beads or single yeast cells with a Coulter counter. Haploid yeast cells provide a convenient and verifiable means to deliver single copies of Bacillus subtilis genes such as ybdO into the wells of a multi- well PCR plate. In this way, we are currently exploring the relation- ship between amplification and DNA copy number. 5. ACKNOWLEDGEMENTS This work was partially supported through NSF-DMS 0443855, NSF ECS 0601528, NIH EB009235, and the short-lived W. M. Keck Foun- dation Grant#062014. REFERENCES [1] Freeman, W., Walker, S. and Vrana, K. (1999) Quantita- tive rt-PCR: Pitfalls and potential. Biotechniques, 26, 124-125. [2] Larionov, A., Krause, A. and Miller, W. (2005) A stan- dard curve based method for relative real time PCR data processing. BMC Bioinformatics, 6, 62. [3] Yuan, J., Reed, A., Chen, F. and Stewart, C. (2006) Sta- tistical analysis of real-time PCR data. BMC Bioinfor- matics, 7, 85. [4] Abramov, D., Trofimov, D. and Rebrikov, D. (2006) Accuracy of a real-time polymerase chain-reaction assay for quantitative estimation of genetically modified food sources in food products. Applied Biochemistry and Mi- crobiology, 42, 485-488. [5] Diehl, F., Li, M., Dressman, D., Yiping, H., Shen, D., Szabo, S., Diaz, L., Goodman, S., David, K., Juhl, H., Kinzler, K. and Vogelstein, B. (2005) Detection and quantification of mutations in the plasma of patients with colorectal tumors. Proceedings of the National Academy of Sciences, 102, 16368-16373. [6] Roussel, Y., Harris, A., Lee, M. and Wilks, M. (2007) Novel methods of quantitative real-time PCR data analy- sis in murine HelicobaCter pylori vaccine model. Vac- cine, 25, 2919-2929. [7] Jagers, P. and Klebaner, K. (2003) Random variation and concentration effects in PCR. Journal of Theoretical Bi- ology, 224, 299-304. [8] Lalam, N., Jacob, C. and Jagers, P. (2004) Modeling the PCR amplification process by a size-dependent branch- ing process and estimation of the efficiency. Advanced Applied Probability, 36, 602-615. [9] Liu, W. and Saint, D. (2002) A new quantitative method of real time reverse transcription polymerase chain reac- tion assay based on simulation of polymerase chain reac- tion kinetics. Analytical Biochemistry, 302, 52-59. [10] Nedelman, J., Haegerty, P. and Lawrence, C. (1992) Quantitative PCR: Procedures and precision. Bulletin of Mathematical Biology, 54, 477-502. [11] Vaerman, J., Saussoy, P. and Inargiola, I. (2004) Evalua- tion of real-time PCR data. Journal of Biological Regu- lators and Homeostatic Agents. 18, 212-214. [12] Pfaffl, M. (2001) A new mathematical model for relative quantification in real-time PCR. Nucleic Acid Research, 29, e00. [13] DeGroot, M.H. (1986) Probability and statistics. 2nd Edition, Addison Wesley Reading MA, Massachusetts. [14] Cady, N., Stelick, S., Kunnavakkam, M., Lui, Y. and Batt, C. (2004) A microchip-based DNA purification and real-time PCR biosensor for bacterial detection. Pro- ceedings of IEEE Sensors, Vienna, 1191-1194. [15] Matsubara, Y., Kerman, K., Kobayashi, M., Yamamura, S., Morita, Y. and Tamiya, E. (2004) Microchamber assay based DNA quantification and specific sequence detection from a single copy via PCR in nanoliter vo- lumes. Journal of Biosensors and Electronics, 20, 1482-1490. [16] Mitra, R. and Church, G. (1999) In situ localized amplification and contact replication of many individual DNA molecules. Nucleic Acids Research, 27, e34. [17] Samatov, T., Chetverina, H. and Chetverin, A. (2006) Real-time monitoring of DNA colonies growing in a po- lyacrylamide gel. Analytic al Biochemi stry, 356, 300-302. [18] Williams, R., Peisajovish, S., Miller, O., Magdassi, S., Tawfik, D. and Griths, A. (2006) Amplification of com- plex gene libraries by emulsion PCR. Nature Methods, 3, 545-550. [19] Karsai, A., Muller, S., Platz, S. and Hauser, T. (2002) Evaluation of a home-made SYBR Green 1 reaction mixture for real-time PCR quantification of gene expres- sion. Biotechniques-Short Technical Reports, 32, 790- 796. [20] Neubert, K. and Brunner, E. (2007) A studentized per- mutation test for the non-parametric Behrens-Fisher problem. Computational Statistics & Data Analysis, 51, 5192-5204. [21] Reiczigel, J., Zakarias, I. and Rozsa, L. (2005) A boot- strap test of stochastic equality of two populations. American Statistical Association, 59, 156-161. [22] Wilcox, R.R. (2006) Comparing medians. Computational Statistics & Data Analysis, 51, 1934-1943. [23] Stowers, C. and Boczko, E.M. (2008) Platescale: The birthday problem applied to single molecule PCR. Bio- comp’08, Las Vegas. http://www.ucmss.com/cr/main/ papersNew/papersAll/BIC9135.pdf [24] Cook, P., Fu, C., Hickey, M., Han, E. and Miller, K. (2004) SAS programs for real-time RT-PCR having mul- tiple independent samples. Biotechniques, 37, 990-995. |