M. A. PERSINGER 193
laptop (Windows 95) computer ( i.e., total of 1440 samples/
day). Calibration by several methods indicated that 1 unit
of change along the 1 to 100 unit PMT scale is
approximately 5 × 10–11 W/m2 when referenced to the
midrange, i.e., 50 units [5]. The data for the quietist day,
judged by visual inspection of printed daily records, and
for the day when global seismic activity was minimal for
several days before and afterwards was extracted for each
month between July 2009 and June 2010 . Spectral a nal yse s
were completed by SPSS PC-16 software and Plotter for
con- firmation. The relative power for the 3 mHz peak,
tha t r ang ed f rom 0 .2 to 0. 6, w as obt ain ed f or each month.
The power was superimposed over the annual v aria tio n i n
free oscillations and infrared flux in Figure 2B of
Nishada et al’s data [3] that were replotted for this paper.
Because the PMT measurements began in July 2009 the
first part of the year wa s for the following year 2010.
3. Results
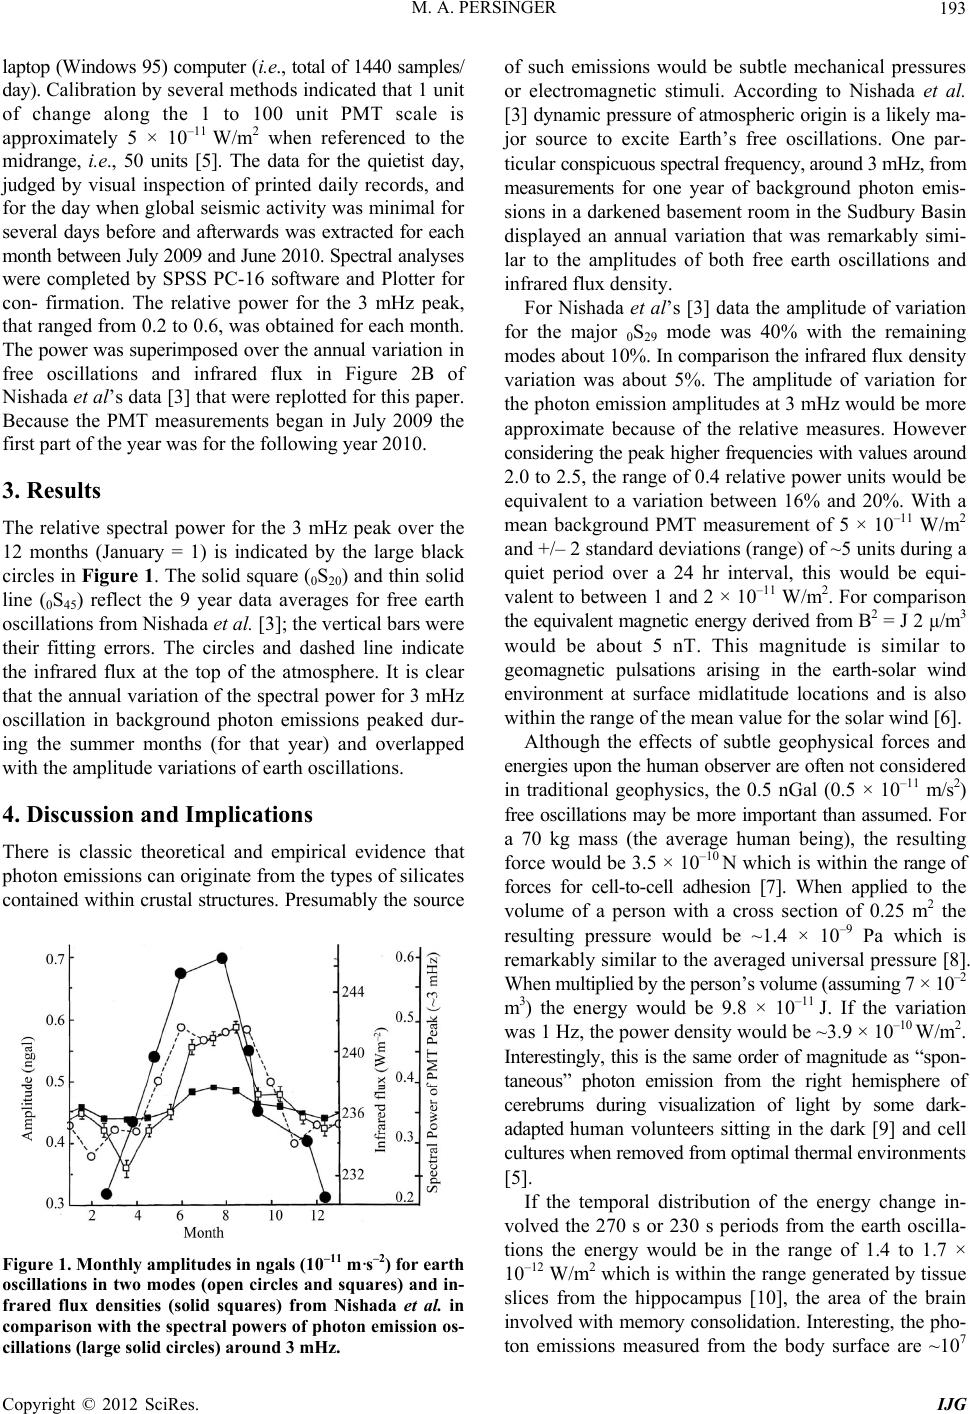
The relative spectral power for the 3 mHz peak over the
12 months (January = 1) is indicated by the large black
circles in Figure 1. The solid square (0S20) an d thin solid
line (0S45) reflect the 9 year data averages for free earth
oscillations from Nishada et al. [3 ]; the ver tical b ars wer e
their fitting errors. The circles and dashed line indicate
the infrared flux at the top of the atmosphere. It is clear
that the annual variation of the spectral power for 3 mHz
oscillation in background photon emissions peaked dur-
ing the summer months (for that year) and overlapped
with the amplitude variations of earth oscillations.
4. Discussion and Implications
There is classic theoretical and empirical evidence that
photon emissions can originate from the types of silicates
contained within crustal structures. Presumably the source
Figure 1. Monthly amplitudes in ngals (10–11 m·s–2) for earth
oscillations in two modes (open circles and squares) and in-
frared flux densities (solid squares) from Nishada et al. in
comparison with the spectral powers of photon emission os-
cillations (large solid circles) around 3 mHz.
of such emissions would be subtle mechanical pressures
or electromagnetic stimuli. According to Nishada et al.
[3 ] dynamic pressure of atmospheric origin is a likely ma-
jor source to excite Earth’s free oscillations. One par-
ticular conspicuous spectral frequency, around 3 mHz, from
measurements for one year of background photon emis-
sions in a darkened basement room in the Sudbury Basin
displayed an annual variation that was remarkably simi-
lar to the amplitudes of both free earth oscillations and
infrared flux density.
For Nishada et al’s [3] data the amplitude of variation
for the major 0S29 mode was 40% with the remaining
modes about 10%. In comparison the infrared flux den si ty
variation was about 5%. The amplitude of variation for
the photon emission amplitudes at 3 mHz would be more
approximate because of the relative measures. However
considering the peak higher frequencies with values around
2.0 to 2.5, the range of 0.4 relative power units would be
equivalent to a variation between 16% and 20%. With a
mean background PMT measurement of 5 × 10–11 W/m2
and +/– 2 standard deviations (range) of ~5 units during a
quiet period over a 24 hr interval, this would be equi-
valent to between 1 and 2 × 10–11 W/m2. For comparison
the equivalent magnetic energy derived from B2 = J 2 µ/m3
would be about 5 nT. This magnitude is similar to
geomagnetic pulsations arising in the earth-solar wind
environment at surface midlatitude locations and is also
within the range of the mean value for the solar wind [6].
Although the effects of subtle geophysical forces and
energies upon the hu man observer are often no t co n si d er e d
in traditional geophysics, the 0.5 nGal (0.5 × 10⁻¹¹ m/s2)
free oscillations may be more important than assumed. F or
a 70 kg mass (the average human being), the resulting
force would be 3.5 × 10⁻¹⁰ N which is within the range of
forces for cell-to-cell adhesion [7]. When applied to the
volume of a person with a cross section of 0.25 m2 the
resulting pressure would be ~1.4 × 10⁻⁹ Pa which is
remarkably similar to the averaged universal p ressure [8].
When multiplied by the person’s volume (assuming 7 × 10⁻²
m3) the energy would be 9.8 × 10⁻¹¹ J. If the variation
was 1 Hz, the power density would be ~3.9 × 10⁻¹⁰ W/m2.
Interestingly, this is the same order of magnitude as “spon-
taneous” photon emission from the right hemisphere of
cerebrums during visualization of light by some dark-
adapted human volunteers sitting in the dark [9] and cell
cultures when removed from optimal thermal environments
[5].
If the temporal distribution of the energy change in-
volved the 270 s or 230 s periods from the earth oscilla-
tions the energy would be in the range of 1.4 to 1.7 ×
10–12 W/m2 which is within the range generated by tissue
slices from the hippocampus [10], the area of the brain
involved with memory consolidation. Interesting, the pho-
ton emissions measured from the body surface are ~107
Copyright © 2012 SciRes. IJG