Paper Menu >>
Journal Menu >>
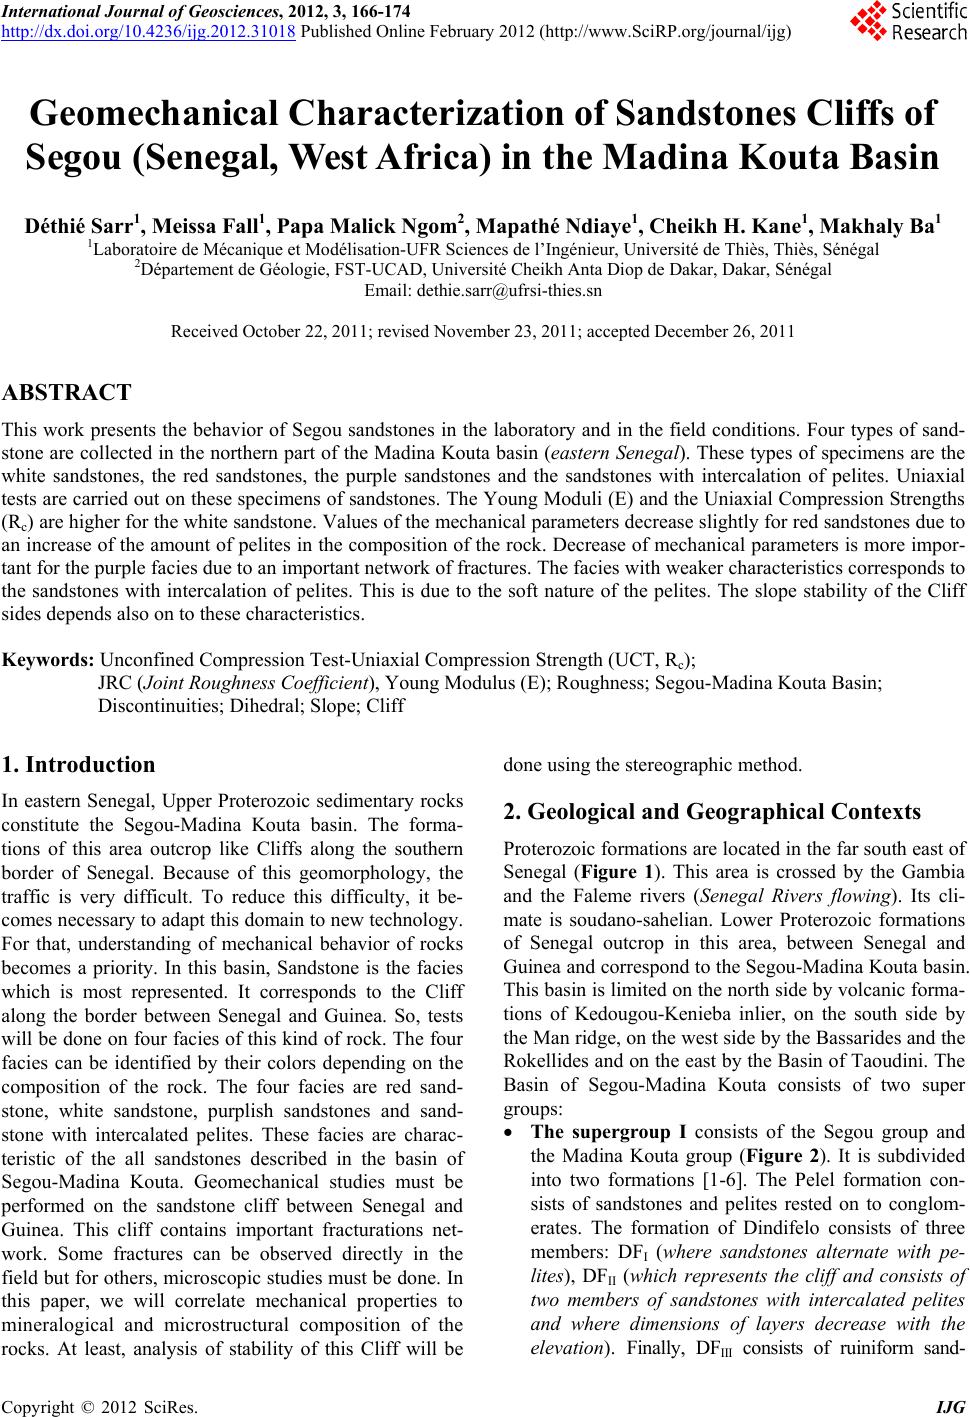 International Journal of Geosciences, 2012, 3, 166-174 http://dx.doi.org/10.4236/ijg.2012.31018 Published Online February 2012 (http://www.SciRP.org/journal/ijg) Geomechanical Characterization of Sandstones Cliffs of Segou (Senegal, West Africa) in the Madina Kouta Basin Déthié Sarr1, Meissa Fall1, Papa Malick Ngom2, Mapathé Ndiaye1, Cheikh H. Kane1, Makhaly Ba1 1Laboratoire de Mécanique et Modélisation-UFR Sciences de l’Ingénieur, Université de Thiès, Thiès, Sénégal 2Département de Géologie, FST-UCAD, Université Cheikh Anta Diop de Dakar, Dakar, Sénégal Email: dethie.sarr@ufrsi-thies.sn Received October 22, 2011; revised November 23, 2011; accepted December 26, 2011 ABSTRACT This work presents the behavior of Segou sandstones in the laboratory and in the field conditions. Four types of sand- stone are collected in the northern part of the Madina Kouta basin (eastern Senegal). These types of specimens are the white sandstones, the red sandstones, the purple sandstones and the sandstones with intercalation of pelites. Uniaxial tests are carried out on these specimens of sandstones. The Young Moduli (E) and the Uniax ial Compression Strengths (Rc) are higher for the white sandstone. Values of the mechanical parameters decrease slightly for red sandstones due to an increase of the amount of pelites in the composition of the rock. Decrease of mechanical parameters is more impor- tant for the purple facies due to an important network of fractures. The facies with weaker characteristics corresponds to the sandstones with intercalation of pelites. This is due to the soft nature of the pelites. The slope stability of the Cliff sides depends also on to these characteristics. Keywords: Unconfined Compression Test-Uniaxial Compression Strength (UCT, Rc); JRC (Joint Roughness Coefficient), Young Modulus (E); Roughness; Segou-Madina Kouta Basin; Discontinuities; Dihedral; Slope; Cliff 1. Introduction In eastern Senegal, Upper Proterozoic sedimentary rocks constitute the Segou-Madina Kouta basin. The forma- tions of this area outcrop like Cliffs along the southern border of Senegal. Because of this geomorphology, the traffic is very difficult. To reduce this difficulty, it be- comes necessary to adapt this domain to new techno logy. For that, understanding of mechanical behavior of rocks becomes a priority. In this basin, Sandstone is the facies which is most represented. It corresponds to the Cliff along the border between Senegal and Guinea. So, tests will be done on four facies of this kind of rock. The four facies can be identified by their colors depending on the composition of the rock. The four facies are red sand- stone, white sandstone, purplish sandstones and sand- stone with intercalated pelites. These facies are charac- teristic of the all sandstones described in the basin of Segou-Madina Kouta. Geomechanical studies must be performed on the sandstone cliff between Senegal and Guinea. This cliff contains important fracturations net- work. Some fractures can be observed directly in the field but for others, microscopic studies must be done. In this paper, we will correlate mechanical properties to mineralogical and microstructural composition of the rocks. At least, analysis of stability of this Cliff will be done using the stereog ra p h i c m e t hod. 2. Geological and Geographical Contexts Proterozoic formations are located in the far south east of Senegal (Figure 1). This area is crossed by the Gambia and the Faleme rivers (Senegal Rivers flowing). Its cli- mate is soudano-sahelian. Lower Proterozoic formations of Senegal outcrop in this area, between Senegal and Guinea and correspond to the Segou-Madina Kouta basin. This basin is limited on the north side by volcanic forma- tions of Kedougou-Kenieba inlier, on the south side by the Man ridge, on the west side by the Bassarides and the Rokellides and on the east by the Basin of Taoudini. The Basin of Segou-Madina Kouta consists of two super groups: The supergroup I consists of the Segou group and the Madina Kouta group (Figure 2). It is subdivided into two formations [1-6]. The Pelel formation con- sists of sandstones and pelites rested on to conglom- erates. The formation of Dindifelo consists of three members: DFI (where sandstones alternate with pe- lites), DFII (which represents the cliff and consists of two members of sandstones with intercalated pelites and where dimensions of layers decrease with the elevation). Finally, DFIII consists of ruiniform sand- C opyright © 2012 SciRes. IJG 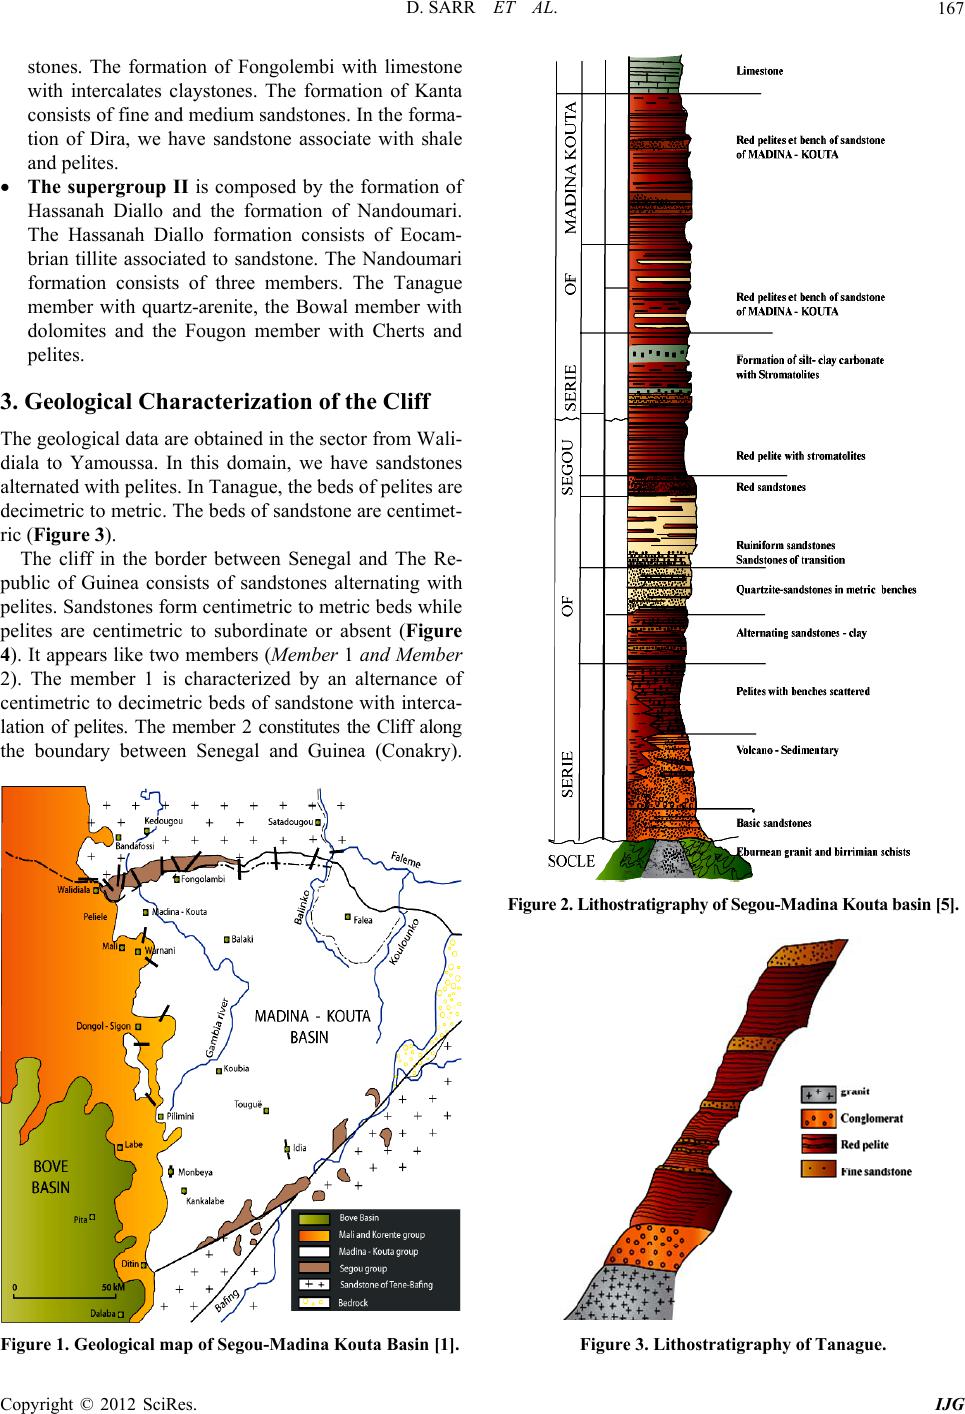 D. SARR ET AL. 167 stones. The formation of Fongolembi with limestone with intercalates claystones. The formation of Kanta consists of fine and medium sandstones. In the forma- tion of Dira, we have sandstone associate with shale and pelites. The supergroup II is composed by the formation of Hassanah Diallo and the formation of Nandoumari. The Hassanah Diallo formation consists of Eocam- brian tillite associated to sandstone. The Nandoumari formation consists of three members. The Tanague member with quartz-arenite, the Bowal member with dolomites and the Fougon member with Cherts and pelites. 3. Geological Characterization of the Cliff The geological data are obtained in the sector from Wali- diala to Yamoussa. In this domain, we have sandstones alternated with pelites. In Tanague, the beds of pelites are decimetric to metric. The beds of sandstone are centimet- ric (Figure 3). The cliff in the border between Senegal and The Re- public of Guinea consists of sandstones alternating with pelites. Sandstones form centimetric to metric beds while pelites are centimetric to subordinate or absent (Figure 4). It appears like two members (Member 1 and Member 2). The member 1 is characterized by an alternance of centimetric to decimetric beds of sandstone with interca- lation of pelites. The member 2 constitutes the Cliff along the boundary between Senegal and Guinea (Conakry). Figure 1. Geological map of Segou-Madina Kouta Basin [1]. Figure 2. Lithostrat igraphy of Se gou-Madina Kouta basin [5] . Figure 3. Lithostratigraphy of Tanague. Copyright © 2012 SciRes. IJG 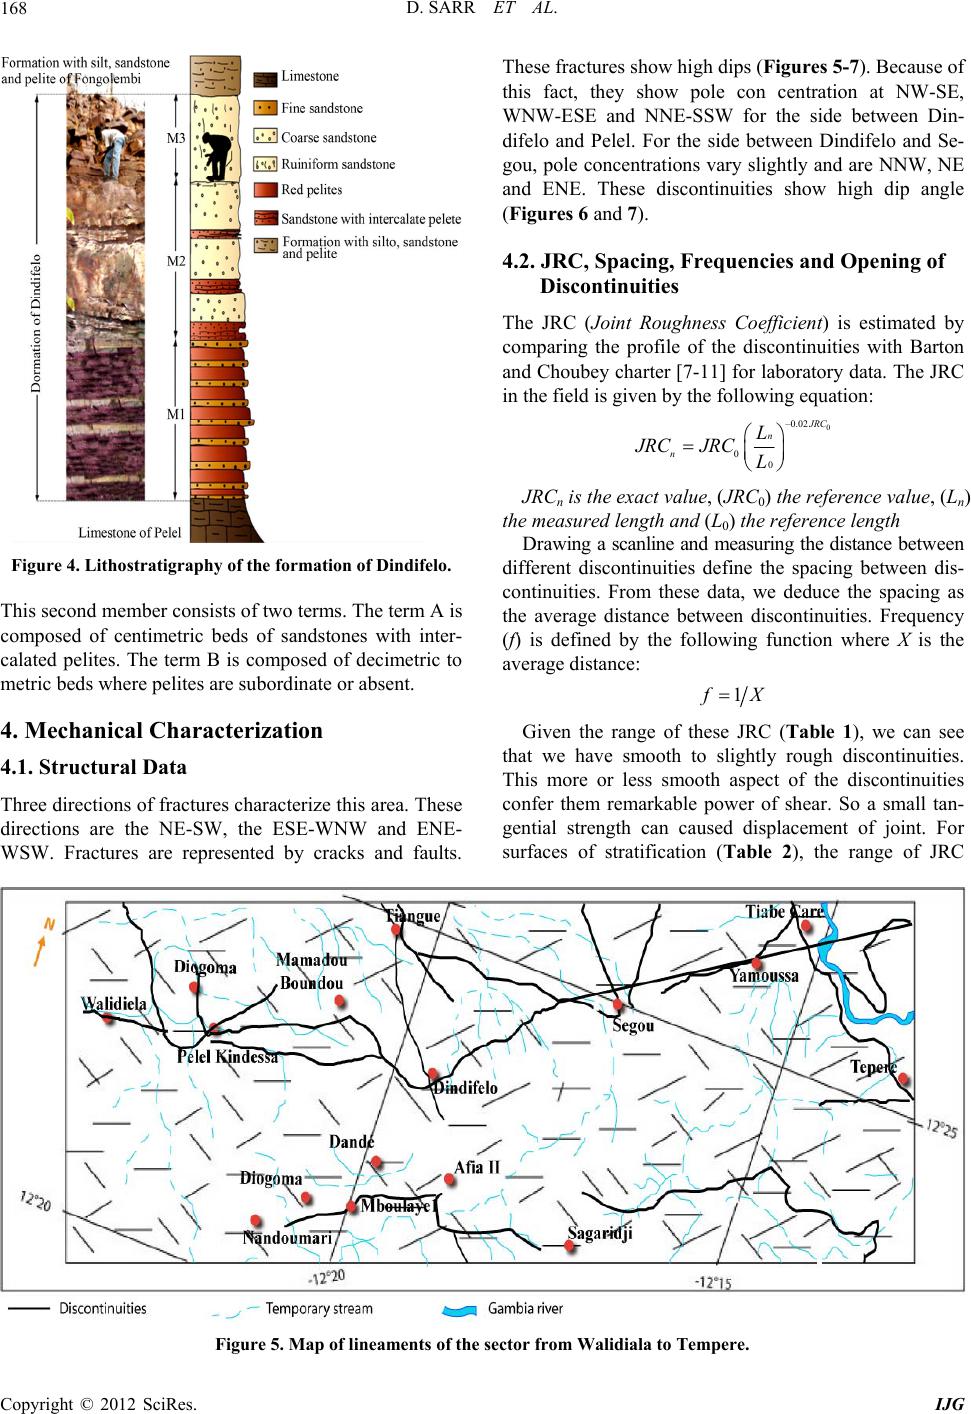 D. SARR ET AL. Copyright © 2012 SciRes. IJG 168 These fractures show high dips (Figures 5-7). Because of this fact, they show pole con centration at NW-SE, WNW-ESE and NNE-SSW for the side between Din- difelo and Pelel. For the side between Dindifelo and Se- gou, pole concentrations vary slightly and are NNW, NE and ENE. These discontinuities show high dip angle (Figures 6 and 7). 4.2. JRC, Spacing, Frequencies and Opening of Discontinuities The JRC (Joint Roughness Coefficient) is estimated by comparing the profile of the discontinuities with Barton and Choubey ch arter [7-11] for labor atory data. The JRC in the field is given by the following equation: Figure 4. Lithostratigraphy of the formation of Dindifelo. This second member consists of two terms. The term A is composed of centimetric beds of sandstones with inter- calated pelites. The term B is composed of decimetric to metric beds where pelites are subordinate or absent. 4. Mechanical Characterization 4.1. Structural Data Three directions of fractures characterize this area. These directions are the NE-SW, the ESE-WNW and ENE- WSW. Fractures are represented by cracks and faults. 0 –0.02 00 J RC n n L JRCJRC L JRCn is the exact value, (JRC0) the reference value, (Ln) the measured length and (L0) the reference length Dr awing a scanline and measuring the distance betwe en different discontinuities define the spacing between dis- continuities. From these data, we deduce the spacing as the average distance between discontinuities. Frequency (f) is defined by the following function where X is the average distance: f X 1 Given the range of these JRC (Table 1), we can see that we have smooth to slightly rough discontinuities. This more or less smooth aspect of the discontinuities confer them remarkable power of shear. So a small tan- gential strength can caused displacement of joint. For surfaces of stratification (Table 2), the range of JRC Figure 5. Map of lineaments of the sector from Walidiala to Tempere. 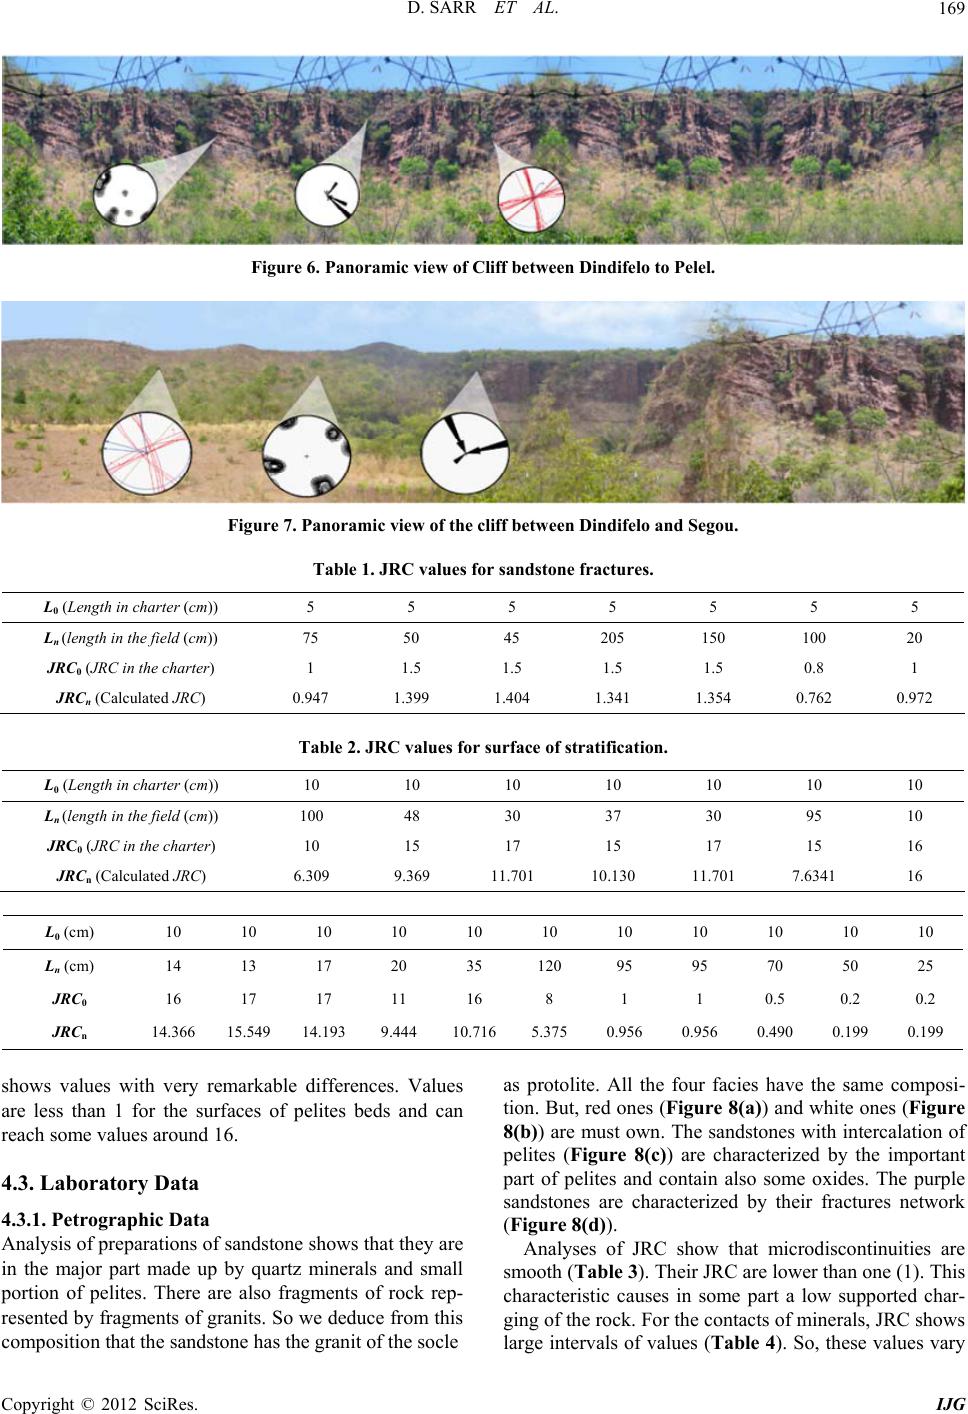 D. SARR ET AL. 169 Figure 6. Panoramic view of Cliff between Dindifelo to Pelel. Figure 7. Panoramic view of the cliff between Dindifelo and Segou. Table 1. JRC values for sandstone fractures. L0 (Length in charter (cm)) 5 5 5 5 5 5 5 Ln (length in the field (cm)) 75 50 45 205 150 100 20 JRC0 (JRC in the charter) 1 1.5 1.5 1.5 1.5 0.8 1 JRCn (Calculated JRC) 0.947 1.399 1.404 1.341 1.354 0.762 0.972 Table 2. JRC values for surface of stratification. L0 (Length in charter (cm)) 10 10 10 10 10 10 10 Ln (length in the field (cm)) 100 48 30 37 30 95 10 JRC0 (JRC in the charter) 10 15 17 15 17 15 16 JRCn (Calculated JRC) 6.309 9.369 11.701 10.130 11.701 7.6341 16 L0 (cm) 10 10 10 10 10 10 10 10 10 10 10 Ln (cm) 14 13 17 20 35 120 95 95 70 50 25 JRC0 16 17 17 11 16 8 1 1 0.5 0.2 0.2 JRCn 14.366 15.549 14.193 9.444 10.7165.375 0.956 0.956 0.490 0.199 0.199 shows values with very remarkable differences. Values are less than 1 for the surfaces of pelites beds and can reach some values around 16. 4.3. Laboratory Data 4.3.1. Petrographic Data Analysis of pr epar ation s of sandstone shows that they are in the major part made up by quartz minerals and small portion of pelites. There are also fragments of rock rep- resented by fragments of granits. So we deduce from this composition that the sandstone has the granit of the socle as protolite. All the four facies have the same composi- tion. But, red ones (Figure 8(a)) and white on es (Figure 8(b)) are must own. The sandstones with intercalation of pelites (Figure 8(c)) are characterized by the important part of pelites and contain also some oxides. The purple sandstones are characterized by their fractures network (Figure 8(d)). Analyses of JRC show that microdiscontinuities are smooth (Table 3). Their JRC are lower than one (1). This characteristic causes in some part a low supported char- ging of the rock. For th e con tacts of minerals, JRC shows large intervals o f values (Table 4). So, these values vary Copyright © 2012 SciRes. IJG 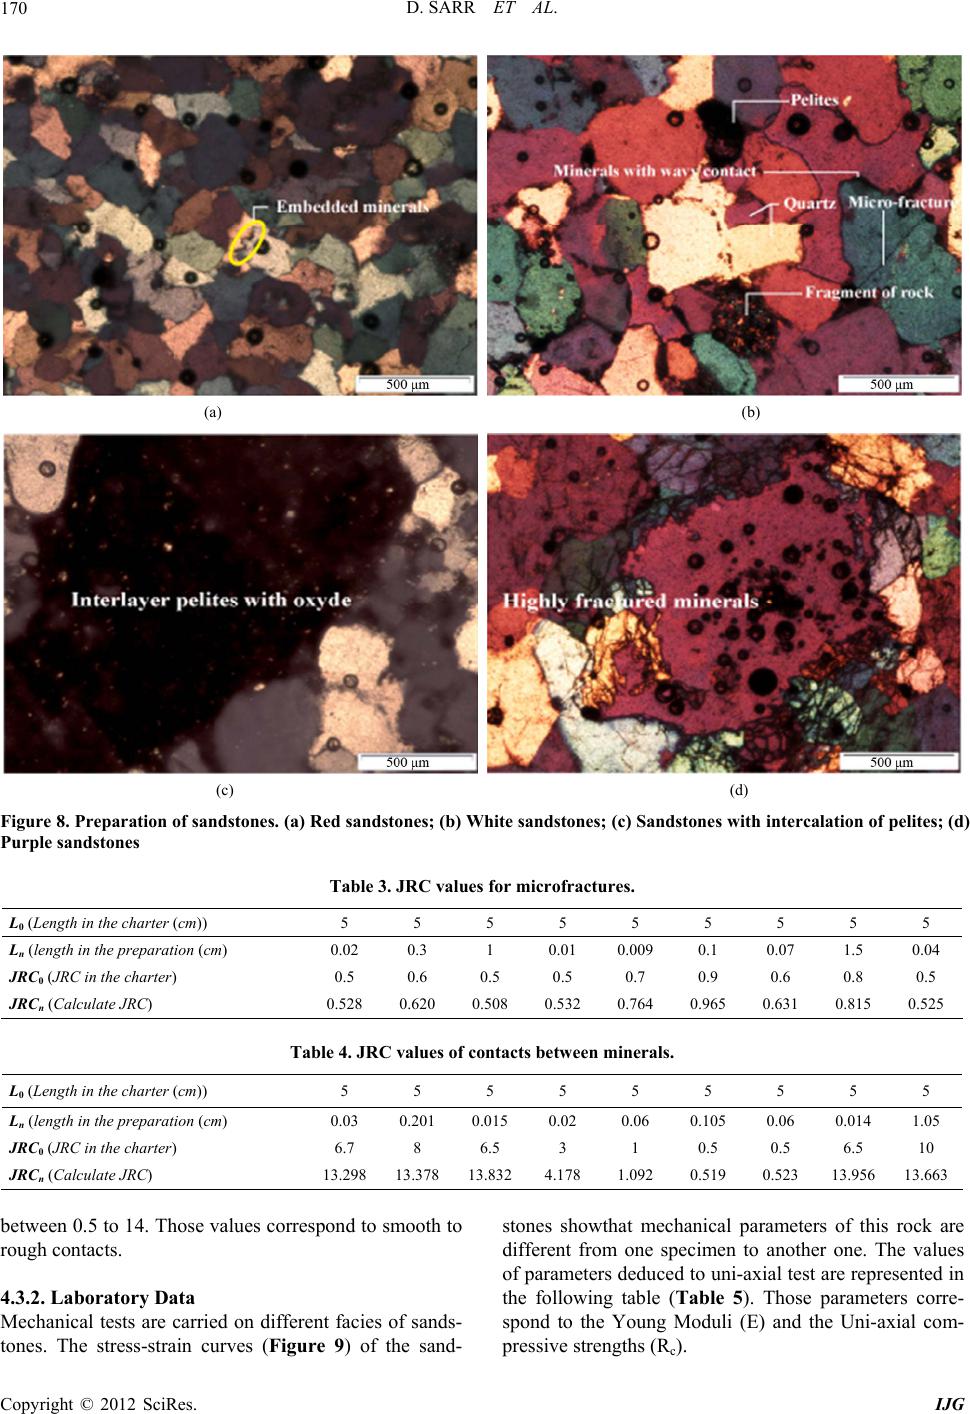 D. SARR ET AL. 170 (a) (b) (c) (d) Figure 8. Preparation of sandstones. (a) Red sandstone s; (b) White sandstones; (c) Sandstones w ith intercalation of pelites; (d) Purple sandstones Table 3. JRC values for microfractures. L0 (Length in the charter (cm)) 5 5 5 5 5 5 5 5 5 Ln (length in the preparation (cm) 0.02 0.3 1 0.01 0.009 0.1 0.07 1.5 0.04 JRC0 (JRC in the charter) 0.5 0.6 0.5 0.5 0.7 0.9 0.6 0.8 0.5 JRCn (Calculate JRC) 0.528 0.620 0.508 0.532 0.764 0.965 0.631 0.815 0.525 Table 4. JRC values of contacts between minerals. L0 (Length in the charter (cm)) 5 5 5 5 5 5 5 5 5 Ln (length in the preparation (cm) 0.03 0.201 0.015 0.02 0.06 0.105 0.06 0.014 1.05 JRC0 (JRC in the charter) 6.7 8 6.5 3 1 0.5 0.5 6.5 10 JRCn (Calculate JRC) 13.298 13.37813.832 4.178 1.092 0.519 0.523 13.95613.663 between 0.5 to 14. Those values correspond to smooth to rough contacts. 4.3.2. Laboratory Data Mechanical tests are carried on different facies of sands- tones. The stress-strain curves (Figure 9) of the sand- stones showthat mechanical parameters of this rock are different from one specimen to another one. The values of parameters deduced to uni-axial test are represented in the following table (Ta b le 5). Those parameters corre- spond to the Young Moduli (E) and the Uni-axial com- pressive strengths (Rc). Copyright © 2012 SciRes. IJG 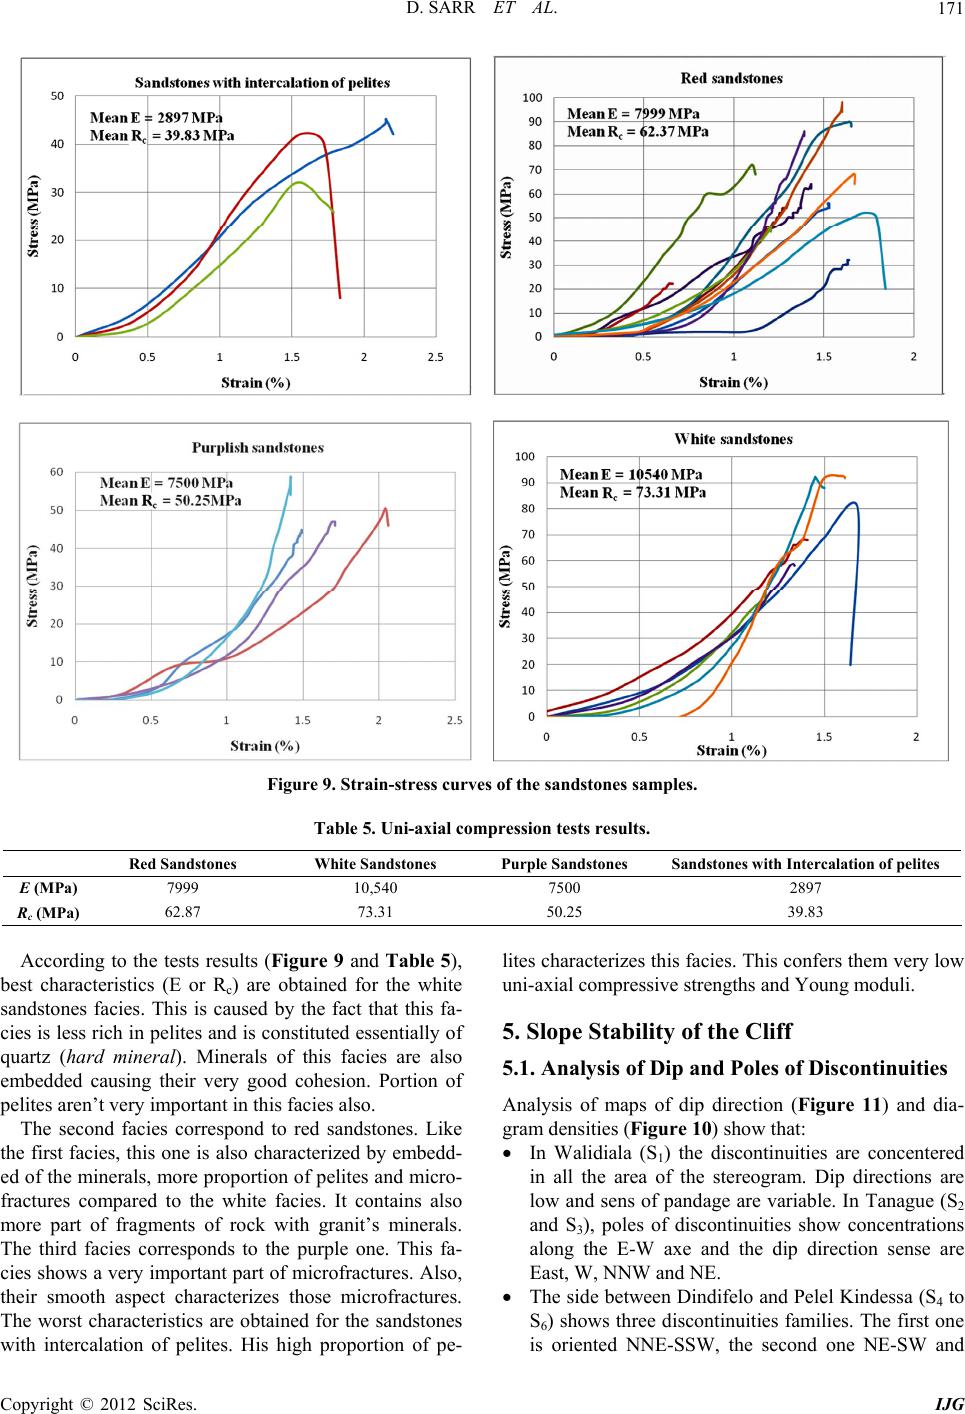 D. SARR ET AL. 171 Figure 9. Strain-stress curves of the sandstones samples. Table 5. Uni-axial compression tests results. Red Sandstones White Sandstones Purple Sandstones Sandstones with Intercalation of pelites E (MPa) 7999 10,540 7500 2897 Rc (MPa) 62.87 73.31 50.25 39.83 According to the tests results (Figure 9 and Table 5), best characteristics (E or Rc) are obtained for the white sandstones facies. This is caused by the fact that this fa- cies is less rich in pelites and is constitu ted essentially of quartz (hard mineral). Minerals of this facies are also embedded causing their very good cohesion. Portion of pelites aren’t very important in this facies also. The second facies correspond to red sandstones. Like the first facies, this one is also characterized by embedd- ed of the minerals, more proportion of pelites and micro- fractures compared to the white facies. It contains also more part of fragments of rock with granit’s minerals. The third facies corresponds to the purple one. This fa- cies shows a very important part of microfractures. Also, their smooth aspect characterizes those microfractures. The worst characteristics are obtained for the sandstones with intercalation of pelites. His high proportion of pe- lites characterizes this facies. This confers them very low uni-axial compressive strengths and Young moduli. 5. Slope Stability of the Cliff 5.1. Analysis of Dip and Poles of Discontinuities Analysis of maps of dip direction (Figure 11) and dia- gram densities (Figure 10) show that: In Walidiala (S1) the discontinuities are concentered in all the area of the stereogram. Dip directions are low and sens of pandage are variable. In Tanague (S2 and S3), poles of discontinuities show concentrations along the E-W axe and the dip direction sense are East, W, NNW and NE. The side between Dindifelo and Pelel Kindessa (S4 to S6) shows three discontinuities families. The first one is oriented NNE-SSW, the second one NE-SW and Copyright © 2012 SciRes. IJG  D. SARR ET AL. 172 the third one in E-W. It shows high dip preferentially in ENE but also in N and SE. The side between Din- difelo and Segou (S7 to S10) shows the same concen- tration with dip direction essentially on the NNW and ENE. From Afia II to Segou (S12 to S15), discontinui- ties show same the characteristics. Dip directions are NNE and SSW. The side in front of Segou (S16, S17) shows three fami- lies of discontinuities. The first family is concentered N with dip direction sense in the N and in the S. the poles of the second family are concentered NNW with dip sen se to the NNW and SSE. The po les of th e third family are concentered to East with dip direc- tions to N, S, S SW, WNW and WSW. The side in face of Yamoussa (S18, S19) shows also three families of discontinuities. The first one shows concentration of pole to the SW with dip direction to the NE. The poles of the second family are concen- tered to NE with high dips to the SW. The third fam- ily shows a concentration of poles of WNW and their dip directions are oriented into ESE to WSW, N to NE and SE. 5.2. Slope Stability of the Cliffsides This section studies the unstable po ssibilities of rocks by stereographic method (Figure 12). For this, all fractura- tions crossed are represented in a stereogram. So, for this analysis, we must have the orientation of the cliffsid e an d of the bedrock. The area of Walidiala shows possibilities of dihedral and plane sliding. These slides have done to SE sense (S1). In Tanague (S2 and S3) there are possibilities of di- hedral sliding to WNW associate to switching instabili- ties to NW. The side between Pelel Kindéssa and Din- difelo shows possibilities of dihedral sliding into the WSW, East and NNW (S4, Figures 10-12). The side S5;6 show possibilities show also a possibility of plan sliding and dihedral sliding. The Cliffside between Dindifelo and Segou shows switching instabilities associated to Tipping rock. These instabilities have done into N t o NW. Between Segou and the cascade of Segou we have possibilities of plane instabilities associate to dihedral instabilities. These displacements have done into the N and the NW (S11 to S14, Figures 10-12). The side on face to Segou (S15 to S16, Figures 10-12) shows the possibili- ties of instabilities are represen ted by switching, dihedral and plane sliding. Concerning the Yamoussa side (S18 to S19; Figures 10 and 11), instabilities are represented by dihedral, plan slidin g. There are also possibilities of stip- ping of rock. 6. Conclusion Previous studies allow us to conclude that the area of Segou is characterized by discontinuities and microdis- continuities forming three families. These families are oriented NNW-SSE, NE-SW and ENE-WSW. Finest studies of this Cliff show the sandstones and pelites are crossed by discontinuities. These formations show vari- ables values of JRC n. These values of JRC are low for fractures, microfractures and surfaces of pelites beds. For Figure 10. Densities of pole map of discontinuities. Copyright © 2012 SciRes. IJG  D. SARR ET AL. 173 Figure 11. Dip direction map of discontinuities. Figure 12. Stereographic plots of discontinuities cross on different hillsides. the surface of sandstone beds and the contacts between quartz minerals, there are high values for JRC. The uni- axial compression tests done on to different facies of sandstones shows these mechanical parameters (Young modulus and Uni-axial compressive strength) vary from the white sandstone to the san dstone with intercalation of pelites. The greatest values are obtained for white sand- stones which are less rich in pelites. The second one is the red sandstone also clean but with most important part of pelites than the white one. Purple one, very fractured, represents the third facies. The facies with worst charac- teristic corresponds to the sandstones with intercalation of pelites. The Young Modulus and Uni-axial compres- sive strength decrease with the proportion of pelites and Copyright © 2012 SciRes. IJG  D. SARR ET AL. 174 also with the microfractures. The cliff shows a very complex instability with sliding plane and dihedral asso- ciate to switching. 7. Acknowledgements Authors would like to Acknowledge Mr. Amsata Thiam, technical Director of SENBUS industries sa for his great contribution in this work, allowing to us the supplies of his manufactory for the samplings. We acknowledge also Dr. Edmond Dioh, Head of the Department of Geology of the IFAN-Cheikh Anta Diop (Dakar), most of the mi- croscopic analysis had been done in his laboratory. The authors would like to acknowledge Mouhamadou Lamine Lo (Assistant Professor—EPT/Thiès) for his guidance and valuable input in this research project. REFERENCES [1] M. Villeneuve, “Etude Géologique de la Bordure SW du Craton Ouest-Africain—La Suture Panafricaine et l’Evo- lution des Bassins Sédimentaires Protérozoïques et Paléo- zoïques de la Marge NW du Continent de Gondwana,” Thèse de D o c t orat, U niv e r sit é d ’ Aix - Marseille III, 1984. [2] C. Bense, “Les Formations Sédimentaires de la Mau- ritanie Méridionale et du Mali Nord Occidental (Afrique de l’Ouest),” Thèse d’Ingénieur Doctorat, de l’Université de Nancy et Mémoire, 1964. [3] J. P. Bassot, “ÒEtude Géologique du Sénégal Oriental et ses et ses Co nfins Guinée-Maliens,” Mémoire BRGM, 1966, N˚40, p. 332. [4] R. Trompette, “Le Précambrien Supérieur et Paléozoïque Inférieur de l’Adrar de Mauritanie (Bordure Occidentale du Bassin de Taoudéni, Afrique de l’Ouest): Un Exemple de Sédimentation du Craton,” Thèse de Doctorat d’Etat, Université Aix Marseille, Marseille, 1973. [5] COGEMA, “Plan Minéral de la République du Sénégal,” Vol. 2, 1982, pp. 566-572. [6] PASMI, “Cartographie Géologique du Sénégal Oriental. Carte Géologique au 1/200000, Feuille Saraya-Kédougou Est,” Notice Explicative, 2010. [7] N. Barton and N. Choubey, “The Shear Strength of Rock in Theory and Practice,” Rock Mechanics, Vol. 10, 1977, pp. 1-54. [8] M. J. A. Leal-Gomes, “Some New Essential Questions about Scale Effects on the Mechanics of Rock Mass Joints,” University of Trás-os-Montes e Alto Douro, Vila Real, 2003. [9] M. Jaboyedoff, “Caractérisations Géométriques Simples des Discontinuités dans un Massif Rocheux. Quanterra,” International Independent Center of Climate Change Im- pact on Natural Risk Analysis in Mountains Area, 2003. [10] J. Zhao, “Propriétés des Discontinuités,” EPFL-ENAC- LMR, 2008. [11] ISRM, “Technology Roadmap for Rock Mechanics,” South African Institute of Mining and Metallurgy, 2003. Copyright © 2012 SciRes. IJG |