Paper Menu >>
Journal Menu >>
 International Journal of Geosciences, 2012, 3, 117-125 http://dx.doi.org/10.4236/ijg.2012.31014 Published Online February 2012 (http://www.SciRP.org/journal/ijg) Geophysics Contribution for the Determination of Aquifers with a Case Study Latifa Ouadif1, Lahcen Bahi1, Ahmed Akhssas1, Khadija Baba1, Med Menzhi2 13GIE Laboratory, Mohammadia Engineering School, Mohammed V Agdal University, Rabat, Morocco 2National Centre for Scientific and Technical Research, Mohammed V Souissi University, Rabat, Morocco Email: ouadif@gmail.com Received September 24, 2011; revised November 23, 2011; accepted December 29, 2011 ABSTRACT The determination and monitoring of aquifer formations on the eastern border of Moroccan Gharb basin are very diffi- cult because of their spatial and temporal variation. To delimit these formations, a geophysical survey of 52 geoelectric soundings was performed with a mesh of 500 m and electrodes distance between 1000 m and 3000 m. Geoelectric sec- tions and resistivity maps show a horst and graben structure. The correlation of existing oil drillings shows that the Ju- rassic and Neogene formations are both affected by normal faults causing Jurassic deposits collapse with local thicken- ing of the Miocene deposits, and reverse faults delimiting tectonic slices due to tension caused by prerifaine nappe ad- vance. This fact confirms the generated structure by the resistivity method. The isobath map of resistant formations’s roof show average depths extending from 400 to 800 m for calcareous sandstone that are potential aquifers while oil drillings indicate over 1000 m depths. Keywords: Aquifer; Prerifaine Nappe; Resistivity Method; Geophysical Survey; Gharb Basin 1. Introduction The Gharb Neogene basin is a collapse zone formed on the margins of the Rif’s chain. The filling deposits of the basin are characterized by a vertical variation due to a re- gional geological context. The Gharb basin, which knew many subsidences during certain periods, with a paroxysm in the Pliocene, receives the prerifaine nappe which sub- divides the Miocene in infra-nappe and supra-nappe Mio- cene [1-5]. The former works reflect the structural com- plexity of Gharb basin in general and particulary its east- ern boundary. This makes the determination and moni- toring of the formations, constituted by permeable depos- its likely to correspond to aquiferous levels, very difficult [6-8]. The recognition of this limit is confronted with the difficulties posed by the lack of data and controversial in- terpretations about the structure of this limit [9,10]. Thus, it is necessary to conduct synthetic studies implying local geology, study of oil drillings and interpretation of all car- ried out geoelectric soundings. The realization of geoele- ctric sections and resistivity maps, combined with the cor- relations of stratigraphic drilling columns, allows eluci- dating the structure of the eastern boundary of the Gharb basin-prerifaine ridges which is affected by reverse faults due to prerifaine nappe advance in the basin and by the collapse normal faults. 2. Methodology The study purpose is to identify the major tectonic aspects of the eastern border of the Gharb basin with prerifaine ridges and find out the formations that may constitute po- tential aquifers levels. This approach required the inter- pretation of 52 geoelectric soundings with AB electrodes distance varying from 1000 to 3000 m, carried out in the Sidi Kacem region, and also to study the oil drills data in the same region that have provided a database on the petrographic facies of the Jurassic and Neogene deposits of the basin boundary with prérifaines ridges. North Eas- South West and North-South drillings correlations show lateral and vertical various formations evolution of this complex boundary. The electrical resistivity method is most used in engi- neering geology. It identifies and locates, from the earth surface, the structures which have resistivity contrasts [11,12]. It consists of conducting geoelectric sounding to determine, at several points, the vertical succession of layers of different resistivity. This method is based on the principle of Ohm’s law: the injection in soil of a direct current at a very low frequency and then voltage meas- urement makes it possible to unveil the true resistivity of crossed formations. Several devices were used among which the most known is the Schlumberger one. In this device (Figure 1), we inject a current into two electrodes C opyright © 2012 SciRes. IJG  L. OUADIF ET AL. 118 A and B, and we measure the voltage at the receiving electrodes M and N. Apparent resistivity is given by: 22 πor 2 app Ll lI app VV KI where K is the geometric factor that depends on elec- trodes spacing only. Our geophysical survey covers an area of 20 km2 and includes 52 geoelectric soundings with a line AB length extending from 1000 to 3000 m (Figure 2). We interpre- ted these VES to determine the vertical succession of for- mations in place and have made geoelectric sections to Figure 1. Schlumberger array. show the lateral variation of facies. We have also made geological sections from oil drilling combined with geoe- lectric sections to correlate the different data and better approximate the limit structure between the prerifaines ridges and the Gharb Basin. 3. Results and Discussions 3.1. Geoelectric Soundings Interpretation Inverse modeling of the electrical resistivity data is done using the software IPI2WIN [13]. We distinguish four groups of geoelectric soundings that generally show re- spectively from top to bottom the following (Figure 3). Group 1 (Figure 3(a)): A thin clay layer; Sand with 60 m of average thickness; Thick layer of marl up to 400 m; Resistant layer formed by calcareous sandstone of the Miocene. Group 2 (Figure 3(b)): A thin clay layer; Figure 2. Location map of geoe le ctric soundings. Copyright © 2012 SciRes. IJG 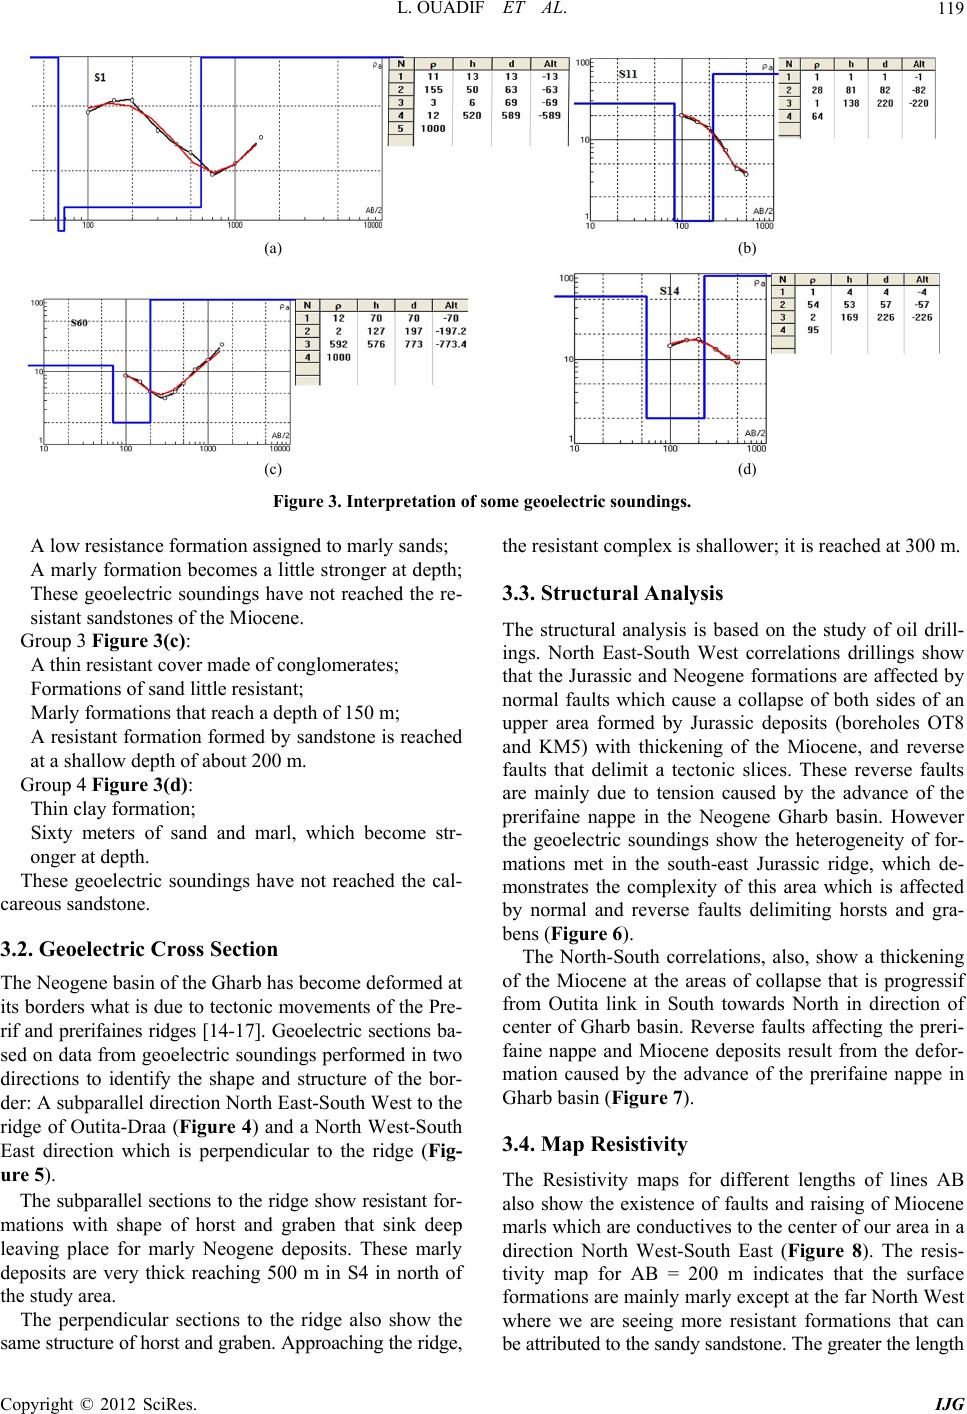 L. OUADIF ET AL. 119 (a) (b) (c) (d) Figure 3. Interpretation of some geoe lectric soundings. A low resistance formation assigned to marly sands; A marly formation becomes a little stronger at depth; These geoelectric soundings have not reached the re- sistant sandstones of the Miocene. Group 3 Figure 3(c): A thin resistant cover made of conglomerates; Formations of sand little resistant; Marly formations that reach a depth of 150 m; A resistant formation formed by sandstone is reached at a shallow depth of about 200 m. Group 4 Figure 3(d): Thin clay formation; Sixty meters of sand and marl, which become str- onger at depth. These geoelectric soundings have not reached the cal- careous sandstone. 3.2. Geoelectric Cross Section The Neogene basin of the Gharb has become deformed at its borders what is due to tectonic movements of the Pre- rif and prerifaines ridges [14-17]. Geoelectric sections ba- sed on data from geoelectric soundings performed in two directions to identify the shape and structure of the bor- der: A subparallel direction North East-South West to the ridge of Outita-Draa (Figure 4) and a North West-South East direction which is perpendicular to the ridge (Fig- ure 5). The subparallel sections to the ridge show resistant for- mations with shape of horst and graben that sink deep leaving place for marly Neogene deposits. These marly deposits are very thick reaching 500 m in S4 in north of the study area. The perpendicular sections to the ridge also show the same structure of horst and graben. Approaching the ridge, the resistant complex is shallower; it is reached at 300 m. 3.3. Structural Analysis The structural analysis is based on the study of oil drill- ings. North East-South West correlations drillings show that the Jurassic and Neogene formations are affected by normal faults which cause a collapse of both sides of an upper area formed by Jurassic deposits (boreholes OT8 and KM5) with thickening of the Miocene, and reverse faults that delimit a tectonic slices. These reverse faults are mainly due to tension caused by the advance of the prerifaine nappe in the Neogene Gharb basin. However the geoelectric soundings show the heterogeneity of for- mations met in the south-east Jurassic ridge, which de- monstrates the complexity of this area which is affected by normal and reverse faults delimiting horsts and gra- bens (Figure 6). The North-South correlations, also, show a thickening of the Miocene at the areas of collapse that is progressif from Outita link in South towards North in direction of center of Gharb basin. Reverse faults affecting the preri- faine nappe and Miocene deposits result from the defor- mation caused by the advance of the prerifaine nappe in Gharb basin (Figure 7). 3.4. Map Resistivity The Resistivity maps for different lengths of lines AB also show the existence of faults and raising of Miocene marls which are conductives to the center of our area in a direction North West-South East (Figure 8). The resis- tivity map for AB = 200 m indicates that the surface formations are mainly marly except at the far North West where we are seeing more resistant formations that can be attributed to the sandy sandstone. The greater the length Copyright © 2012 SciRes. IJG 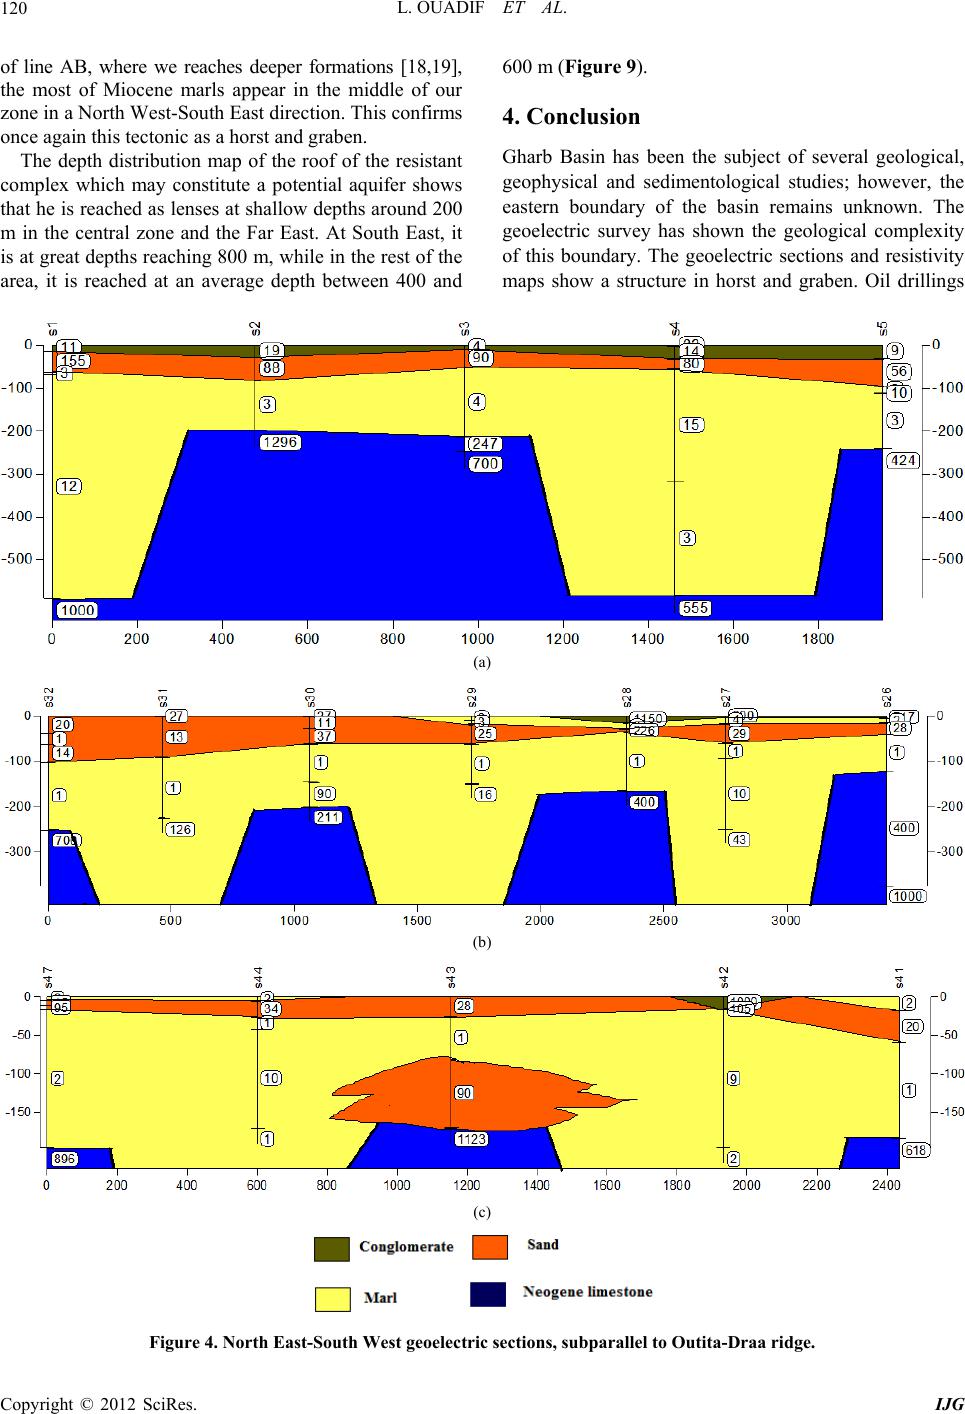 L. OUADIF ET AL. 120 of line AB, where we reaches deeper formations [18,19], the most of Miocene marls appear in the middle of our zone in a North West-South East direction. This confirms once again this tectonic as a horst and graben. The depth distribution map of the roof of the resistant complex which may constitute a potential aquifer shows that he is reached as lenses at shallow depths around 200 m in the central zone and the Far East. At South East, it is at great depths reaching 800 m, while in the rest of the area, it is reached at an average depth between 400 and 600 m (Figure 9). 4. Conclusion Gharb Basin has been the subject of several geological, geophysical and sedimentological studies; however, the eastern boundary of the basin remains unknown. The geoelectric survey has shown the geological complexity of this boundary. The geoelectric sections and resistivity maps show a structure in horst and graben. Oil drillings (a) (b) (c) Figure 4. North East-South West geoele c tric sec t ions, subpar a lle l to Outita-Draa r i dge. Copyright © 2012 SciRes. IJG 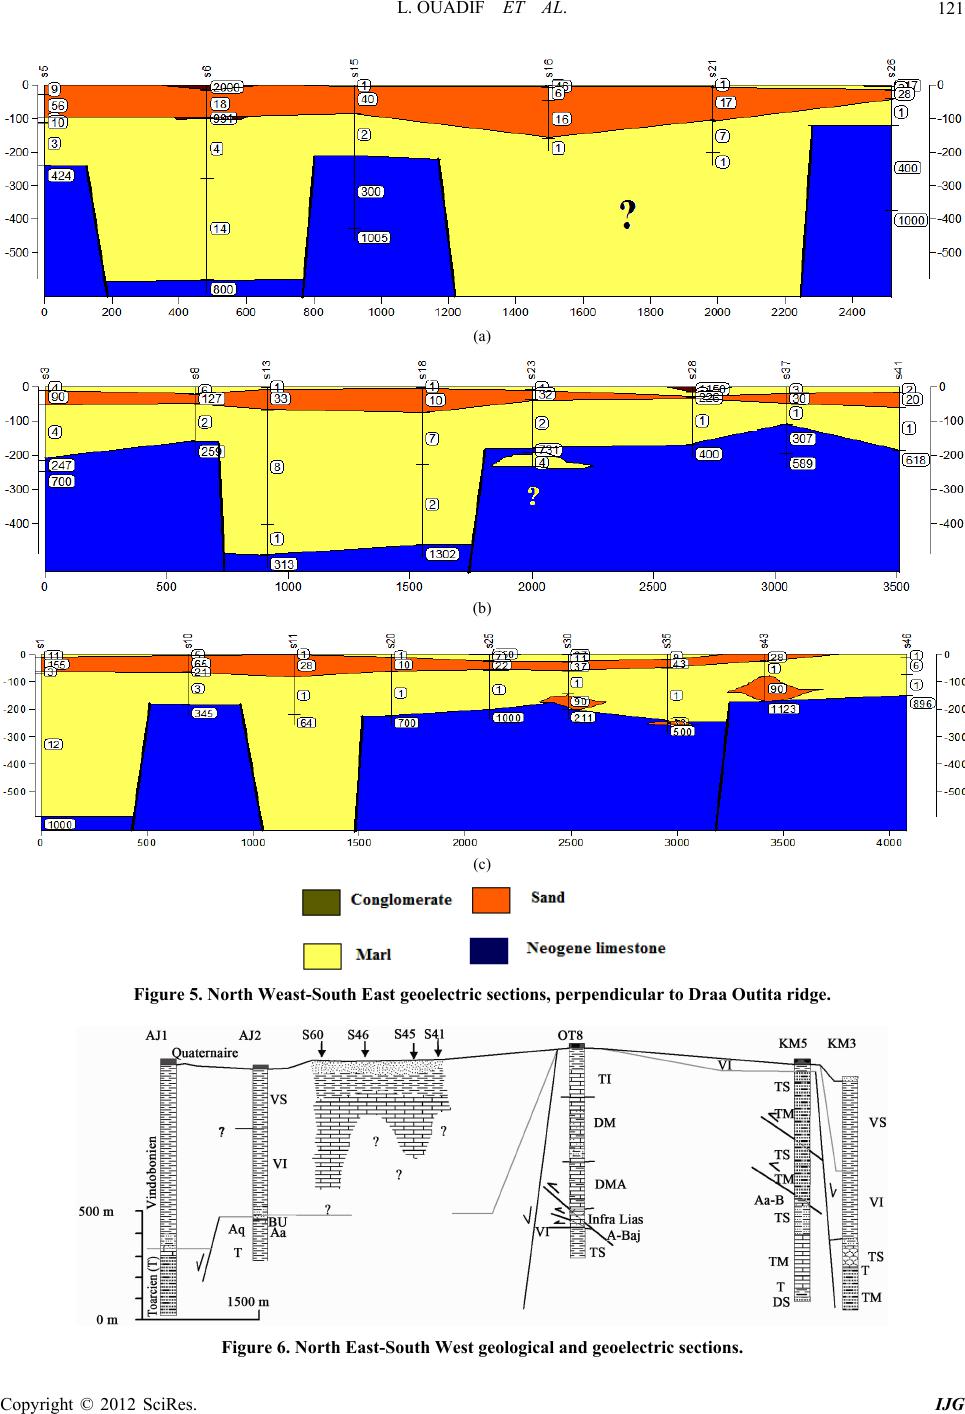 L. OUADIF ET AL. 121 (a) (b) (c) Figure 5. North Weast-South East geoelectric sections, perpendicular to Draa Outita ridge. Figure 6. North East-South West geological and geoelectric sections. Copyright © 2012 SciRes. IJG  L. OUADIF ET AL. 122 Figure 7. North South geological and geoelectric sections. Copyright © 2012 SciRes. IJG 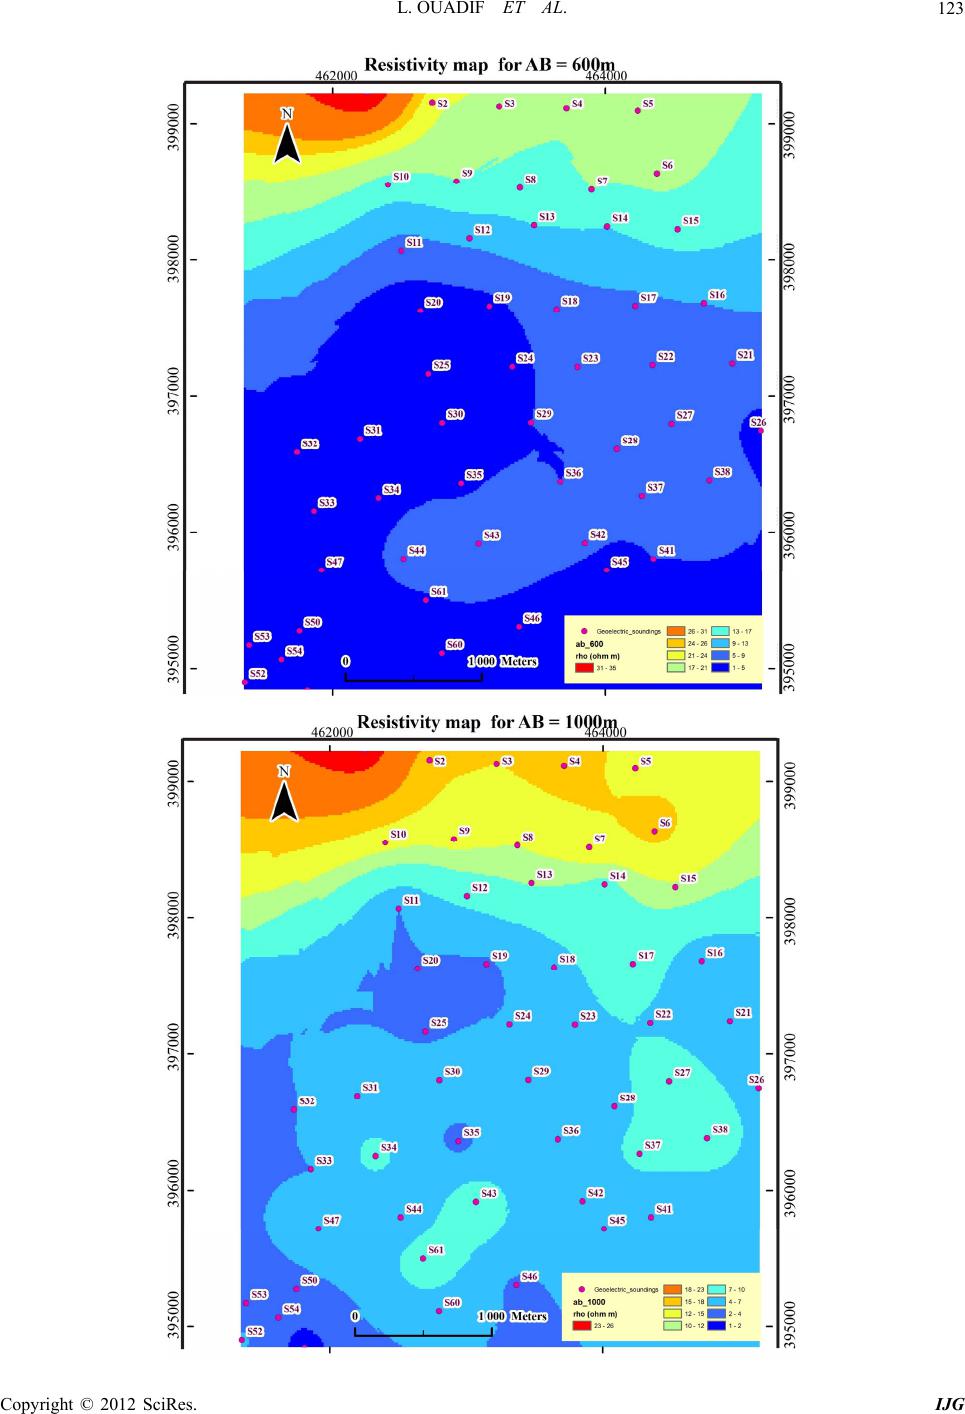 L. OUADIF ET AL. 123 Copyright © 2012 SciRes. IJG  L. OUADIF ET AL. 124 Figure 8. Resistivity maps for AB = 200, 600, 1000 and 3000. Figure 9. Depth distribution map of resistant roof. Copyright © 2012 SciRes. IJG  L. OUADIF ET AL. Copyright © 2012 SciRes. IJG 125 orrelations conducted in Sidi Kacem region show re- verse faults affecting the Jurassic and the Neogene due to tension caused by the prerifaine nappe advance. This con- firms the structure generated by the geoelectric survey. The originality of our work is the fact that the roof map of resistant layers gives average depths between 400 and 600 m for calcareous sandstone which could constitute potential aquifers as opposed to the oil drillings, which indicate depths over 1000 m. REFERENCES [1] P. Cirac, “Le Bassin Sud-Rifain Occidental au Néogène Supérieur. Evolution de la Dynamique Sédimentaire et de la Pléogéographie au Cours d’Une Phase de Comble- ment,” Thèse d’Etat, Université de Bordeaux I, 3 Tomes, 1985. [2] P. Cirac, “Environnements Sédimentaires du Pliocène de la Bordure Pré-Rifaine du Gharb (Maroc Nord-Occidetal),” Bulletin de la Société Géologique de France, Vol. 7, No. 3, 1978, pp. 3323-3327. [3] H. Feinberg, “Les Séries Tertiaires des Zones Externes du Rif (Maroc),” Notes et Mémoires du Service Géologique du Maroc, Vol. 315, 1986, p. 192. [4] W. Litto, “Apport de la Sismique Réflexion et des Dia- graphies à l’Etude de l’Evolution Géodynamique D’un Bassin Néogène à Potentiel Pétrolier: Exemple de la Marge Nord du Bassin du Gha inifères Jurassiques des Rides sud Rifaines et des Régions Voisines (Maroc),” d’Etat, Univer [8] M. Kili, B. Elora, “De doi:10.1016/j.crte.2006.09.008 c rb (Avant Pays Rifain, Maroc),” Thèse de Doctorat, Faculté des Sciences Rabat, Maroc, 2001. [5] Société Chérifienne des Pétroles (SCP), “Carte Géolo- gique du Gharb et Prérif Occidental, 1/200000,” 1952. [6] A. Akhssas, “Contribution à l’Etude des Niveaux Sableux à Hydrocarbures du Miocène Post-Nappe du Bassin du Gharb (Maroc). Application de l’Analyse Multidimen- sionnelle,” Thèse d’Etat, University Mohammed V-Agdal, 2002. [7] M. Boutakiout, “Les Foram Thèse sité Lyon, 1988. Mansouri, J. Chao and A. Ait F Nouveaux Eléments Structuraux du Complexe Aquifère Profond du Bassin du Rharb (Maroc),”Comptes Rendus Geoscience, Vol. 338, No. 16, 2006, pp. 1194-1202. [9] A. Tahayt, T. Mourabit, A. Rigo, K. L. Feigl, A. Fadil, S. McClusky, R. Reilinger, et al., “Mouvements Actuels des Blocs Tectoniques dans l’arc Bético-Rifain à Partir des Mesures GPS Entre 1999 et 2005,”Comptes Rendus Geo- science, Vol. 340, No. 6, 2008, pp. 400-413. doi:10.1016/j.crte.2008.02.003 [10] N. Maad, P. Le Roy, et al., “Seismic Stratigraphy of the NW Moroccan Atlantic Continental Shelf and Quaternary Deformation at the Offshore Termination of the Southern Rif Front,” Comptes Rendus Geoscience, Vol. 342, No. 9, 2010, pp. 731-740. doi:10.1016/j.crte.2010.04.006 [11] T. Chouteau, “Les Méthodes Electriques,” Notes de Cours, Publications Ecole Polytechnique, Montréal, 2001. [12] W. M. Telford, L. P. Geldart, R. E. Sheriff and D. A. Keys, “Prospection Géophysique, Tome 3,” La Barban- nerie, 1989. [13] GEOSCAN-M Ltd., “IPI2Win v.2.1, IPI_Res2, IPI_Res3,” User’s Guide, 2001. [14] K. Bargach, P. Ruano, A. Chabli, J. Galindo-ZaldiVar, A. Chalouan, A. Jaboloy, M. Akil, M. Ahmamou, C. Sanz De Galdeano and M. Benmakhlouf, “Recent Tectonic Deformations and Stresses in the Frontal Part of the Rif Cordillera and the Saıss Basin (Fes and Rabat Regions, Morocco,” Pure and Applied Geophysics, Vol. 161, No. 3, 2004, pp. 521-540. doi:10.1007/s00024-003-2461-6 [15] J. C. Faugères, “Les Rides Sud-Rifaines. Evolution Sédi- mentaire et Structurale d’un Bassin Atlantico-Mésogéen ne,” Thèse de Doctorat d’Etat, 2 Tomes, imentologique et Structurale de la Marge ti- , Houston, 1996. de la Marge Africai Université Bordeaux I, 1978 [16] W. Litto, B. Jaaidi El, M. Dakki and F. Et Medina, “Evolution Séd Nord du Bassin du Gharb Durant le Néogène (Avant Pays Rifain, Maroc): Cas d’une Inversion,” XIth Congress of Regional Committee on Mediterranean Neogene Stra graphy, 27-30 September 2000. [17] M. Zizi, “Triassic-Jurassic Extensional Systems and Their Neogene Reactivation in Northern Morocco (The Rides Prerifaines and Guercif Basin),” Ph.D. Thesis, Rice Uni- versity [18] P. Kearey, M. Brooks and I. Hill, “An Introduction to Geophysical Exploration,” Blackwell Science Ltd, Mal- den, 2002. [19] C. Meyer de Stadelhofen, “Applications de la Géophy- sique aux Recherches d’Eau,” Lavoisier, 1991. |