 International Journal of Geosciences, 2012, 3, 93-104 http://dx.doi.org/10.4236/ijg.2012.31011 Published Online February 2012 (http://www.SciRP.org/journal/ijg) Clayey Sand Soil’s Behaviour Analysis and Imaging Subsurface Structure via Engineering Characterizations and Integrated Geophysicals Tomography Modeling Methods Andy Anderson Bery, Rosli Saad Geophysics Section, School of Physics, Universiti Sains Malaysia, Penang, Malaysia Email: andersonbery@yahoo.com.my Received November 5, 2011; revised December 20, 2011; accepted January 21, 2012 ABSTRACT The geoelectrical resistivity and seismic refraction surveys which were used in this study on the test site, delivered a detailed image of the near-surface conditions in generally very good. Electrical resistivity and seismic refraction analy- sis proved that a combination of these integrated study of the physical environmental data provided a reasonable com- promise between measurement time and image resolution. Quantitative interpretation of the resistivity and seismic mo- dels based on soil’s parameters determined using laboratory practices and field survey could reproduce the range of resistivity and seismic values found on the site very well. The model explains the ambiguity in between resistivity and clayey sands found on the site and predict the dominant role of water saturation. Geophysical methods are used in this research in purpose to determine the internal structure of a soil mass. Various geophysical methods and their merits for imaging subsurface structures and condition are discussed. Seismic methods are often the most suitable because the measurements depend on the mechanical properties which are also important in the mechanical calculation of soil’s behaviour analysis. Other geophysical method, such as geoelectric resistivity, is useful to determine the internal struc- ture, but require a correlation of found boundaries with mechanical properties. This research was conducted to investi- gate the subsurface structures and conditions through geotechnical engineering properties and its geophysical character- istics. The computation analysis is used in this research in purpose to investigate clayey sand soil’s behaviour. Electrical resistivity test and engineering laboratory practices such as soil strength test, liquid limit test, plastic limit test and grain size distribution test was also carried out to investigate clayey sand soil behaviour in Batu Uban, Penang area during monitoring period. Keywords: Geoelectrical Resistivity; Seismic Refraction; Soil’s Behaviour; Investigate; Monitoring Period 1. Introduction Natural disasters that occur suddenly such as landslide can cause death and economic losses such as damaging buildings, roads and vehicles [1,2]. The prediction of any natural disaster before it occurs will reduce or stop these hazards. There are internal factors which can cause soil stability problems such internal subsurface structure and the amount of groundwater, sliding subsurface and water movement that can be imaged by geophysical techniques [3]. The subsurface structure is a crucial factor which affects slope stability [4]. Groundwater, water movement and the sliding subsurface are the most important internal factor of unstable slope stability [5]. Tropical countries which have a high annual rainfall and a high temperature can cause weathering and form thick soil and weathered rock layers. Tropical countries face natural disasters such as landslide due to this climate and causative factors such as geological condition. The insitu behaviour of soils is complex because it is heavily dependent upon numerous factors. To acquire ap- propriate understanding, it is necessary to analyze them not only through geophysics and geotechnical engineer- ing skills but also through other associated disciplines like geology, geomorphology, climatology and other earth and atmosphere related sciences [3]. In the last decade for instance, research studies related to the influence of fines on liquefaction potential accel- erated markedly [6-8]. The purpose of these investiga- tions was to quantify the effect of fines on the liquefac- tion potential of soils containing nonplastic fines. The role of fines in liquefaction mechanism is not fully understood yet [8,9]. These fines may affect the compression char- acteristics of coarse grained soils as well. In some mod- C opyright © 2012 SciRes. IJG 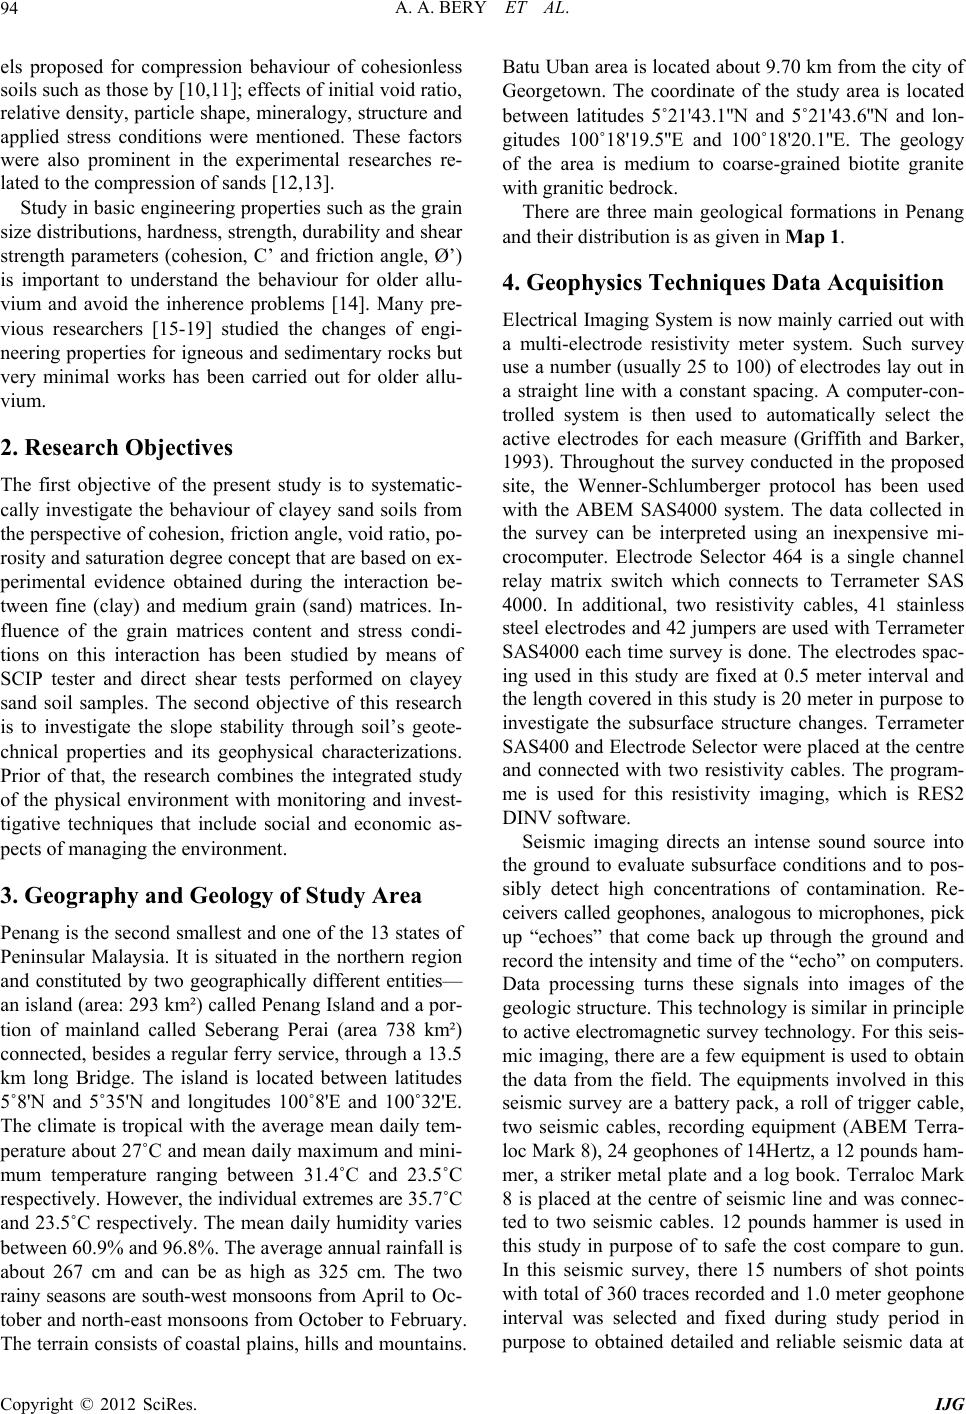 A. A. BERY ET AL. 94 els proposed for compression behaviour of cohesionless soils such as those by [10,11]; effects of initial void ratio, relative density, particle shape, mineralogy, structure and applied stress conditions were mentioned. These factors were also prominent in the experimental researches re- lated to the compression of sands [12,13]. Study in basic engineering properties such as the grain size distributions, hardness, strength, durability and shear strength parameters (cohesion, C’ and friction angle, Ø’) is important to understand the behaviour for older allu- vium and avoid the inherence problems [14]. Many pre- vious researchers [15-19] studied the changes of engi- neering properties for igneous and sedimentary rocks but very minimal works has been carried out for older allu- vium. 2. Research Objectives The first objective of the present study is to systematic- cally investigate the behaviour of clayey sand soils from the perspective of cohesion, friction angle, void ratio, po- rosity and saturation degree concept that are based on ex- perimental evidence obtained during the interaction be- tween fine (clay) and medium grain (sand) matrices. In- fluence of the grain matrices content and stress condi- tions on this interaction has been studied by means of SCIP tester and direct shear tests performed on clayey sand soil samples. The second objective of this research is to investigate the slope stability through soil’s geote- chnical properties and its geophysical characterizations. Prior of that, the research combines the integrated study of the physical environment with monitoring and invest- tigative techniques that include social and economic as- pects of managing the environment. 3. Geography and Geology of Study Area Penang is the second smallest and one of the 13 states of Peninsular Malaysia. It is situated in the northern region and constituted by two geographically different entities— an island (area: 293 km²) called Penang Island and a por- tion of mainland called Seberang Perai (area 738 km²) connected, besides a regular ferry service, through a 13.5 km long Bridge. The island is located between latitudes 5˚8'N and 5˚35'N and longitudes 100˚8'E and 100˚32'E. The climate is tropical with the average mean daily tem- perature about 27˚C and mean daily maximum and mini- mum temperature ranging between 31.4˚C and 23.5˚C respectively. However, the individual extremes are 35.7˚C and 23.5˚C respectively. The mean daily humidity varies between 60.9% and 96.8%. The average annual rainfall is about 267 cm and can be as high as 325 cm. The two rainy seasons are south-west monsoons from April to Oc- tober and north-east monsoons from October to February. The terrain consists of coastal plains, hills and mountains. Batu Uban area is located about 9.70 km from the city of Georgetown. The coordinate of the study area is located between latitudes 5˚21'43.1''N and 5˚21'43.6''N and lon- gitudes 100˚18'19.5''E and 100˚18'20.1''E. The geology of the area is medium to coarse-grained biotite granite with granitic bedrock. There are three main geological formations in Penang and their distribution is as given in Map 1. 4. Geophysics Techniques Data Acquisition Electrical Imaging System is now mainly carried out with a multi-electrode resistivity meter system. Such survey use a number (usually 25 to 100) of electrodes lay out in a straight line with a constant spacing. A computer-con- trolled system is then used to automatically select the active electrodes for each measure (Griffith and Barker, 1993). Throughout the survey conducted in the proposed site, the Wenner-Schlumberger protocol has been used with the ABEM SAS4000 system. The data collected in the survey can be interpreted using an inexpensive mi- crocomputer. Electrode Selector 464 is a single channel relay matrix switch which connects to Terrameter SAS 4000. In additional, two resistivity cables, 41 stainless steel electrodes and 42 jumpers are used with Terrameter SAS4000 each time survey is done. The electrodes spac- ing used in this study are fixed at 0.5 meter interval and the length covered in this study is 20 meter in purpose to investigate the subsurface structure changes. Terrameter SAS400 and Electrode Selector were placed at the centre and connected with two resistivity cables. The program- me is used for this resistivity imaging, which is RES2 DINV software. Seismic imaging directs an intense sound source into the ground to evaluate subsurface conditions and to pos- sibly detect high concentrations of contamination. Re- ceivers called geophones, analogous to microphones, pick up “echoes” that come back up through the ground and record the intensity and time of the “echo” on computers. Data processing turns these signals into images of the geologic structure. This technology is similar in principle to active electromagnetic survey technology. For this seis- mic imaging, there are a few equipment is used to obtain the data from the field. The equipments involved in this seismic survey are a battery pack, a roll of trigger cable, two seismic cables, recording equipment (ABEM Terra- loc Mark 8), 24 geophones of 14Hertz, a 12 pounds ham- mer, a striker metal plate and a log book. Terraloc Mark 8 is placed at the centre of seismic line and was connec- ted to two seismic cables. 12 pounds hammer is used in this study in purpose of to safe the cost compare to gun. In this seismic survey, there 15 numbers of shot points with total of 360 traces recorded and 1.0 meter geophone interval was selected and fixed during study period in purpose to obtained detailed and reliable seismic data at Copyright © 2012 SciRes. IJG 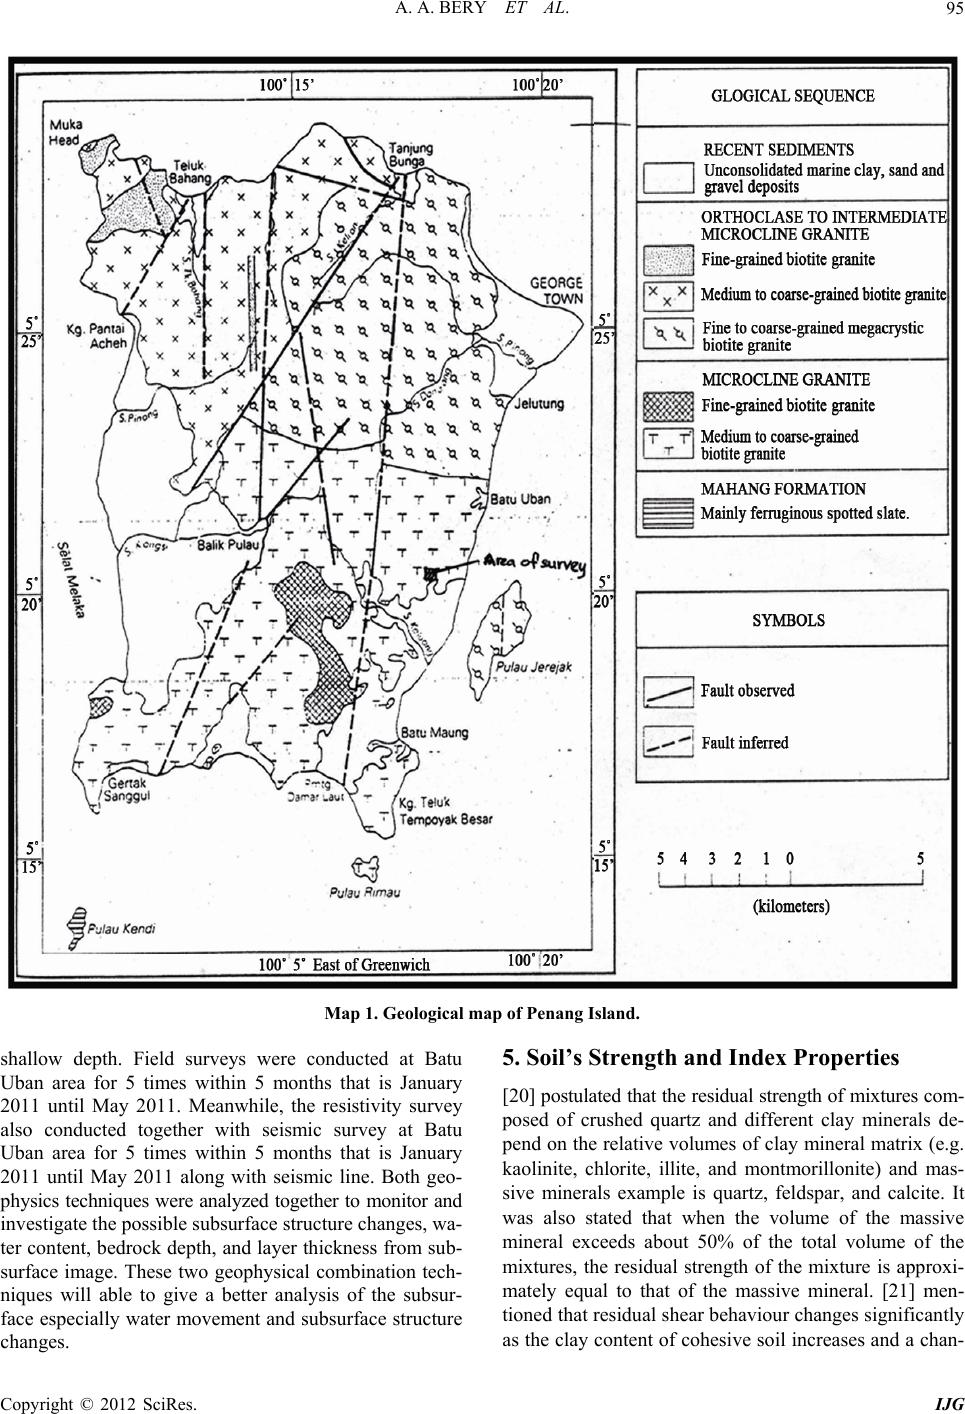 A. A. BERY ET AL. Copyright © 2012 SciRes. IJG 95 Map 1. Geological map of Penang Island. 5. Soil’s Strength and Index Properties shallow depth. Field surveys were conducted at Batu Uban area for 5 times within 5 months that is January 2011 until May 2011. Meanwhile, the resistivity survey also conducted together with seismic survey at Batu Uban area for 5 times within 5 months that is January 2011 until May 2011 along with seismic line. Both geo- physics techniques were analyzed together to monitor and investigate the possible subsurface structure changes, wa- ter content, bedrock depth, and layer thickness from sub- surface image. These two geophysical combination tech- niques will able to give a better analysis of the subsur- face especially water movement and subsurface structure changes. [20] postulated that the residual strength of mixtures com- posed of crushed quartz and different clay minerals de- pend on the relative volumes of clay mineral matrix (e.g. kaolinite, chlorite, illite, and montmorillonite) and mas- sive minerals example is quartz, feldspar, and calcite. It was also stated that when the volume of the massive mineral exceeds about 50% of the total volume of the mixtures, the residual strength of the mixture is approxi- mately equal to that of the massive mineral. [21] men- tioned that residual shear behaviour changes significantly as the clay content of cohesive soil increases and a chan- 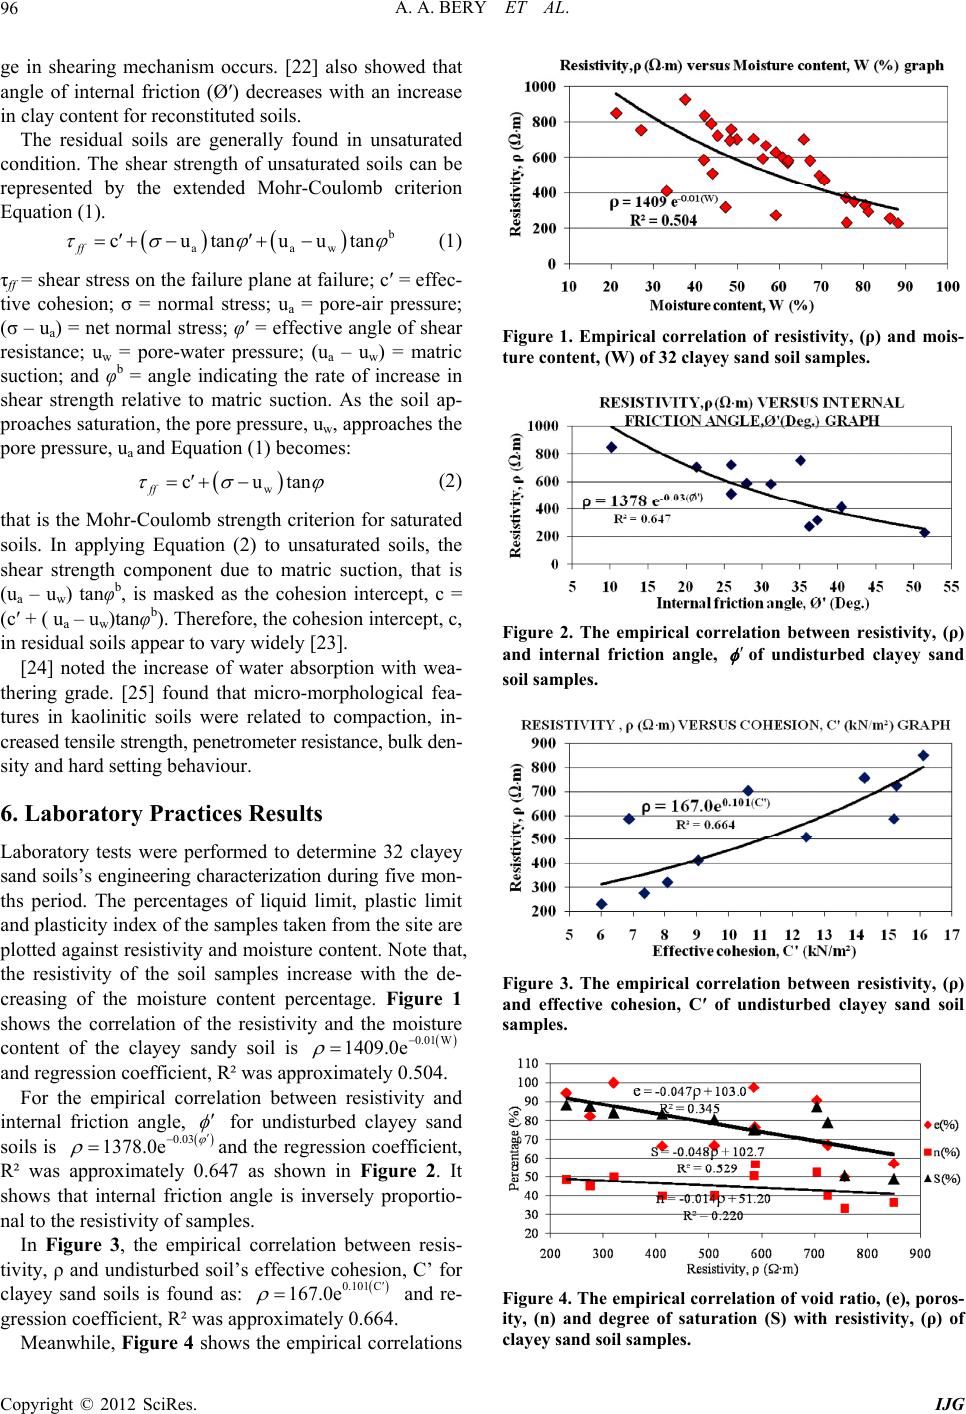 A. A. BERY ET AL. 96 ge in shearing mechanism occurs. [22] also showed that angle of internal friction (Ø′) decreases with an increase in clay content for reconstituted soils. The residual soils are generally found in unsaturated condition. The shear strength of unsaturated soils can be represented by the extended Mohr-Coulomb criterion Equation (1). aa cutan ff w uutan w cutan (1) τff = shear stress on the failure plane at failure; c′ = effec- tive cohesion; σ = normal stress; ua = pore-air pressure; (σ – ua) = net normal stress; φ′ = effective angle of shear resistance; uw = pore-water pressure; (ua – uw) = matric suction; and φb = angle indicating the rate of increase in shear strength relative to matric suction. As the soil ap- proaches saturation, the pore pressure, uw, approaches the pore pressure, ua and Equation (1) becomes: ff 0.01 W 409.0e (2) that is the Mohr-Coulomb strength criterion for saturated soils. In applying Equation (2) to unsaturated soils, the shear strength component due to matric suction, that is (ua – uw) tanφb, is masked as the cohesion intercept, c = (c′ + ( ua – uw)tanφb). Therefore, the cohesion intercept, c, in residual soils appear to vary widely [23]. [24] noted the increase of water absorption with wea- thering grade. [25] found that micro-morphological fea- tures in kaolinitic soils were related to compaction, in- creased tensile strength, penetrometer resistance, bulk den- sity and hard setting behaviour. 6. Laboratory Practices Results Laboratory tests were performed to determine 32 clayey sand soils’s engineering characterization during five mon- ths period. The percentages of liquid limit, plastic limit and plasticity index of the samples taken from the site are plotted against resistivity and moisture content. Note that, the resistivity of the soil samples increase with the de- creasing of the moisture content percentage. Figure 1 shows the correlation of the resistivity and the moisture content of the clayey sandy soil is and regression coefficient, R² was approximately 0.504. 1 For the empirical correlation between resistivity and internal friction angle, 0.03 1378.0e for undisturbed clayey sand soils is 0.101 C 167.0e and the regression coefficient, R² was approximately 0.647 as shown in Figure 2. It shows that internal friction angle is inversely proportio- nal to the resistivity of samples. In Figure 3, the empirical correlation between resis- tivity, ρ and undisturbed soil’s effective cohesion, C’ for clayey sand soils is found as: and re- gression coefficient, R² was approximately 0.664. Meanwhile, Figure 4 shows the empirical correlations Figure 1. Empirical correlation of resistivity, (ρ) and mois- ture content, (W) of 32 clayey sand soil samples. Figure 2. The empirical correlation between resistivity, (ρ) and internal friction angle, of undisturbed clayey sand soil samples. Figure 3. The empirical correlation between resistivity, (ρ) and effective cohesion, C′ of undisturbed clayey sand soil samples. Figure 4. The empirical correlation of void ratio, (e), poros- ity, (n) and degree of saturation (S) with resistivity, (ρ) of clayey sand soil samples. Copyright © 2012 SciRes. IJG 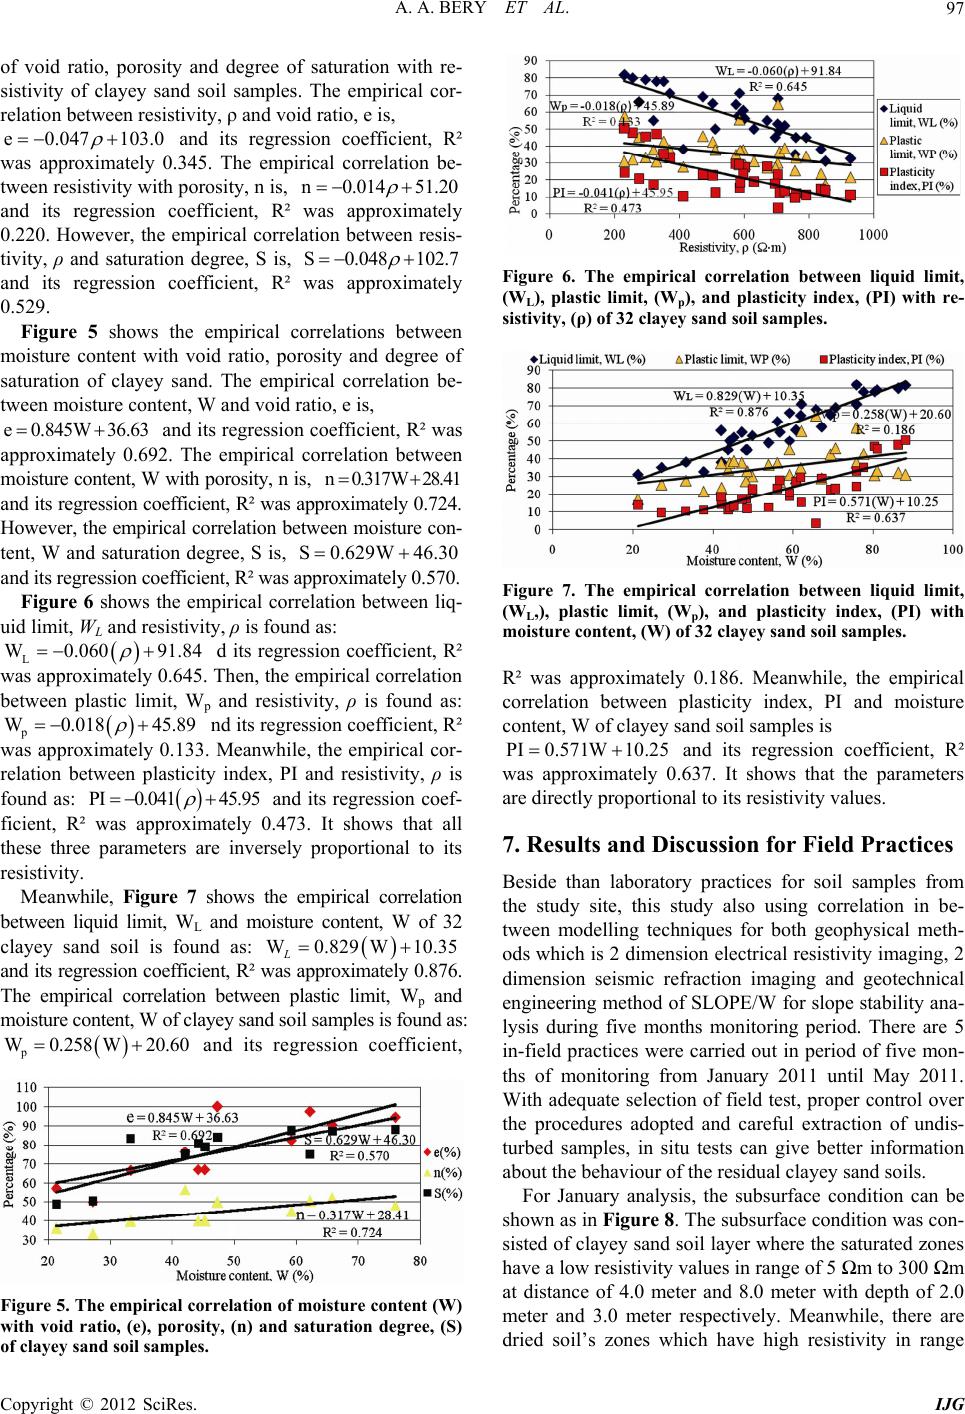 A. A. BERY ET AL. 97 of void ratio, porosity and degree of saturation with re- sistivity of clayey sand soil samples. The empirical cor- relation between resistivity, ρ and void ratio, e is, e0.047 103.0 .01451.20 and its regression coefficient, R² was approximately 0.345. The empirical correlation be- tween resistivity with porosity, n is, n 0 S 0 .048 102.7 and its regression coefficient, R² was approximately 0.220. However, the empirical correlation between resis- tivity, ρ and saturation degree, S is, 845W 36.63 0.317W 28.41 .629W 46.30 91.84 and its regression coefficient, R² was approximately 0.529. Figure 5 shows the empirical correlations between moisture content with void ratio, porosity and degree of saturation of clayey sand. The empirical correlation be- tween moisture content, W and void ratio, e is, and its regression coefficient, R² was approximately 0.692. The empirical correlation between moisture content, W with porosity, n is, and its regression coefficient, R² was approximately 0.724. However, the empirical correlation between moisture con- tent, W and saturation degree, S is, and its regression coefficient, R² was approximately 0.570. e 0. n S 0 Figure 6 shows the empirical correlation between liq- uid limit, WL and resistivity, ρ is found as: L d its regression coefficient, R² was approximately 0.645. Then, the empirical correlation between plastic limit, Wp and resistivity, ρ is found as: W 0.060 p nd its regression coefficient, R² was approximately 0.133. Meanwhile, the empirical cor- relation between plasticity index, PI and resistivity, ρ is found as: and its regression coef- ficient, R² was approximately 0.473. It shows that all these three parameters are inversely proportional to its resistivity. W 0.018 PI 45.89 041 45.95 W 10.35 0. Meanwhile, Figure 7 shows the empirical correlation between liquid limit, WL and moisture content, W of 32 clayey sand soil is found as: and its regression coefficient, R² was approximately 0.876. The empirical correlation between plastic limit, Wp and moisture content, W of clayey sand soil samples is found as: W 0.829 L p W 0.258W 20.60 and its regression coefficient, Figure 5. The empirical correlation of moisture content (W) with void ratio, (e), porosity, (n) and saturation degree, (S) of clayey sand soil samples. Figure 6. The empirical correlation between liquid limit, (WL), plastic limit, (Wp), and plasticity index, (PI) with re- sistivity, (ρ) of 32 clayey sand soil samples. Figure 7. The empirical correlation between liquid limit, (WL,), plastic limit, (Wp), and plasticity index, (PI) with moisture content, (W) of 32 clayey sand soil samples. R² was approximately 0.186. Meanwhile, the empirical correlation between plasticity index, PI and moisture content, W of clayey sand soil samples is PI0.571W10.25 and its regression coefficient, R² was approximately 0.637. It shows that the parameters are directly proportional to its resistivity values. 7. Results and Discussion for Field Practices Beside than laboratory practices for soil samples from the study site, this study also using correlation in be- tween modelling techniques for both geophysical meth- ods which is 2 dimension electrical resistivity imaging, 2 dimension seismic refraction imaging and geotechnical engineering method of SLOPE/W for slope stability ana- lysis during five months monitoring period. There are 5 in-field practices were carried out in period of five mon- ths of monitoring from January 2011 until May 2011. With adequate selection of field test, proper control over the procedures adopted and careful extraction of undis- turbed samples, in situ tests can give better information about the behaviour of the residual clayey sand soils. For January analysis, the subsurface condition can be shown as in Figure 8. The subsurface condition was con- sisted of clayey sand soil layer where the saturated zones have a low resistivity values in range of 5 Ωm to 300 Ωm at distance of 4.0 meter and 8.0 meter with depth of 2.0 meter and 3.0 meter respectively. Meanwhile, there are dried soil’s zones which have high resistivity in range Copyright © 2012 SciRes. IJG 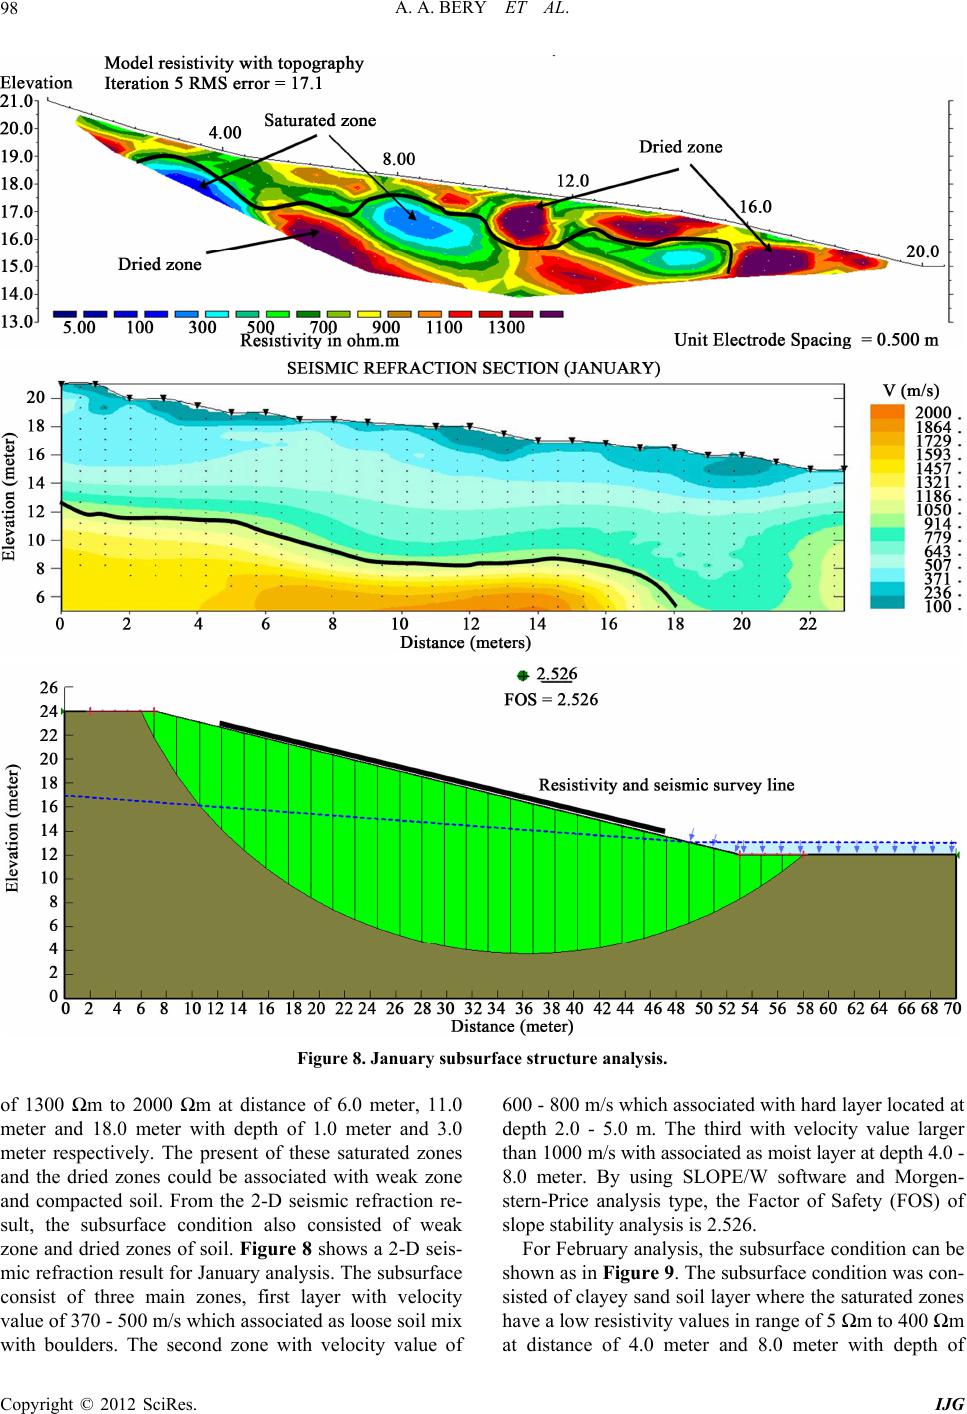 A. A. BERY ET AL. Copyright © 2012 SciRes. IJG 98 Figure 8. January subsurface structure analysis. of 1300 Ωm to 2000 Ωm at distance of 6.0 meter, 11.0 meter and 18.0 meter with depth of 1.0 meter and 3.0 meter respectively. The present of these saturated zones and the dried zones could be associated with weak zone and compacted soil. From the 2-D seismic refraction re- sult, the subsurface condition also consisted of weak zone and dried zones of soil. Figure 8 shows a 2-D seis- mic refraction result for January analysis. The subsurface consist of three main zones, first layer with velocity value of 370 - 500 m/s which associated as loose soil mix with boulders. The second zone with velocity value of 600 - 800 m/s which associated with hard layer located at depth 2.0 - 5.0 m. The third with velocity value larger than 1000 m/s with associated as moist layer at depth 4.0 - 8.0 meter. By using SLOPE/W software and Morgen- stern-Price analysis type, the Factor of Safety (FOS) of slope stability analysis is 2.526. For February analysis, the subsurface condition can be shown as in Figure 9. The subsurface condition was con- sisted of clayey sand soil layer where the saturated zones have a low resistivity values in range of 5 Ωm to 400 Ωm at distance of 4.0 meter and 8.0 meter with depth of 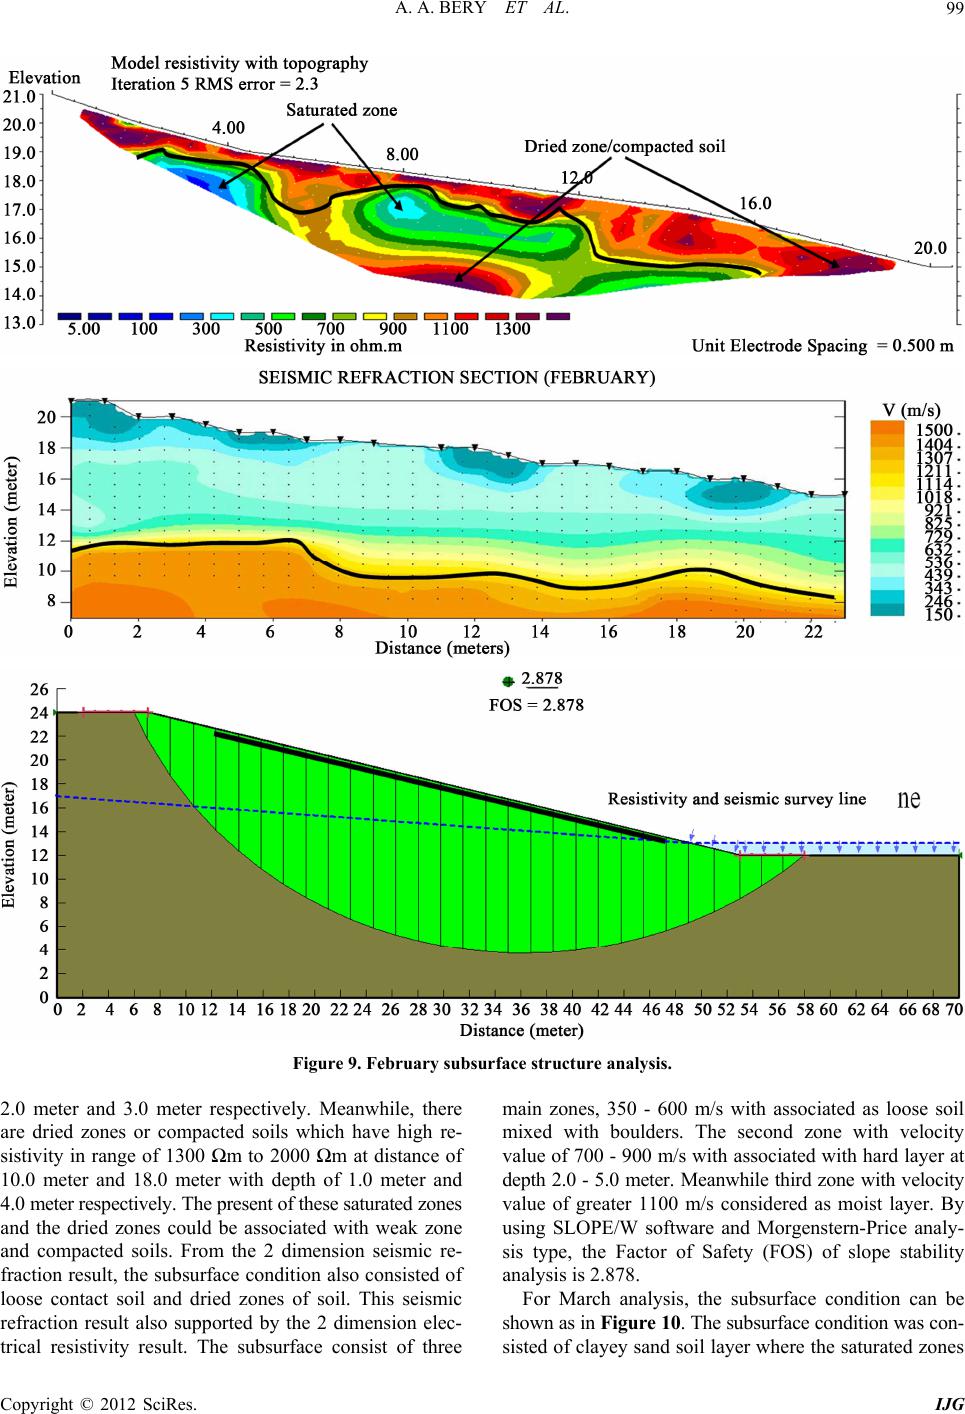 A. A. BERY ET AL. 99 Figure 9. February subsurface structure analysis. 2.0 meter and 3.0 meter respectively. Meanwhile, there are dried zones or compacted soils which have high re- sistivity in range of 1300 Ωm to 2000 Ωm at distance of 10.0 meter and 18.0 meter with depth of 1.0 meter and 4.0 meter respectively. The present of these saturated zones and the dried zones could be associated with weak zone and compacted soils. From the 2 dimension seismic re- fraction result, the subsurface condition also consisted of loose contact soil and dried zones of soil. This seismic refraction result also supported by the 2 dimension elec- trical resistivity result. The subsurface consist of three main zones, 350 - 600 m/s with associated as loose soil mixed with boulders. The second zone with velocity value of 700 - 900 m/s with associated with hard layer at depth 2.0 - 5.0 meter. Meanwhile third zone with velocity value of greater 1100 m/s considered as moist layer. By using SLOPE/W software and Morgenstern-Price analy- sis type, the Factor of Safety (FOS) of slope stability analysis is 2.878. For March analysis, the subsurface condition can be shown as in Figure 10. The subsurface condition was con- sisted of clayey sand soil layer where the saturated zones Copyright © 2012 SciRes. IJG 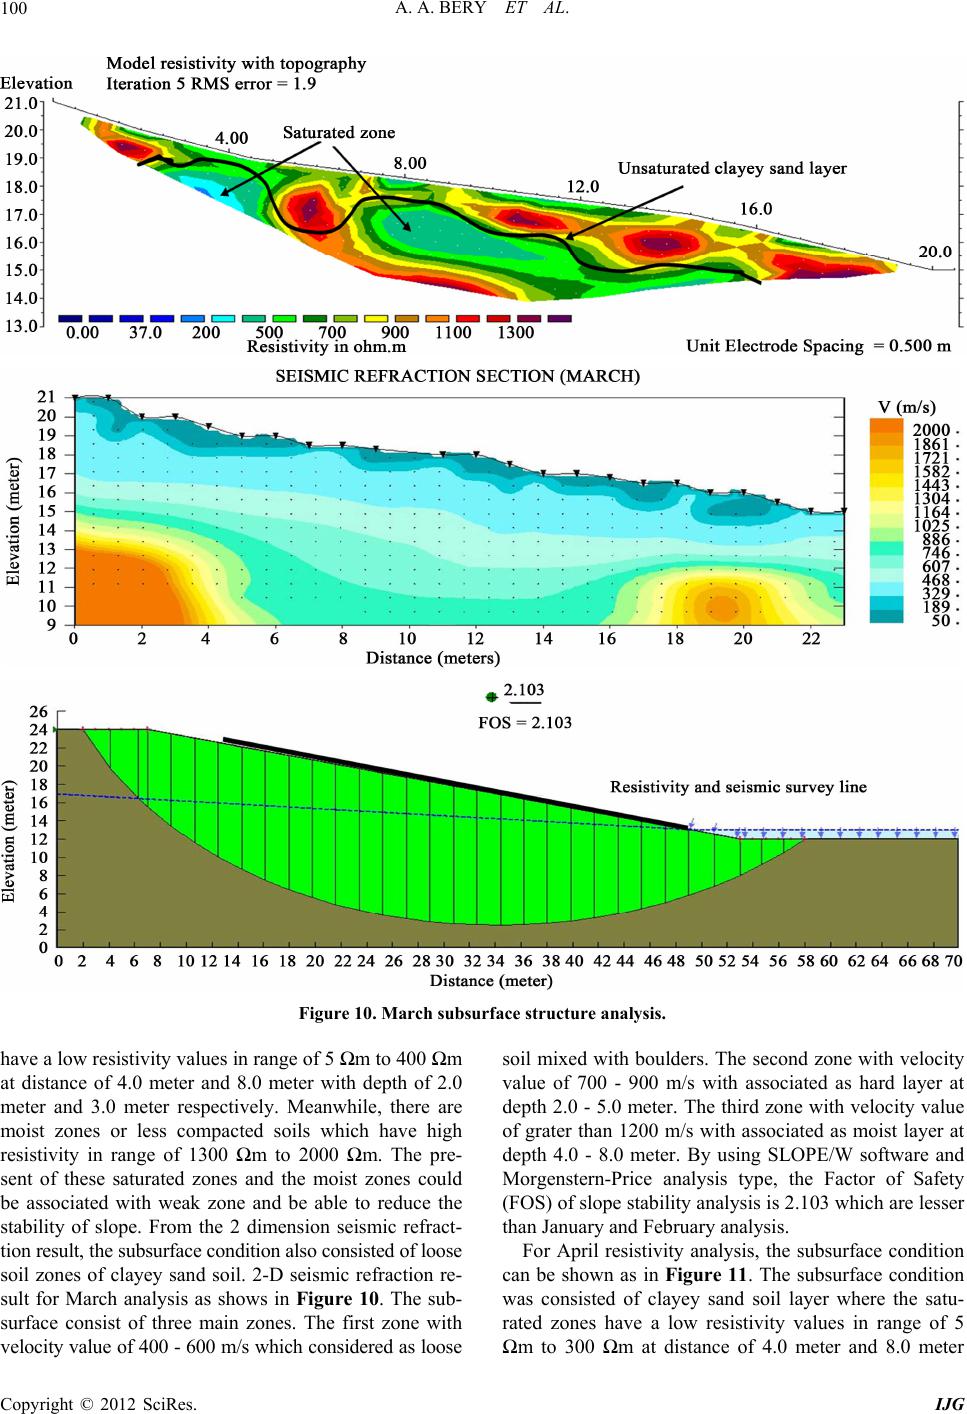 A. A. BERY ET AL. 100 Figure 10. March subsurface structure analysis. ave a low resistivity values in range of 5 Ωm to 400 Ωm soil mixed with boulders. The second zone with velocity w h at distance of 4.0 meter and 8.0 meter with depth of 2.0 meter and 3.0 meter respectively. Meanwhile, there are moist zones or less compacted soils which have high resistivity in range of 1300 Ωm to 2000 Ωm. The pre- sent of these saturated zones and the moist zones could be associated with weak zone and be able to reduce the stability of slope. From the 2 dimension seismic refract- tion result, the subsurface condition also consisted of loose soil zones of clayey sand soil. 2-D seismic refraction re- sult for March analysis as shows in Figure 10. The sub- surface consist of three main zones. The first zone with velocity value of 400 - 600 m/s which considered as loose value of 700 - 900 m/s with associated as hard layer at depth 2.0 - 5.0 meter. The third zone with velocity value of grater than 1200 m/s with associated as moist layer at depth 4.0 - 8.0 meter. By using SLOPE/W software and Morgenstern-Price analysis type, the Factor of Safety (FOS) of slope stability analysis is 2.103 which are lesser than January and February analysis. For April resistivity analysis, the subsurface condition can be shown as in Figure 11. The subsurface condition as consisted of clayey sand soil layer where the satu- rated zones have a low resistivity values in range of 5 Ωm to 300 Ωm at distance of 4.0 meter and 8.0 meter Copyright © 2012 SciRes. IJG 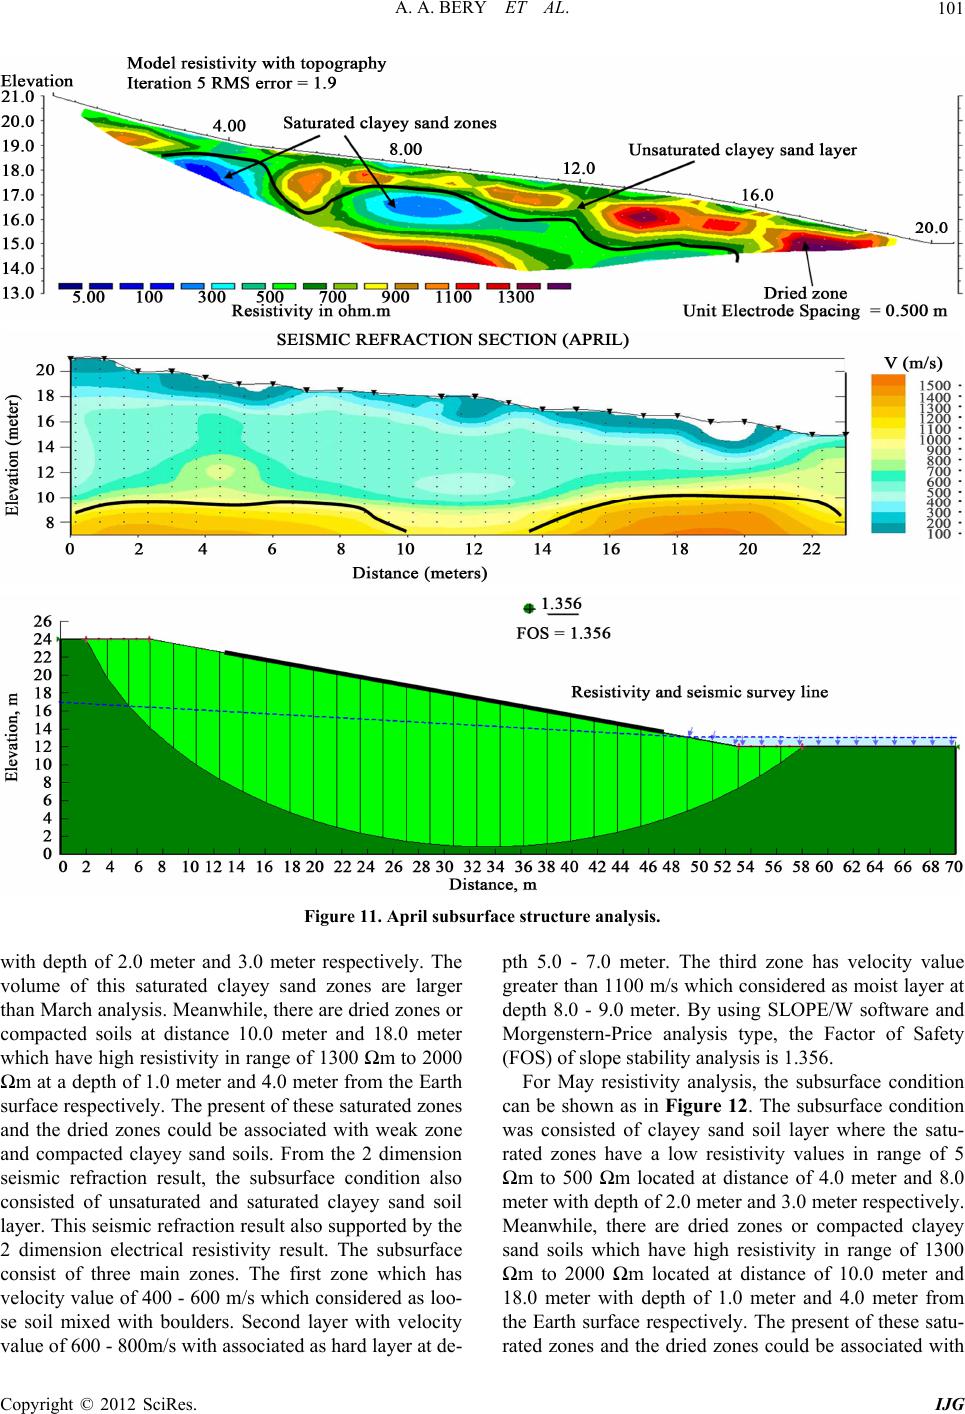 A. A. BERY ET AL. 101 Figure 11. April subsurface structure analysis. with depth of 2.0 meter and 3.0 met olume of this saturated clayey sand zones are larger The third zone has velocity value greater than 1100 m/s which considered as moist layer at in range of 5 Ω er respectively. The pth 5.0 - 7.0 meter. v than March analysis. Meanwhile, there are dried zones or compacted soils at distance 10.0 meter and 18.0 meter which have high resistivity in range of 1300 Ωm to 2000 Ωm at a depth of 1.0 meter and 4.0 meter from the Earth surface respectively. The present of these saturated zones and the dried zones could be associated with weak zone and compacted clayey sand soils. From the 2 dimension seismic refraction result, the subsurface condition also consisted of unsaturated and saturated clayey sand soil layer. This seismic refraction result also supported by the 2 dimension electrical resistivity result. The subsurface consist of three main zones. The first zone which has velocity value of 400 - 600 m/s which considered as loo- se soil mixed with boulders. Second layer with velocity value of 600 - 800m/s with associated as hard layer at de- depth 8.0 - 9.0 meter. By using SLOPE/W software and Morgenstern-Price analysis type, the Factor of Safety (FOS) of slope stability analysis is 1.356. For May resistivity analysis, the subsurface condition can be shown as in Figure 12. The subsurface condition was consisted of clayey sand soil layer where the satu- rated zones have a low resistivity values m to 500 Ωm located at distance of 4.0 meter and 8.0 meter with depth of 2.0 meter and 3.0 meter respectively. Meanwhile, there are dried zones or compacted clayey sand soils which have high resistivity in range of 1300 Ωm to 2000 Ωm located at distance of 10.0 meter and 18.0 meter with depth of 1.0 meter and 4.0 meter from the Earth surface respectively. The present of these satu- rated zones and the dried zones could be associated with Copyright © 2012 SciRes. IJG 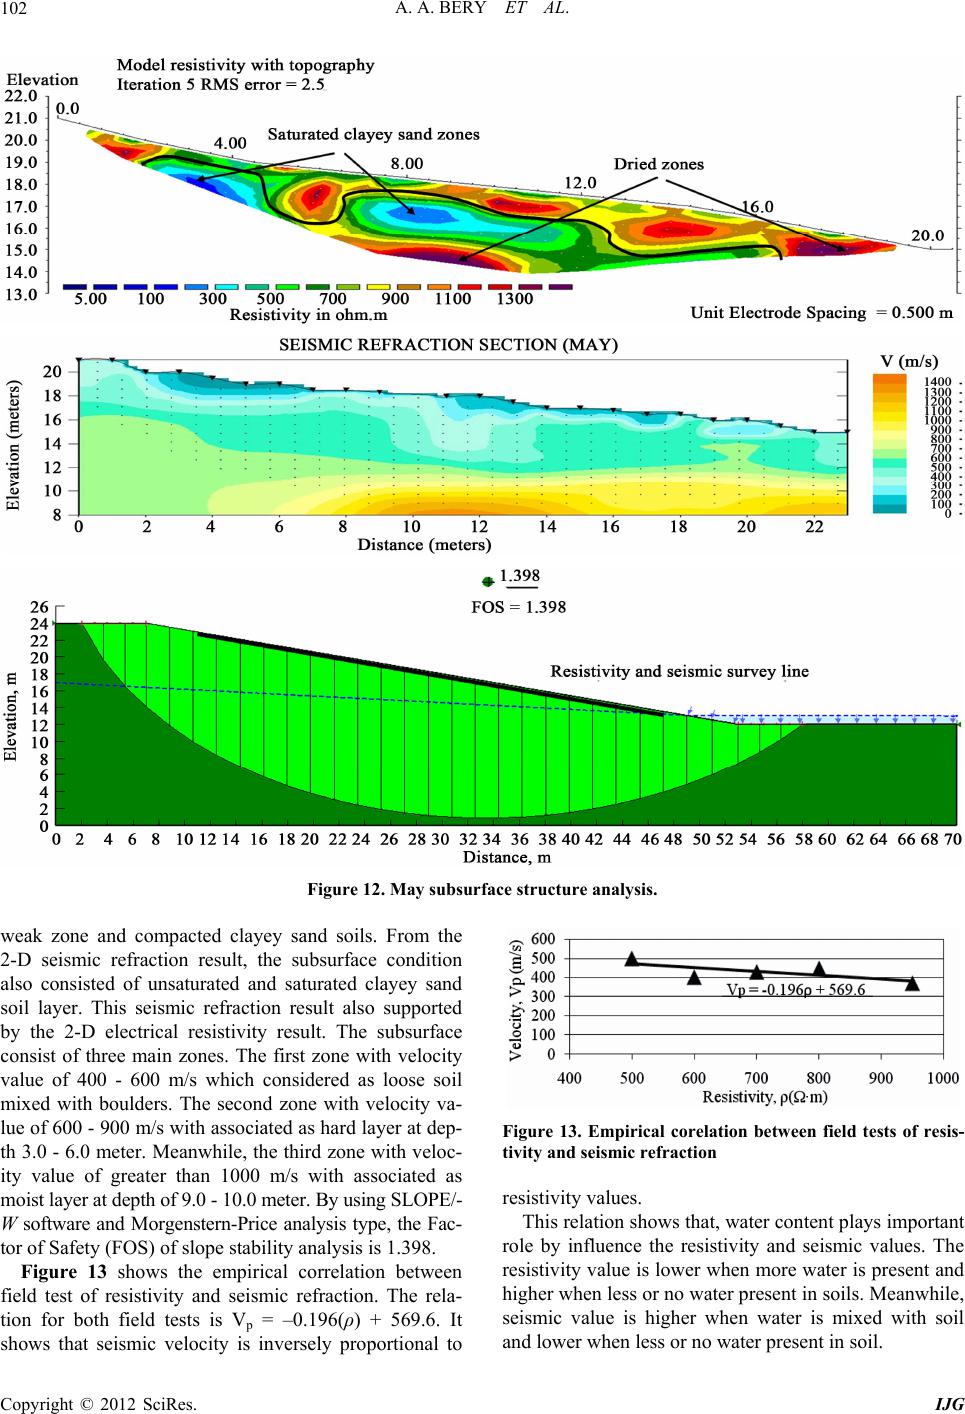 A. A. BERY ET AL. 102 Figure 12. May subsurface structure analysis. weak zone and compacted clayey sand soils. From the 2-D seismic refraction result, the su lso consisted of unsaturated and saturated clayey sand It sh bsurface condition a soil layer. This seismic refraction result also supported by the 2-D electrical resistivity result. The subsurface consist of three main zones. The first zone with velocity value of 400 - 600 m/s which considered as loose soil mixed with boulders. The second zone with velocity va- lue of 600 - 900 m/s with associated as hard layer at dep- th 3.0 - 6.0 meter. Meanwhile, the third zone with veloc- ity value of greater than 1000 m/s with associated as moist layer at depth of 9.0 - 10.0 meter. By using SLOPE/- W software and Morgenstern-Price analysis type, the Fac- tor of Safety (FOS) of slope stability analysis is 1.398. Figure 13 shows the empirical correlation between field test of resistivity and seismic refraction. The rela- tion for both field tests is Vp = –0.196(ρ) + 569.6. Figure 13. Empirical corelation between field tests of resis- tivity and seismic refraction resistivity values. This relation shows that, water content plays important role by influence the resistivity and seismic values. Th r present in soils. Meanwhile, ismic value is higher when water is mixed with soil s or no water present in soil. ows that seismic velocity is inversely proportional to e resistivity value is lower when more water is present and higher when less or no wate se and lower when les Copyright © 2012 SciRes. IJG  A. A. BERY ET AL. 103 8. nteg ring and ivity and t and particles and moisture content. ing of soil cements. nditions. Electrical ationa ineering (Geotropika), K 2008. [3] A. A. Bery, RN. A. Ismail, eophysical Investigation of a Conclusions and Recommendation Soil behaviour of clayey sand soils study is difficult and challenging study especially for monitoring and investi- gative techniques. In this research, two technical techni- ques were used in purpose of monitoring and investigate the physical characterizations of study area. The irated Large Landslide in Glaciolacustrine Clays in the Trieves Area (French Alps),” Engineering Geology, Vol. 109, No. 1-2, 2009, pp. 45-56. study of the physical environment with monito investigative techniques by using electrical resist seismic refraction surveys with engineering laboratory prac- tices for soil samples collected from the investigated area is succeed in reaching the objectives of this research. Generally, after analyzing the data obtained collecti- vely from 32 samples of clayey sand soil within five mon- ths monitoring period located on Batu Uban area of Pen- ang Island, the following conclusions and recommenda- tions are made. The moisture content can influence the soil’s strength and resistivity values. The present of moisture conten can reduce the soil’s strength (Ø') by lose its soil par- ticles chain and it also able to increase the soil’s con- ductivity. Shear strength of this soil is determined by the angu- larity of the s The moisture content significantly modifies their strength (Ø'). As moisture increase—strength de- creases. This is because increasing moisture content cause greater separation of soil particles and further, causes soften The empirical correlations models in this study are successfully determine to show strong correlations with granitic residual soils of Batu Uban area which significant to tropical clayey sand soil’s behaviour. The electrical resistivity and seismic refraction surveys which were used in this study on the test site, delivered a detailed image of the near-surface co resistivity and seismic refraction resolution analysis proved that a combination of these integrated study of the phy- sical environment data provided a reasonable compromise between measurement time and image resolution. REFERENCES [1] R. J. Small and M. J. Clark, “Slope and Weathering,” Cambridge University Press, Cambridge, 1982. [2] R. Z. Abidin and B. Sujak, “Relationship between Rain- fall and Landslide Events in Malaysia,” Intern Conference on Geotechnical and Highway Eng l uala Lampur, 26-27 May . Saad, N. M. Mustaza, N. El Hidayah Ismail and E. Tonnizam, “Slope Stability Analy- sis via Soil’s Geotechnical Properties and Its Geophysical Characterizations,” National Geoscience Conference, Ma- laysia, 11-12 June 2011. [4] B. Heincke, T. Gunther, E. Dalsegg, J. S. Ronning, G. V. Ganerod and H. Elvebakk, “Combined Three Dimen- sional Electrical and Seismic Tomography Studies on the Anknes Rockslide in Western Norway,” Journal of Ap- plied Geophysics, in press. [5] D. Jongmans, G. Bievre, F. Renalier, S. Schwartz, N. Beauresz and Y. Orengo, “G doi:10.1016/j.enggeo.2008.10.005 [6] S. Thevanayagam and G. R. Martin, “Liquefaction in Silty Soils—Screening and Remediation Issues,” Soil Dynamics and Earthquake Engineering, Vol. 22, No. 9-12, 2002, pp. 1035-1042. doi:10.1016/S0267-7261(02)00128-8 [7] V. C. Xenaki and G. A. Athanasopoulos, “Liquefaction Resistance of Sand-Silt Mixtures: An Experimental In- vestigation of the Effect of Fines,” Soil Dynamics and Earthquake Engineering, Vol. 23, No. 3, 2003, pp. 183- 194. doi:10.1016/S0267-7261(02)00210-5 [8] S. A. Naeini and M. H. Baz on Steady-State Strength of Mixed an iar, “Effect of Fines Content d Layered Samples of Sand,” Soil Dynamics and Earthquake Engineering, Vol. 24, No. 3, 2004, pp. 181-187. doi:10.1016/j.soildyn.2003.11.003 [9] P. V. Lade, C. D. Liggio Jr. and J. A. Yamamuro, “Ef- fects of Non-Plastic Fines on Minimum and Maximum Void Ratios of Sand,” Geotechnical Testing Journal, Vol. 21, No. 4, 1998, pp. 336-347. doi:10.1520/GTJ11373J [10] B. O. Hardin, “1-D Strain in Normally Consolidated Co- hesionless Soils,” Journal of Geo Division, Vol. 113, No. 12, 1987, pp technical Engineering . 1449-1467. doi:10.1061/(ASCE)0733-9410(1987)113:12(1449) [11] J. M. Pestana and A. J. Whittle, “Compression Model for Cohesionless Soils,” Geotechnique, Vol. 45, No. 4, 1995, pp. 611-631. doi:10.1680/geot.1995.45.4.611 [12] J. A. Yamamuro, P. A. Bopp and P. V. Lade, “One Di- mensional Compression of Sands at High Pressures,” Journal of Geotechnical Engineering, Vol. 122, 1996, pp. 147-154. No. 2, doi:10.1061/(ASCE)0733-9410(1996)122:2(147) [13] F. A. Chuhan, A. Kjeldstad, K. Bjorlykke and K. Hoeg, “Experimental Compression of Loose Sands: Relevance to Porosity Reduction during Burial in Sedimentary Ba- sins,” Canadian Geotechnical Journal, Vol. 40, No. 5, 2003, pp. 995-1011. doi:10.1139/t03-050 [14] F. David, “Essential Basic Geotechnics,” 6th Edition, Pearson Educati s of Soil Mechanics and Foundations on, Up- . 29-40. per Saddle River, 2007. [15] A. Shakoor and E. H. Barefild, “Relationship between Unconfined Compressive Strength and Degree of Satura- tion for Selected Sandstones,” Environmental and Engi- neering Geoscience, Vol. 15, No. 1, 2009, pp doi:10.2113/gseegeosci.15.1.29 [16] B. Vásárhelyi and P. Ván, “Influence of Water Content on the Strength of Rock,” Engineering Geology, Vol. 84, No. 1-2, 2006, pp. 70-74. doi:10.1016/j.enggeo.2005.11.011 [17] M. Romana and B. Vásárhelyi, “A Discussion on the Decrease of Unconfined Compressive Strength between Copyright © 2012 SciRes. IJG  A. A. BERY ET AL. Copyright © 2012 SciRes. IJG 104 urnal of Engineering Sci- ngineering, Vol. 1, 1977, pp. . 31, No. 2, 1981, pp. 181-213. Saturated and Dry Rock Samples,” Polytechnic Uni sity of Valencia, Spain, 2007. ver- [18] E. Barefield and A. Shakoor, “The Effect of Degree of Saturation on the Unconfined Compressive Strength of Selected Sandstones,” International Association for En- gineering Geology and the Environment, The Geological Society of London, 2006. [19] A. Namdar, “Mineralogy in Geotechnical Engineering. Mysore University, India,” Jo ence and Technology Review, Vol. 3, No. 1, 2010, pp. 108-110. [20] T. C. Kenney, “Residual Strength of Mineral Mixtures,” Proceedings 9th International Conference on Soil Me- chanics and Foundation E 155-160. [21] J. K. Lupini, A. E. Skinner and P. R. Vaughan, “The Drained Residual Strength of Cohesive Soils,” Geotech- nique, Vol doi:10.1680/geot.1981.31.2.181 [22] J. H. Yin, “Properties and Behaviour of Hong Kong Ma- rine Deposits with Different Clay Contents,” Canadian Geotechnical Journal, Vol. 36, No. 6, 19 1095. 99, pp. 1085- on and Engineering Properties of Natural Soils, o. 1, 2008, pp. 137-144. 61(02)00333-6 [23] H. Rahardjo, E. C. Leong and S. K. Tang, “Characterisa- tion and Engineering Properties of Singapore Residual Soils,” Proceeding of Specialty Workshop on Charac- terisati National University of Singapore, Singapore, 2003, pp. 1279-1304. [24] E. Tonnizam, I. Komoo, K. A. Kassim and N. Gofar, “Influence of Moisture Content on the Strength of Weath- ering Sandstone,” Malaysian Journal of Civil Engineer- ing, Vol. 20, N [25] N. Fabiola, B. Giarola, A. P. da Silva, S. Imhoff and A. R. Dexter, “Contribution of Natural Soil Compaction on Hardsetting Behaviour,” Geoderma, Vol. 113, No. 1-2, 2003, pp. 95-108. doi:10.1016/S0016-70
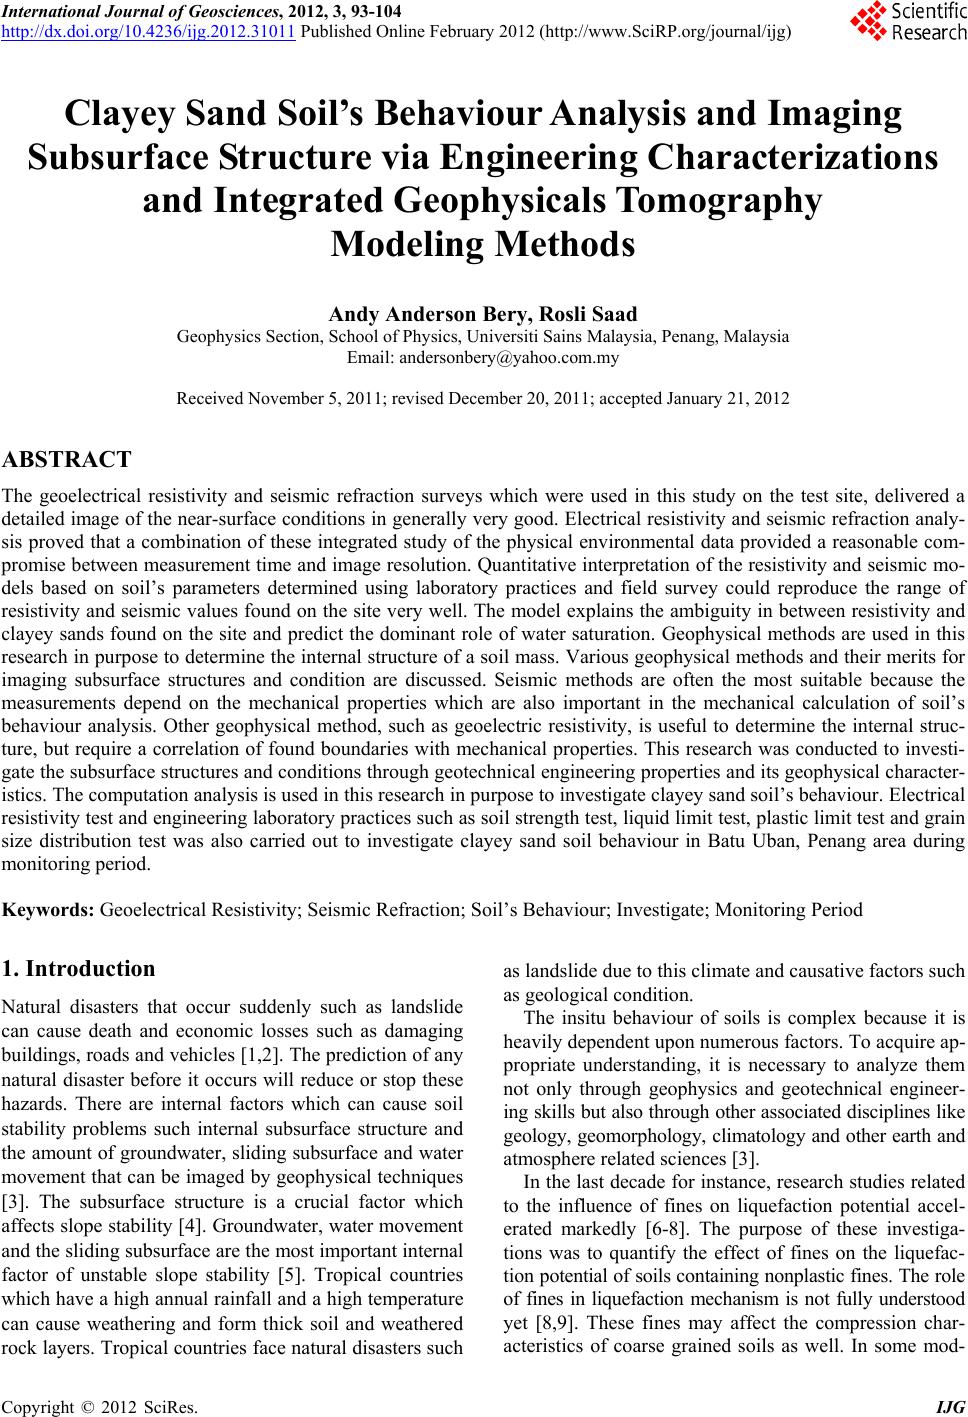
|