 International Journal of Geosciences, 2012, 3, 50-61 http://dx.doi.org/10.4236/ijg.2012.31007 Published Online February 2012 (http://www.SciRP.org/journal/ijg) Evaluation of Quality of Some Rehabilitated Mined Soils within the AngloGold-Ashanti Concession in Ghana Witmann H. K. Dorgbetor1, Gabriel N. N. Dowuona1, Seth K. A. Danso1, Julius K. Amatekpor1, Ayoade O. Ogunkunle2, Enoch Boateng3 1Department of Soil Scien ce, School of Agriculture, University of Ghana, Legon, Ghana 2Department of Agronomy, University of Ibadan, Ibadan, Nigeria 3Soil Research Institute, Accra Centre, Accra, Ghana Email: gdowuona30@hotmail Received December 23, 2011; revised January 15, 2012; accepted January 31, 2012 ABSTRACT Land degradation caused by surface mining of gold has been extensive in Ghana. In recent years rehabilitation of some degraded lands b y re-vegetatio n ha s been und ertaken. Th is stu dy p rovid es q uantitativ e data o n the qu ality o f so me reha- bilitated and un-rehab ilitated mined soils within the AngloGold-Ashanti gold concession in parts of the semi-deciduous forest zone of Ghana. Soil properties determined included texture, bulk density and aggregate stability, pH, organic carbon, available phosphorus, total nitrogen, cation exchange capacity, exchangeable bases, exchange acidity, Fe, Mn, Ni, Cu, Zn, Cd, and Pb. Aggregate stability as a physical quality indicator revealed that aggregates of the rehabilitated mined soil had become more stable and similar to the control unmined soil due to litter and carbon additions from planted trees. The nutrient levels were very low because of the presence of low activity clays inherent in the native soil. Organic carbon content in the rehabilitated soil had increased above that of the unrehabilitated soil. Variability in soil properties, especially org anic carbon and aggr egate stability, was minimal in the unmined and rehabilitated so ils imply- ing that soils at the two sites were most robust and resistant to crushing and rup ture. Quality index of the unmined con- trol soil was 36.5% indicatin g that the quality of the so il was 63.5% relative to the optimum qu ality because of inh erent poor soil properties. The mined rehabilitated and unrehabilitated soil had index values of 32.5% and 24.4%, respec- tively. The marginal difference of 4 % in soil quality between the control and reh abilitated soil shows that it is possible to maintain the health of soils with inherent physical and biochemical deficiencies if reclamation regulations are ad- hered to. In this way, the socio-economic dilemma of exploiting natural resources for the benefit of societies is amelio- rated while maintaining an eco system balance. Keywords: Aggregate Stability; Mean Weight Diameter; Mined Soils; Soil Rehabilitation; Soil Variability; Soil Quality Index 1. Introduction Some countries in West Africa including Ghana are en- dowed with enormous deposits of mineral resources. In Ghana gold ranks as the most extensively mined chiefly because it is highly priced and every effort is made to increase output. The system of mining in the past, which was dominated by either underground shafts or by small- scale gold mining, had little impact on the environment. However, gold mining today is mostly from the surface; this involves stripp ing the vegetatio n and topso il, digging up of huge open pits, blasting of gold-bearing ores and dripping of cyanide through massive piles of the gold ore to extract the precious mineral. The operation destroys farmlands and endangers water resources of the mining communities. Complaints about mining-related land degradation and agitations from local people are based on experiences of health hazards from chemical spillages into local water bodies and contamination or destruction of quality of the soil environment. Consequently, rural farming communi- ties in major mining areas have had confrontations with mining companies over right of access to lands or for destruction of the ecosystem. This concern is informed by empirical evidence elsewhere [1-4]. Bioavailable concentrations of heavy metals may be- come higher than the permitted critical levels [5-7] in mine-degraded soils. With time, the concentrations ad- versely affect soil-plant relations, water quality, buffer- ing capacities, availability of nutrients and water to plants and soil microbes, mobility of contaminants and certain physical factors including crusting. Chemicals such as cyanide that directly kill or impair soil microbes also reduce soil quality and a decline in soil quality C opyright © 2012 SciRes. IJG  W. H. K. DORGBETOR ET AL. 51 means a decline in the functions of soil and making life unsustaina bl e [ 8- 10]. Mining operations generally take up farmlands, dis- lodge communities and cause socio-economic problems including poverty and migration. Important positive cha- nges in soil quality, however, occur if rehabilitation is undertaken which enables farmers to re-use the land for improvement in their well-being. It has been noted that mining by its nature presents both positive and negative impact on an area and the role of policy makers should be to mitigate or prevent the negatives while promoting the positives [11]. To achieve this goal, necessary pre- requisites for post-closure sustainable development must be put in place while policy makers, industry and other stakeholders such as researchers monitor environmental quality. Although rehabilitation of mined lands could meet the major goal of sustainability, evaluation of the extent of reclamation or rehabilitation remains the great- est challenge. Furthermore, a method for measuring suc- cessful reclamation has been difficult, elusive and sub- jective [12]. To address this problem, various approaches have been developed to evaluate soil quality because consensus has not been reached on which is the best. Be that as it may, soil quality can b e measured in many ways depending on the criteria selected [13]. Ecological approach to sus- tainability incorporates resilience and requires diversity so that ecological restoration of mined land could repre- sent the best approach to ensuring sustainabilit y and mai- ntenance of biodiversity. A reclaimed land could meet the major goal of sustainability, which is the land use options, for future generations [14]. Therefore, for rec- lamation to be ecologically sustainable, it should be as- sessed according to ecological p rinciples such as stability of soils and nutrient cycling, vegetation establishment and animal recolonization [15]. Various soil quality index models [13,16,17] attem- pted to integrate information from multiple indicators to arrive at single values that indicate the level of soil qu al- ity. However, soil indicators that are predominantly site specific in predicting soil quality as a function of meas- ured soil properties are of little use as a routine assess- ment tool [18]. To quantitatively assess the potential im- pacts of changes in soil p roperties on the health of forest soils, it is better to develop a soil quality index that inte- grates the measured physical and chemical parameters of the soil into a single parameter that could be used as an indicator of overall forest soil quality [18]. Nevertheless, application of this model to assess the quality of degr- aded soil after their rehabilitation is very rare, especially in mine-degraded tropical forest soils. The Environmental Impact Assessment Laws of Ghana require all mining-affected areas to be returned to the community in physically and bio-chemically safe and stable condition. In accordance with these regulations, the mining companies h a ve embarked on rehabilitation of mined lands to restore biodiversity after exploiting the mineral wealth. In spite of these regulations, quantitativ e data on the success or impact of the restoration are very limited. It is therefore necessary to provide relevant data through research to ensure that remediated lands attain high quality status. This study therefore evaluates quan- titatively the quality of some rehabilitated mined soils within the AngloGold-Ashanti concession in the semi- deciduous zone of Ghana using a quality index [18]. 2. Materials and Methods 2.1. Site Characteristics, Soils and Sampling The study area is located within the land concession of Anglogold Ashanti mines, a major gold mining conces- sion at Obuasi in the semi-deciduous forest zone of Ghana (Figure 1). The climate with a bi-modally distrib- uted annual rainfall of 1600 mm and a mean annual tem- perature of 28˚C is characterized by distinct seasons and is controlled primarily by the tropical continental, as well as the tropical maritime air mass. The study area is un- derlain predominantly by phyllites th at belong to ro cks of the Paleoproterozoic Birimian of Ghana. The rocks pro- duce similar soils at summits to upper slopes with eleva- tion of about 250 m (above sea level). The natural vege- tation of the region is the semi-deciduous forest ecology of Ghana characterized by the Celtic-Triplochiton Asso- ciation of plant species [19]. The dominant soil (Nzima series) at the study area oc- curs at upper slope position of the landscape and is clas- sified as Plinthic Acrisol or Typic Plinthustult. Quartz gravel and other rock fragments, as well as iron and manganese nodules, occur in most part of the soil profile. The drainage is moderately good and the groundwater level is considered very deep (lower than 150 cm). Five land use systems namely, one unmined site and four mined sites, were selected for the study. Preliminary investigations indicated that all the sites were degraded forest with similar landuse practice of shifting cultivation. The original forest was therefore replaced with the pre- sent vegetation which comprised a mosaic of fallow farmlands, thickets, secondary forests and forb regrowth. The umnined site was used as a control whereas the mined sites consisted of a 7-year old rehabilitated site with replanted vegetation made up of a mixture of origi- nal plants species and exotic leguminous trees such as Acacia and Leucaena (MR); a 4-year old rehabilitated site under cultivation (WRF); a site covered with subsoil material and topsoil but not replanted (MunReh); and a site covered with a subsoil material with no topsoil (Wdump). Th e s tu dy site on each landuse system was loc at ed a ft er Copyright © 2012 SciRes. IJG  W. H. K. DORGBETOR ET AL. Copyright © 2012 SciRes. IJG 52 Figure 1. Sketch map of parts of the AngloGold-Ashanti c onc ession showing the location of the study site s.  W. H. K. DORGBETOR ET AL. 53 series of test augering. Grid sampling was undertaken at each site. Each grid system covered an area of 10 m × 10 m (100 m2). Samples were collected from 20 cm depth at 2 m intervals along the midpoin t section of each grid line to assess variability in soil properties at each site. After the grid sampling, a modal profile was prepared at the centre of the control (unmined) site, characterized and soil samples collected. For the four mined sites, one pro- file pit (120 cm deep) was sited at the center of each grid system and samples collected to assess possible pe- dological variations after the rehabilitation, especially with respect to structural stability and particle size dis- tribution. The disturbed samples were used for analyses of selected physical and chemical properties whereas the undisturbed samples were used to determine bulk density and aggregate stability. 2.2. Laboratory Investigations Soil colour (moist) was determined using the Munsel Colour Chart. Particle size distribution of the soil was determined using the modified Bouyoucos Hydrometer Method [20]. The core method [21] was used to deter- mine bulk density. Aggreg ate stability of the undisturbed soils was measured by the dry sieving method [22]. A 100 g soil aggregate was placed on a nest of sieves with apertures of 2.0 mm - 1.0 mm, 1.0 mm - 0.5 mm, 0.5 mm - 0.25 mm, 0.25 mm - 0.106 mm and <0.106 mm in di- ameters. The nests of sieves were subjected to continuous shaking along 30 cm amplitude for 5 min using the elec- tronic shaker; the shaking was repeated also for 40 cm and 50 cm amplitudes for 10 min each. The dry-stable aggregate in each nest of sieves was determined as: Ma Mi*10 1 n *Xi*Wi Total SQIS individual soil property index v a lue Dry-stable aggregate % (1) where Ma is mass of the resistant aggregate and Mi is the initial dry weight of the aggregate before shaking. The mean weight diameter (MWD) of the structure aggregate was calculated using the following equation [23]. MWD (2) where Xi is the mean diameter of aggregates separated by sieving in the individual nest of sieves and Wi is the weight of the aggregate in a particular size range as a fraction of the initial dry weight of the aggregate ana- lyzed. Chemical properties analysed included soil pH, total nitrogen, available phosphorus [20], exchangeable bases and exchange acidity [25]. Effective CEC (ECEC) was determined from the sum of cations. Exchangeable Na percent (ESP) was calculated as a proportion of the ele- ment of ECEC. For the measurement of soil organic car- bon, the dry combustion meth od involving the use of the Carbon Analyzer was employed. The concentrations of Fe, Mn, Ni, Cu, Zn, Cd, and Pb in the soils were deter- mined on the AAS following extraction with 1 M NH4Cl. 2.3. Calculation of Soil Quality Index The soil quality model of Amacher et al. [18] was used to calculate the soil quality inde x of each landuse system. Analytical data generated from this study were compared to defined threshold levels; index values were assigned to each property to express soil adverse effects that are pos- sible or unlikely. The individual index values for all the properties measured for each landuse system were sum- med up to a total soil quality index (SQI) as: (3) The maximum value of the total SQI is 26 if all 19 so il properties are measured. The total SQI is then calculated as: SQI %Total SQImax. possible total SQI for properties measured100 (4) 2.4. Variability in Soil Properties Coefficient of variation (CV) was used to estimate the extent of variability in soil properties within each land use system. This was calculated as: (5) CV%s z*100 where s is the standard deviation and z is the mean of the population sample (36 samples for each study site). 3. Results and Discussion 3.1. Pedological Characteristics Examination of the modal profile of the undisturbed na- tive soil (Control) showed that it is deep and moderately well drained with moist soil colours that vary from dark brown (7.5YR 3/3) and brown (7.5YR 4/6) in the solum to yellowish red (5YR 4/6) in the parent material with a corresponding texture that changes from sandy clay loam at the surface to clay in the subsoil. The soil also has a structure which is crumbly in the topsoil but grades into subangular blocky throug hout the subsoil. Its consistenc e is moderately or slightly hard. Abundant fine and me- dium roots are found from the topsoil to about 50 cm deep. Large amounts of quartz gravel and rock fragments with iron and manganese concretions occur throughout the profile. All the sites are underlain by weathered phyl- lite (parent material) with similar characteristics prior to removal of the overburden layer for mining. The texture of the surface soils (0 cm - 20 cm) varies from sandy clay loam for the Control site, clay loam for the mined rehabilitated soil (MR), waste dump rehabili- tated soil (WRF) and mined unrehabilitated soil (Mun- Reh) to sandy clay loam for the waste dump unrehabili- Copyright © 2012 SciRes. IJG  W. H. K. DORGBETOR ET AL. 54 tated soil (Wdump). The proportions of the rock frag- ments and gravels in the mined soil pits are less than those found in the Control soil profile. The four mined soils at each respective site showed uniformity in colour variation namely, reddish brown to reddish yellow (MR), yellow red (WRF), yellow (Wdump) and reddish yellow to pink (MunReh). It is apparent that mixing of materials during the various rehabilitation processes influenced soil texture, amount of coarse fragments and soil colour, which were distinctly different from the unmined control soil. The colour and textural variations are characteristics worthy of pedological note. Soil colour of the unmined site (control) can serve as the standard for which all oth- ers were measured for their closeness to, or deviations from it. As indicated, the Control soil showed two prin- cipal colours, brown and shades of it in the upper section of the pit and a reddish colour at the lower portions. The rehabilitated soil (MR site) shows two broad colours namely, shades of brown at the upper portion and shades of yellow occupying the lower portion of the profile. Clearly, the impact of organic matter accumulation on the soil surface must account for the similarity in colours of the two soils at the soil surface. Subsoil colour of the at the Control site showed many years of development whereas the mined rehabilitated soil (MR) exhibited seven years of organic matter modification of a degraded layer of surface soil. Distribution of clay in the soils shows the presence of an argillic horizon in the control soil (Figure 2). However, this pedological feature was not displayed by soil from the four previously mined sites due to disturbance caused by removal of the soil material. Kaolinite is the dominant clay mineral in this soil [26]. Figure 2. Distribution of clay content in the soils. 3.2. Variations in Soil Physical Properties Physical properties such as topsoil depth, bulk density, porosity, aggregate stability, water content, soil strength, crushing and compaction of soil and water infiltration rate, which may change due to management practices, serve as indicators of soil quality. For this study, bulk density and aggregate stability which influence the other physi ca l pr operties was used to assess quality o f t h e s o i ls. The mean bulk density values are presented in Table 1. Bulk density values for the different sites were 1.73 Mg/m3 (Control), 1.63 Mg/m3 (MR), 1.69 Mg/m3 (WRF), 1.71 Mg/m3 (Wdump) and 1.61 Mg/m3 for MunReh. The relatively high bulk density values are consistent with the compact nature of the soil due the abundant rock frag- ments and concretions, especially in the control soil and indicate that the soils may pose problems for root estab- lishment. Generally, roots grow well in soils with bulk densities of up to 1.4 Mg/m3; root penetration begins to decline significantly at bulk densities above 1.7 Mg/m3 [27,28]. Aggregate stability values at selected amplitudes of vibration are presented in Figure 3. At amplitude of 30 cm there was almost no disruption of soil structural sta- bility which reflected in all the aggregates staying on the top sieve and almost none collecting in the pan at the base. At amplitude 40 cm, differences began to show and some of the aggregates showed crushing weakness but these differences were statistically insignificant for all the soils. All aggregates reduced in size because they became less stable. While mean size of aggregates from the rehabilitated site MR fell from 9 mm to 8 mm, those of the Control site and the WRF site fell from 8.6 mm and 8.7 mm to 6.8 mm and 6.3 mm, respectively. Ag- gregates from the Wdump and the MunReh sites reduced in size from 8.5 mm and 7.8 mm to 4.5 mm and 3.2 mm, respectively. At amplitude 50 cm marked differences were observed which suggested different capabilities of the soils to withstand disruptive forces. The difference between the mined rehabilitated soil (MR) and the unre- habilitated soils was statistically significant. The percentage changes in aggregate sizes (at ampli- tudes 30 cm, 40 cm and 50 cm) of soils from the four other sites compared to the Control site showed unequal amounts of aggregates retained in the larger sieves. At amplitude 30 cm, percentage changes in aggregate sizes relative to the Control were not significantly differen t but aggregates of the rehab ilitated sites (MR and WRF) were 3.0% and 2.0% greater, respectively. Aggregates from the Wdump and the MunReh sites were 2.1% and 10.2% less, respectively, relative to the Control site. At ampli- tude 40, differences in aggregates relative to the Control were greater. The MR site had an increase in stability 17.0% greater than the Control site while stability at the WRF site reduced to 92.3% relative to the Control. The Copyright © 2012 SciRes. IJG  W. H. K. DORGBETOR ET AL. IJG 55 Table 1. Data on selected physical and chemical properties of the soils. Study sites Soil property† Control (C) MR (A) WRF (B) Wdump (D) MunReh (E) Bulk density (Mg·m–3) 1.73 ± 0.05 1.63 ± 0.06 1.69 ± 0.04 1.71± 0.07 1.61 ± 0.08 Coarse fragments (%) 75.2 ± 1.2 40.8 ± 1.6 45.2 ± 1.4 60.6 ± 1.8 65.4 ± 1.5 Soil pH 5.4 ± 0.2 5.1 ± 0.2 4.8 ± 0.2 5.1± 0.2 4.4 ± 0.1 Organic carbon (g/kg) 13.3 ± 1.2 11.1 ± 0.1 7.2 ± 0.9 2.3 ± 0.7 4.8 ± 0.5 Total N (g/kg) 1.10 ±0.09 0.84 ± 0.05 0.56 ± 0.02 0.18± 0. 03 0.37 ± 0.02 Exch. Ca (cmol/kg) 1.99 ± 0.08 0.81 ± 0.05 0.67 ± 0.03 1.33 ± 0.07 1.29 ± 0.07 Exch. Mg (cmol/kg) 1.65 ± 0.07 0.66 ± 0.05 0.57 ± 0.03 1.68 ± 0.17 0.73 ± 0.04 Exch. K (cmol/kg) 0.16 ± 0.02 0.20 ± 0.01 0.07 ± 0.01 0.08 ± 0.01 0.10 ± 0.01 Exch. Na (cmol/kg) 0.88 ± 0.04 0.14 ± 0.01 0.17 ± 0.01 0.24 ±0.01 0.16 ± 0.01 ESP (%) 13.8 ± 0.04 3.5 ± 0.01 4.3 ± 0.01 4.6 ± 0.01 3.7 ± 0.01 Exch. acidity (cmol/kg) 1.68 ± 0.08 2.16 ± 0.08 2.51 ± 0.08 1.92 ± 0.10 2.04 ± 0.12 Available P (mg/kg) 8.53 ± 0.38 8.08 ± 0.83 6.60 ± 0.31 4.33 ± 0.13 7.89 ± 0.82 Fe (mg/kg) 0.027 ± 0.001 0.011 ± 0.001 0.009 ± 0.001 0.030 ± 0.005 0.033 ± 0.004 Mn (mg/kg) 9.168 ± 1.351 3.017 ± 0.641 2.017 ± 0.445 0.269 ± 0.085 0.272 ± 0.090 Ni (mg/kg) 0.353 ± 0.081 0.250 ± 0.061 0.212 ± 0.041 0.016 ± 0.006 0.018 ± 0.002 Cu (mg/kg) 0. 008 ± 0.003 0.018 ± 0.001 0.016 ± 0.002 0.00 0.00 Zn (mg/kg) 0.029 ± 0.010 0.019 ± 0.001 0.015 ± 0.003 0.029 ± 0.006 0.032 ± 0.004 Cd (mg/kg) 0.015 ± 0.002 0.011 ± 0.003 0.010 ± 0.004 0.020 ± 0.002 0.019 ± 0.003 Pb (mg/kg) 0.079 ± 0. 020 0.052 ± 0.004 0.042 ± 0.008 0.048 ± 0.003 0.048 ± 0.003 †Data represent means of 36 samples. (c) Figure 3. Stability of soil aggregates (mean values) at dif- ferent amplitudes of vibration. (a) change in percentage aggregate sizes in comparison with the Control was greater for the Wdump site (65.3%) and the MunReh site (47.5%). There was a further increase in percentage change of aggregate stability of the soils at amplitude 50 cm. The MR site had a change of 41% rela- tive to the control site. Aggregates from the WRF, Wdump and MunReh sites, were 6.3%, 40.1%, and 27.5% less, respectively. Clearly, aggregates from the waste dump and mined unrehabilitated sites (MunReh) showed the least strength at withstanding disruptive forces. The implication of the observed trends in aggregate stability and bulk density was that the vegetation of the rehabilitated site had a positive impact on stabilizing aggregates within a short term of reclamation, especially (b) Copyright © 2012 SciRes.  W. H. K. DORGBETOR ET AL. 56 in soils which are inherently less fertile and unprodu ctive. It is apparent that aggregate stability can increase or de- crease depending on other prevailing factors. A high value can occur through increased forest canopy cover- age, addition of manure and the presence of other bio- logical binding agents. Stability of soil aggregates can decrease through removal of soil cover, burning, crush- ing, wind action, erosion by water and deforestation as well as top soil loss as in mining. The binding agents of aggregates are rooting systems, decaying litter falls, soil organisms and their decomposit i on products [29-31]. 3.3. Variations in Soil Chemical Properties The pH of the soils which ranged from 5.3 at the control site to less than 5.0 at the mined sites (Table 1) can be described as strongly to very strongly acid and reflect the characteristic of a weathered soil. Total nitrogen and available phosphor us contents are very low. The low ph- osphorus content is partly due to the very small amounts of apatite originally present in the phyllites and the long period of leaching, and also partly due to the element being locked in insoluble or less available compounds of aluminium or iron as noted in similar soils elsewhere [26,31]. Exchangeable bases concentration is very low with Ca and Mg as the dominant cations at exchange site. A fairly high exchange acid ity v alu e was recorded for th e soils; this accounts for more than 30% of effective cation exchange capacity. This is consistent with the low pH environment and suggests an aluminium toxicity problem is inherent in this soil. It is ap parent that the original soil (Control site) has been leached of much of its plant nu- trients and is naturally infertile. The concentrations of trace elements and heavy metals were very low suggest- ing that mining operations and subsequent rehabilitation did not introduce any heavy metals into the soils. Variations in carbon content of the soils are presented in Figure 4. Organic carbon contents were 13.3 g/kg for the unmined control site, 11.1 g/kg for the MR site, 7.2 g/kg for the WRF site, 2.3 g/kg for the Wdump site and 4.8 g/kg at the MunReh site. Clearly, the Control soil which was not affected by mining recorded the highest carbon values whereas the soil at the MR site, which has been re-vegetated for a relatively longer period, ranked second. The carbon build-up can be attributed to accu- mulation of leaf litter from the fast growing trees and other plant materials as well as other associated biologi- cal activity which contributed to a restoration of lost soil carbon. The carbon contents of soils at the Wdump and MunReh sites reflect the impact of mining on degrada- tion with attendan t loss of soil carbon. At the time of the field study, re-vegetation work had not commenced at these two sites. The carbon content at the MR site (11.1 g/kg) relative to the WRF site (7.2 g/kg) is worthy of special note. It Figure 4. Distribution of organic carbon content at the study sites. should be noted that desired results of accumulating car- bon will be achieved only when rehabilitation trees are kept continuously growing. Although rehabilitation works were implemented on both soils at the same time, the trees on soil MR were maintained while those on soil WRF were cut after about 3 - 4 years and the soil culti- vated to food crops using traditional methods with no external nutrient input. In this respect, the gap in carbon content between MR and WRF could be attributed to nutrient mining by cultivated crops. It is, therefore, nec- essary that for the desired effect of rehabilitation to be achieved, clear guidelines must be established on the minimum lifespan of rehabilitation trees that must pass before some trees are cut to allow for farming. 3.4. Coefficient of Variation and Soil Quality Coefficient of variation values, calculated using data on bulk density, aggregate stability and organic matter, are presented in Table 2. The spread of sample values aro- und the mean value of a set of data is an impo rtant meas- ure of variability in sample populations. Coefficient of variation (CV) is a normalized measure of spreading about the mean. The CV increases as the population variability also increases. Soil properties with larger co- efficient of variation are more variable than those with smaller values. A classification scheme identifies the extent of vari- ability for soil properties based on their coefficient of variation [32]. Consequently, CV values of <0% - 15%, 16% - 35% and >36% indicate little, moderate, and high variability, or Classes I, II and III soils, respectively. On the basis of this classification scheme [32], the variability in bulk density values for the soils can be described as Copyright © 2012 SciRes. IJG  W. H. K. DORGBETOR ET AL. Copyright © 2012 SciRes. IJG 57 Table 2. Coefficient of variation in some soil properties at the study sites. Coefficient of variation and groups at the sites† Soil property Control MR WRF Wdump MunReh Bulk density: CV (%) 7.91 12.07 7.18 13.22 16.01 Group (I) (I) (I) (I) II) Aggregate stability: A = 30 cm CV (%) 4.49 0.58 1.06 4.39 15.68 Group (I) (I) (I) (I) (II) A = 40 cm CV (%) 10.05 3.11 6.63 24.66 17.14 Group (I) (I) (I) (II) (II) A = 50 cm CV (%) 13.05 12.03 22.09 21.62 39.06 Group (I) (I) (II) (II) (III) Organic carbon CV (%) 27.15 29.61 42.76 95.13 29.07 Group (II) (II) (III) (III) (II) †(Number of sa mples (n) = 36; at 0 - 20 cm depth. very marginal except for the MunReh site which showed moderate variability. Variability in organic carbon was moderate for the Control, MR and MunReh sites but high for at the WRF and Wdump site. Considering aggregate stability, variability was minimal for all the soils except MunReh at vibrating amplitude 30 cm. However, when the amplitude was raised to 40 cm, variability also in- creased to moderate for aggregates in the Wdump and MunReh soils. Remarkably, aggregates at the Control and MR sites were very stable with little variability re- gardless of the amplitude of the vibration force. The un- rehabilitated mined soil (MunReh) showed the greatest variability in aggregate stability due to absence of vege- tation. Large variability in soil properties was noted for the degraded forest soils elsewhere in the humid tropics [33]. The role of organic carbon in stabilizing soil aggre- gates is worthy of note. The differences in organic car- bon contents at the Control and MR sites on one hand, and those of the Wdump and MunReh sites are signifi- cant. The implication is that aggregates of the mined re- habilitated (MR) and Control sites are most robust and resistant to crushing and rupture. Consequently, the in- fluence of organic carbon on the stability of soil aggre- gates may provide evidence on the physico-chemical quality of soils. Correlation coefficient values showed a positive dependence of aggregate stability on organic carbon contents likely from addition of plant residues to the rehabilitated soil. As noted from the earlier part of the discussion, at amplitude 30 cm, all the soils withstood the simulated crushing effect and there was no difference in strength or stability of aggregates. The correlation coef- ficient value (r30 = 0.57) shows that at amplitude 30 cm, the influence of organic carbon was not too important. At amplitudes 40 cm and 50 cm, however, the soils de- pended more on their carbon content to resist rupture and the crushing effect and this was reflected in the correla- tion coefficient values of, r40 = 0.81 and r50 = 0.79, re- spectively. Although organic carbon influenced stabilization of the aggregates, it is apparent that the greater MWD value and the lower carbon content at the MR site may suggest that other factors introduced by rehabilitation also had effect on aggreg ate stability. The rehabilitat ed but farmed soil (WRF) had aggregates less stable than the MR and Control soils because organic carbon addition to the soil was reduced when the replanted trees were cut to make way for farming at the WRF site. Aggregates at the Wdump and MunReh sites ranked the least stable be- cause they had the least carbon content in them and were also not rehabilitated or had no trees planted on them. The implication of this observation is that vegetation decreases variability in soil prop erties. For this study, the issues raised by environmentalist and other stakeholders in respect of effects of surface mining on destruction of the ecosystem have to be reappraised. One can argue that it is possible to maintain the health of a soil, especially soils with inherent physical and biochemical deficiencies, if reclamation regulations are adhered to. In this regard, the socio-economic dilemma of exploiting natural re- sources for the benefit of societies while maintaining ecosystem balance is addressed. 3.5. Soil Quality Index Soil quality index values, associated threshold va lues and calculated percent total soil quality index from all the study sites are presented in Table 3. The calculated index value for bulk density is zero for all the soils. Bulk den- sity values above 1.50 Mg/m3 indicate possible adverse effects of soil impedance whereas values below 1.50 Mg/m3 suggest a minimal adverse effect to impedance 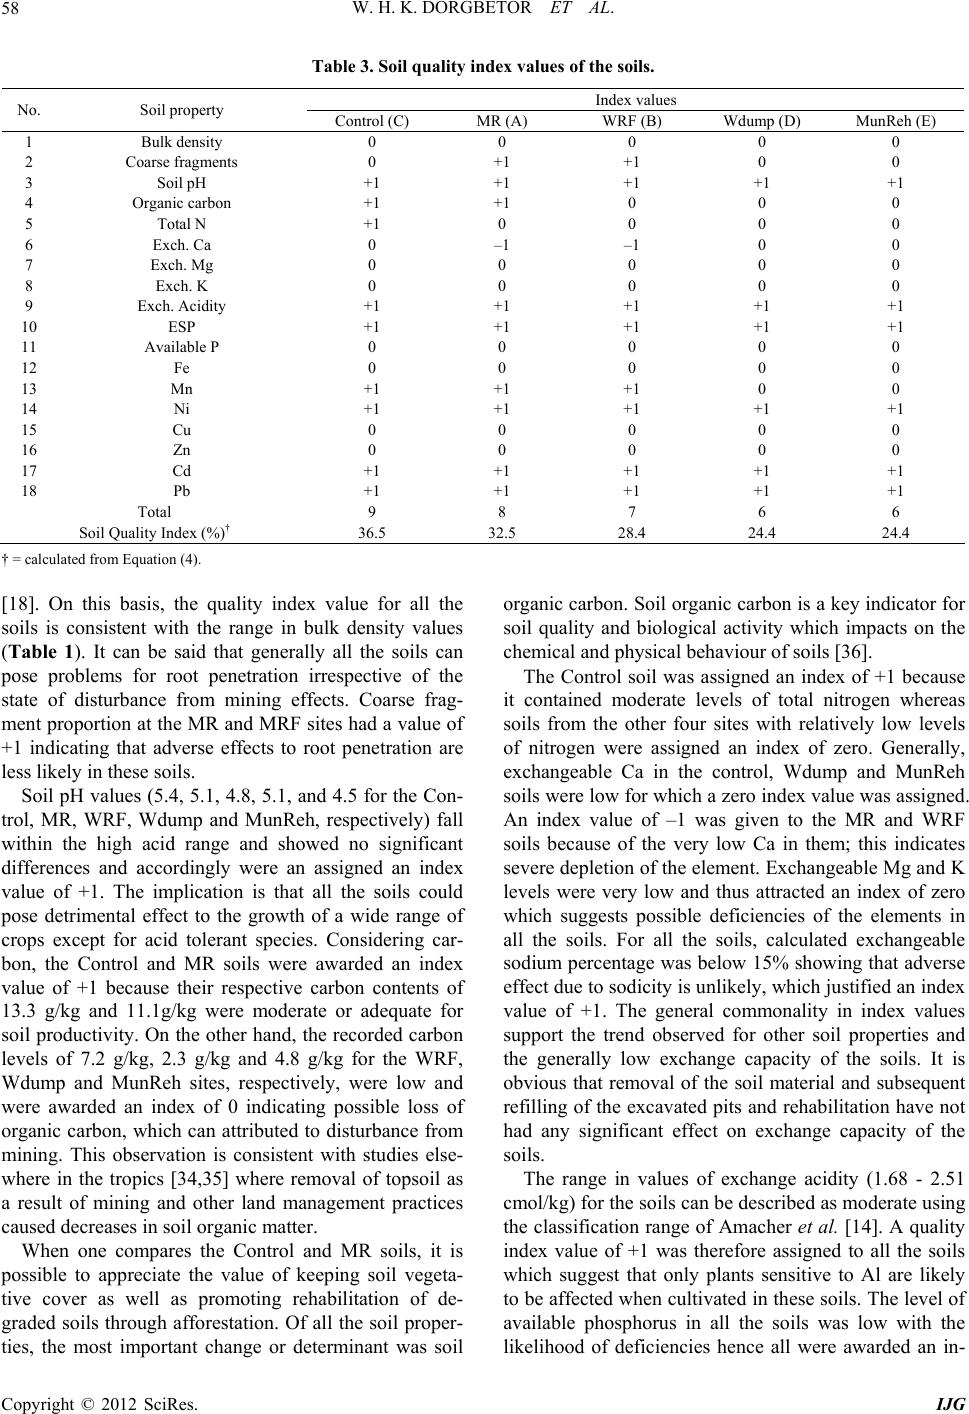 W. H. K. DORGBETOR ET AL. 58 Table 3. Soil quality index values of the soils. Index values No. Soil property Control (C) MR (A) WRF (B) Wdump (D) MunReh (E) 1 Bulk density 0 0 0 0 0 2 Coarse fragments 0 +1 +1 0 0 3 Soil pH +1 +1 +1 +1 +1 4 Organic carbon +1 +1 0 0 0 5 Total N +1 0 0 0 0 6 Exch. Ca 0 –1 –1 0 0 7 Exch. Mg 0 0 0 0 0 8 Exch. K 0 0 0 0 0 9 Exch. Acidity +1 +1 +1 +1 +1 10 ESP +1 +1 +1 +1 +1 11 Available P 0 0 0 0 0 12 Fe 0 0 0 0 0 13 Mn +1 +1 +1 0 0 14 Ni +1 +1 +1 +1 +1 15 Cu 0 0 0 0 0 16 Zn 0 0 0 0 0 17 Cd +1 +1 +1 +1 +1 18 Pb +1 +1 +1 +1 +1 Total 9 8 7 6 6 Soil Quality Index (%)† 36.5 32.5 28.4 24.4 24.4 † = calculated from Equation (4). [18]. On this basis, the quality index value for all the soils is consistent with the range in bulk density values (Table 1). It can be said that generally all the soils can pose problems for root penetration irrespective of the state of disturbance from mining effects. Coarse frag- ment proportion at the MR and MRF sites had a value of +1 indicating that adverse effects to root penetration are less likely in these soils. Soil pH values (5.4, 5.1, 4.8, 5.1, and 4.5 for the Con- trol, MR, WRF, Wdump and MunReh, respectively) fall within the high acid range and showed no significant differences and accordingly were an assigned an index value of +1. The implication is that all the soils could pose detrimental effect to the growth of a wide range of crops except for acid tolerant species. Considering car- bon, the Control and MR soils were awarded an index value of +1 because their respective carbon contents of 13.3 g/kg and 11.1g/kg were moderate or adequate for soil productivity. On the other hand, the recorded carbon levels of 7.2 g/kg, 2.3 g/kg and 4.8 g/kg for the WRF, Wdump and MunReh sites, respectively, were low and were awarded an index of 0 indicating possible loss of organic carbon, which can attributed to disturbance from mining. This observation is consistent with studies else- where in the tropics [34,35] where removal of topsoil as a result of mining and other land management practices caused decreases in soil organic matter. When one compares the Control and MR soils, it is possible to appreciate the value of keeping soil vegeta- tive cover as well as promoting rehabilitation of de- graded soils through afforestation. Of all the soil proper- ties, the most important change or determinant was soil organic carbon. Soil organic carbon is a key indicator for soil quality and biological activity which impacts on the chemical and physical behaviour of soils [36]. The Control soil was assigned an index of +1 because it contained moderate levels of total nitrogen whereas soils from the other four sites with relatively low levels of nitrogen were assigned an index of zero. Generally, exchangeable Ca in the control, Wdump and MunReh soils were low for which a zero index value was assigned. An index value of –1 was given to the MR and WRF soils because of the very low Ca in them; this indicates severe depletion of the element. Exchangeable Mg and K levels were very low and thus attracted an index of zero which suggests possible deficiencies of the elements in all the soils. For all the soils, calculated exchangeable sodium percentage was below 15% showing that adverse effect due to sodicity is unlikely, which justified an ind ex value of +1. The general commonality in index values support the trend observed for other soil properties and the generally low exchange capacity of the soils. It is obvious that removal of the soil material and subsequent refilling of the excavated pits and rehabilitation have not had any significant effect on exchange capacity of the soils. The range in values of exchange acidity (1.68 - 2.51 cmol/kg) for the soils can be described as moderate using the classification range of Amacher et al. [14]. A quality index value of +1 was therefore assigned to all the soils which suggest that only plants sensitive to Al are likely to be affected when cultivated in these soils. The level of available phosphorus in all the soils was low with the likelihood of deficiencies hence all were awarded an in- Copyright © 2012 SciRes. IJG  W. H. K. DORGBETOR ET AL. 59 dex value of zero. For the trace elements, the associated index is zero for the measured threshold levels of Fe, Cu and Zn in the soils. An index value of +1 was assigned to all the soils for Cd and Pb because of their relative concentration levels (Table 1). The levels of Mn in the Control, MR and WRF soils were low and fitted into an index value of +1 whereas the very low levels which indicated defi- ciency of the element in the Wdump and MunReh soils accounted for an index value of zero. Although the levels of Ni were moderate in the Control, MR and WRF soils and low in the Wdump and MunReh soils they had an index value +1. An index value of +1 was assigned to the Control and the two rehabilitated soils b ecaus e of the low Mn levels and zero for the two unrehabilitated soils as a result of the very low levels of the element. Summation of the assigned index values of all the properties at each site showed that the Control, MR, WRF, Wdump and MunReh soils total values were 9, 8, 7, 6 and 6, respectively. The corresponding calculated soil quality index (Equation (4)) expressed in percentages (% SQI) were 36.5, 32.5, 28.4, 24.4 , and 24.4 (Figure 5) on the assumption of a proportionate maximum possible total soil quality index of 24.6 instead of 26 (i.e. 18 out of 19 measured soil properties). The scale of calculated SQI indicates that the higher the value the better the quality of the soil. In this study, the SQI value of the Control (unmined) soil suggests a poor quality soils because of the inherent low fertility status and morphological features generally associated with upland soils. The poor quality of the un- mined soil is worthy of special note considering the fact that it is under a secondary forest with a history of pre- vious cultivation. Although we did not encounter the original virgin forest vegetation with its uncu ltiv ated so il, it is doubtful if the 36.5% quality index could be any dif- ferent. Field and analytical data on a sim il ar soi l in a virgin forest elsewhere in Ghana showed similar trend in meas- ured soil properties except for a relatively higher organic carbon and nitrogen contents [37]. Notwithstanding Figure 5. Soil quality index at the study sites. the shifts in carbon and nitrogen contents, however, the associated index values based on the range of defined thresholds [18] would not be different. It can therefore be concluded that the poor quality of the Control soil is an inherent characteristic. The difference in quality between the maximum obtainable and the soil’s inherent quality was further widened when it was subjected to the impact of surface mining and this was reflected in lower index values for all the mine-affected soils. The mined rehabilitated soil MR h ad an index v alue of 32.5% which is less than the value of the Control by 4% while the index of the rehabilitated soil cultivated soil (WRF) was less by 8.1%. Index values for the waste dump (Wdump) and mined unrehabilitated (MunReh) soils were 12.1% less than the value for the control soil. It is apparent that the most important contributing factor for the relatively lower index values in the mined soils was the reduction in total organic carbon and total nitro- gen. Because the deeply weathered deposits are devoid of weathered mineral residues for fertility, their agronomic value depends on topsoil organic matter as nutrient source for plant roots and also on the parent material for fertility but this fertility is quickly lost when the forest cover, which produced and protected it, is removed as happens during surface mining of gold. The SQI values reported for temperate forest soils [18] were all greater than 40% because of higher nutrient lev- els. Be that as it may, this study has shown that the model can be applied to estimate the quality of tropical forest soils. For our study, a major implication of the quality index values of the soils, especially at the MR and WRF sites, is that after exploiting the underlying mineral wealth and rehabilitating the land (according the EPA standard) it is possible to return the land to an equi- librium state of the natural soil within the short and me- dium terms, especially when the initial inherent quality is low. 4. Conclusions In all the soils studied, variability in organic carbon was moderate for the Control and MR soils. There was little variability in aggregate stability except for MunReh at vibrating amplitude 30 cm. Significantly, aggregates at the control and MR sites were very stable with little variability regardless of the amplitude of the vibration force. At higher amplitude of vibration, only soils at the Control and MR sites were stable. Variability in soil properties was very minimal in the Control soil fo llowed by the MR sites. The Control unmined soil had 36.5% soil quality index indicating a soil with a poor inherent physical and biochemical properties. For the mined sites the quality was less due to reductions in total organic carbon and breakdown in aggregate stability. In order to sustain soil productivity and prevent retrogression to the Copyright © 2012 SciRes. IJG  W. H. K. DORGBETOR ET AL. 60 state of degradation, rehabilitated soils should be pro- tected from farming activities for 12 - 15 years to allow organic matter build-up to return to the conditions of the Control soil. During crop cultivation, leguminous trees should be incorporated and bush burning that tradition- ally accompanies land preparation should be discouraged to allow organic matter build-u p to mature. A major outcome of this study relates to the issues raised by environmentalists and other stakeholders on impact of surface mining on destruction of the ecosystem. It may be argued that the health of a soil can be main- tained, especially soils with inherent physical and bio- chemical deficiencies, if reclamation regulations are ad- hered to. The period for the rehabilitated soil to reach the stage of ecological balance may be in the short to me- dium terms. In this regards, it is possib le to exploit natu- ral resources for the benefit of societies while conscious efforts are made to restore the health of the environment. 5. Acknowledgements The authors wish to acknowledge the kind permission of the Environmental Division of AngloGold Ashanti for access to their mined sites and the Department of Soil Science and the Ecological Laboratory, University of Ghana, Legon for use of their laboratories for the analy- ses. Special thanks go to Prince Gyekye of the Soil Re- search Institute, CSIR, Accra for assistance in producing the site map. REFERENCES [1] R. J. Van Aarde, A. M. Smit and A. S. Claassens, “Soil Characteristics of Rehabilitating Mined and Unmined Coastal Dunes at Richards Bay, KwaZulu-Natal, South Africa,” Restoration Ecology, Vol. 6, No. 1, 1998, pp. 102-110. doi:10.1046/j.1526-100x.1998.06113.x [2] E. Callender, “Heavy Metals in the Environment—His- torical Trends,” In: B. S. Lollar, Ed., Treatise on Geo- chemistry, Environmental Geochemistry, Elsevier, Am- sterdam, 2004, pp. 67-105. [3] A. Hüttermann, I. Arduini and D. L. Godbold, “Metal Pollution and Forest Decline,” In: M. N. V. Prasad, Ed., Heavy Metal Stress in Plants from Biomolecules to Eco- systems, 2nd Edition, Springer-Verlag, Berlin, 2004, pp. 295-312. [4] K. Telmera, M. Costa, R. Angélica, E. S. Araujof and Y. Mauriceg, “The Source and Fate of Sediment and Mer- cury in the Tapajós River Para, Brazilian Amazon: Ground- and Space-based Evidence,” Journal of Environmental Management, Vol. 81, No. 2, 2006, pp. 101-113. doi:10.1016/j.jenvman.2005.09.027 [5] Australian Environment Protection Agency, “Rehabilita- tion and Revegetation, Best Practice Environmental Man- agement in Mining,” ACT7 Commonwealth of Australia, Barton, 1995. [6] W. H. O. Ernst, “Bioavailability of Heavy Metals and Decontamination of Soils by Plants,” Applied Geochem- istry, Vol. 11, No. 1-2, 1996, pp. 163-167. doi:10.1016/0883-2927(95)00040-2 [7] D. C. Adriano, “Trace Elements in Terrestrial Environ- ments: Biogeochemistry, Bioavailability and Risk of Met- als,” Springer-Verlag, New York, 2001. [8] J. F. Parr, R. I. Papendic k, S. B. Hornick and R. E. Meyer, “Soil Quality: Attributes and Relationship to Alternative and Sustainable Agriculture,” American Journal of Al- ternative Agriculture, Vol. 7, No. 1-2, 1992, pp. 5-11. doi:10.1017/S0889189300004367 [9] US National Research Council, “Safety Evaluation Re- port to Amendment No. 127 to Facility Operating Licence No. DRP-48,” Zion Nuclear Power Station, Unit 2, Wash- ington DC, 1992. [10] C. A. Seybold, M. J. Mausbach, D. L. Karlen and H. H. Rogers, “Quantification of Soil Quality,” In: R. Lal, J. M. Kimble, R. F. Follett and B. A. Stewart, Eds., Soil Proc- esses and the Carbon Cycle, CRC Press, Boca Raton, 1998, pp. 387-404. [11] G. Miller, “The Whitehorse Initiative: A Case Study in Partnerships, in Management of Commodity Resources in the Context of Sustainable Development: Social Impact of Mining,” Proceedings of United Nations Conference on Trade and Development (UNTAD/ITCD/COMS), Ge- neva, 1996, pp. 72-81. [12] A. Clewell and J. P. Rieger, “What Practitioners Need from Restoration Ecologist,” Restoration Ecology, Vol. 5, No. 4, 1997, pp. 350-354. doi:10.1046/j.1526-100X.1997.00548.x [13] L. D. Karlen and D. E. Stott, “A Framework for Evaluat- ing Physical and Chemical Indicators of Soil Quality,” In: J. W. Doran, D. C. Coleman, D. F. Bezdicek and B. A. Stewart, Eds., Defining Soil Quality for a Sustainable En- vironment, Special Publication No. 35, Soil Science Soci- ety of America, Madison, 1994, pp. 53-72. [14] M. J. Haigh, “Degradation of Reclaimed Lands Previ- ously Disturbed by Coal Mining in Wales: Causes and Remedies,” Land Degradation & Development, Vol. 3, No. 3, 1992, pp. 169-180. doi:10.1002/ldr.3400030306 [15] J. C. Chambers and G. L. Wade, “Evaluating Reclamation Success: The Ecological Considerations,” Proceedings of a Symposium, USDA Forest Service, Northern Forest Experiment Station, Radnor, 1992, p.107. [16] J. W. Doran and T. B. Parkin, “Quantitative Indicators of Soil Quality: A Minimum Da ta Set,” In: J. W. Doran and A. J. Jones, Eds., Methods for Assessing Soil Quality, Special Publication No. 49, Soil Science Society of America, Madison, 1996, pp. 25-37. [17] J. Glover, J. Reganold and P. Andrews, “Systematic Methods for Rating Soil Quality of Conventional, Or- ganic and Integrated Apple Orchards in Wa shington State,” Agriculture, Ecosystems & Environment, Vol. 88, No. 1-2, 2000, pp. 29-45. doi:10.1016/S0167-8809(00)00131-6 [18] M. C. Amacher, K. P. O’Neil and C. H. Perry, “Soil Vital Signs: A New Soil Quality Index (SQI) for Assessing Forest Soil Health,” Research Paper RMRS-RP-65WWW, Forest Service, Rocky Mountain Research Station, Fort Collins, 2007. Copyright © 2012 SciRes. IJG  W. H. K. DORGBETOR ET AL. Copyright © 2012 SciRes. IJG 61 [19] C. J. Taylor, “The Vegetation Zones of the Gold Coast,” Department Bulletin No. 4, Government Printer, Accra, 1952. [20] P. R. Day, “Particle and Particle Size Analysis,” In: C. A. Black, Ed., Methods of Soil Analysis, Part I, Agronomy, American Society of Agronomy, Madison, 1965, pp. 545- 567. [21] G. R. Blake and K. H. Hartge, “Bulk Density,” In: A. Klute, Ed., Methods of Soil Analysis, Part 1—Physical and Mineralogical Methods, 2nd Edition, ASA-SSA, Madison, 1986, pp. 363-382. [22] W. D. Kemper and R. C. Rosenau, “Aggregate Stability and Size Distribution,” In: A. Klute, Ed., Methods of Soil Analysis, Part 1—Physical and Mineralogical Methods, 2nd Edition, ASA-SSA, Madison, 1986, pp. 425-442. [23] D. Hillel, “Introduction to Environmental Physics,” El- sevier Academic Press, Amsterdam, 2004. [24] R. H. Bray and L. T. Kurtz, “Determination of Total Or- ganic and Available Forms of Phosphorus in Soils,” Soil Science, Vol. 59, No. 1, 1945, pp. 39-45. doi:10.1097/00010694-194501000-00006 [25] G. W. Thomas, “Extractable Cations,” In: A. L. Page, R. H. Miller and D. Keeney, Eds., Methods of Soil Analysis, Part 2—Chemical and Biochemical Methods, 2nd Edition, ASA-SSA, Madison, 1982, pp. 159-165. [26] G. N. N. Dowuona, I. A. Taina and R. J. Heck, “Porosity Analysis of Two Acrisols by X-Ray Computed Microto- mography, Soil Science, Vol. 174, No. 11, 2009, pp. 583- 893. doi:10.1097/SS.0b013e3181c2a90b [27] R. F. Sutton, “Soil Properties and Root Development in Forest Trees: A Review,” Forestry Canada Information Report O-X-413, Ottawa, 1991. [28] R. F. Fisher and D. Binkley, “Ecology and Management of Forest Soils,” 3rd Edition, John Wiley & Sons, New York, 2000. [29] R. F. Harris, G. Chester and O. N. Allen, “Dynamics of Soil Aggregation,” Advances in Agronomy, Vol. 18, 1965, pp. 107-160. doi:10.1016/S0065-2113(08)60649-5 [30] P. Lavelle, “Earthworm Activities and the Soil System,” Biology and Fertility of Soils, Vol. 6, No. 3, 1988, pp. 237-251. doi:10.1007/BF00260820 [31] G. N. N. Dowuona, A. R. Mermut, S. G. K. Adiku, E. Nartey and I. Tete-Mensah, “Improvement in the Quality of Soils under Agroforestry Practice in Ghana,” In: G. Renard, A. Neef, K. Becker and M. von Oppen, Eds., Soil Fertility Management in West Africa Land Use Systems, Margraf Verlag, Weikersheim, 1998, pp. 251-258. [32] L. P. Wilding and L. R. Drees, “Spatial Variability and Pedology,” In: L. P. Wilding, N. E. Smeck and G. F. Hall, Eds., Pedogenesis and Soil Taxonomy I: Concepts and Interactions, Elsevier, Amsterdam, 1985, pp. 83-116. [33] A. O. Ogunkunle and O. O. Eghaghara, “Influence of Land Use on Soil Properties in a Forest Region of South- ern Nigeria,” Soil Use Management, Vol. 8, No. 3, 1992, pp. 121-125. doi:10.1111/j.1475-2743.1992.tb00906.x [34] G. S. Henderson, “Soil Organic Matter: A Link between Forest Management and Productivity,” In: W. H. McFee and J. M. Kelly, Eds., Carbon Forms and Functions in Forest Soils, Soil Science Society of America, Madison, 1995, pp. 419-435. [35] W. H. Schlesinger, “Biogeochemistry: An Analysis of Global Change,” 2nd Edition, Academic Press, San Diego, 1997. [36] M. Roberts, The Ground: Interface in the Environment, Resource for Development,” Dunod/Masson, Paris, 1996. [37] P. M. Ahn, “Soils of the Lower Tano Basin, Southwestern Ghana,” Memoir No. 1, Department of Soil and Landuse Survey, Kumasi, 1961.
|