Paper Menu >>
Journal Menu >>
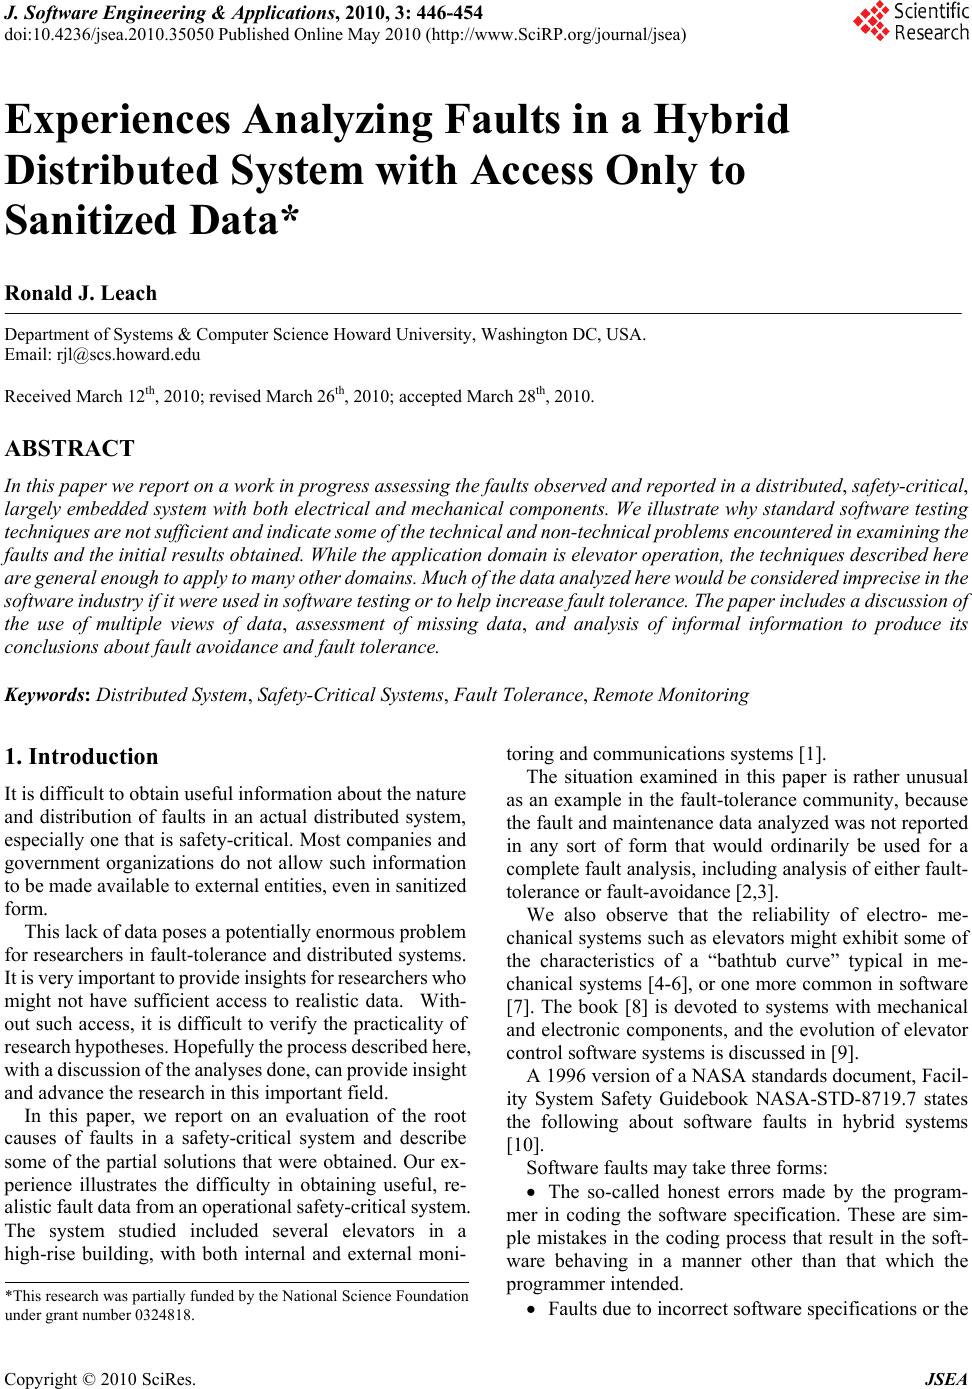 J. Software Engineering & Applications, 2010, 3: 446-454 doi:10.4236/jsea.2010.35050 Published Online May 2010 (http://www.SciRP.org/journal/jsea) Copyright © 2010 SciRes. JSEA Experiences Analyzing Faults in a Hybrid Distributed System with Access Only to Sanitized Data* Ronald J. Leach Department of Systems & Computer Science Howard University, Washington DC, USA. Email: rjl@scs.howard.edu Received March 12th, 2010; revised March 26th, 2010; accepted March 28th, 2010. ABSTRACT In this paper we report on a work in progress assessing the faults observed and reported in a distributed, safety-critical, largely embedded system with both electrical and mechanical components. We illustrate why standard software testing techniques are not sufficient and indicate some of the technical and non-technical problems encountered in examining the faults and the initial results obtained. While the application domain is elevator operation, the techniques described here are general enough to apply to many other domains. Much of the data analyzed here would be considered imprecise in the software industry if it were used in software testing or to help increase fault tolerance. The paper includes a discussion of the use of multiple views of data, assessment of missing data, and analysis of informal information to produce its conclusions about fault avoidance and fault tolerance. Keywords: Distributed System, Safety-Critical Systems, Fault Tolerance, Remote Monitoring 1. Introduction It is difficult to obtain useful information about the nature and distribution of faults in an actual distributed system, especially one that is safety-critical. Most companies and government organizations do not allow such information to be made available to external entities, even in sanitized form. This lack of data poses a potentially enormous problem for researchers in fault-tolerance and distributed systems. It is very important to provide insights for researchers who might not have sufficient access to realistic data. With- out such access, it is difficult to verify the practicality of research hypotheses. Hopefully the process described here, with a discussion of the analyses done, can provide insight and advance the research in this important field. In this paper, we report on an evaluation of the root causes of faults in a safety-critical system and describe some of the partial solutions that were obtained. Our ex- perience illustrates the difficulty in obtaining useful, re- alistic fault data from an operational safety-critical system. The system studied included several elevators in a high-rise building, with both internal and external moni- toring and communications systems [1]. The situation examined in this paper is rather unusual as an example in the fault-tolerance community, because the fault and maintenance data analyzed was not reported in any sort of form that would ordinarily be used for a complete fault analysis, including analysis of either fault- tolerance or fault-avoidance [2,3]. We also observe that the reliability of electro- me- chanical systems such as elevators might exhibit some of the characteristics of a “bathtub curve” typical in me- chanical systems [4-6], or one more common in software [7]. The book [8] is devoted to systems with mechanical and electronic components, and the evolution of elevator control software systems is discussed in [9]. A 1996 version of a NASA standards document, Facil- ity System Safety Guidebook NASA-STD-8719.7 states the following about software faults in hybrid systems [10]. Software faults may take three forms: The so-called honest errors made by the program- mer in coding the software specification. These are sim- ple mistakes in the coding process that result in the soft- ware behaving in a manner other than that which the programmer intended. Faults due to incorrect software specifications or the *This research was partially funded by the National Science Foundation under grant number 0324818.  Experiences Analyzing Faults in a Hybrid Distributed System with Access Only to Sanitized Data Copyright © 2010 SciRes. JSEA 447 programmer’s interpretation of these specifications. These errors may result from system designer’s lack of full understanding of system function or from the pro- grammer’s failure to fully comprehend the manner in which the software will be implemented or the instruc- tions executed. In this type of fault the software state- ments are written as intended by the programmer. Faults due to hardware failure. Hardware failures may change software coding. Thus such software faults are secondary in that they originate outside the software. All these types of faults, as well as a considerable amount of human error, are present in this system. We note that a new draft standard STD-8719.7A is currently under NASA review. Other relevant research on the reli- ability of fault-tolerant, safety-critical; systems can be found in [11,12]. As will be discussed later in this paper, an informal verbal description of a problem with an on-site building manager and a conversation with a service company rep- resentative helped identify a set of faults that could be removed easily, leaving the system with a greater degree of resilience when other faults were encountered. We note that some of the fault data was sanitized be- fore it was made available to the author for the analysis that is described in this paper. Even so, some conclusions can be drawn about the major causes of faults, even with incomplete data. We have removed all references to the particular companies that performed the initial installation and ser- vice of the set of elevators described here. The distrib- uted card and password security system that the elevator access controls must interface with are described only at the highest levels, also. We have also sanitized the nature of any company database design in order to protect pro- prietary information. Of course, simulation of elevator behavior in terms of picking up and letting off passengers is often used as a teaching tool. One of the earliest readily available such discussion is provided in Knuth [13]. A recent search on Google for the terms “elevator simulation” and “assign- ment” provided 517 matches. 2. The System Evaluated The system evaluated in this work is a set of user- oper- ated elevators that have multiple sets of controls, multi- ple alarms, and the capability to communicate with a remote monitoring device. All elevators are in the same high-rise building complex. The system is integrated with an access control system and electronic cards. The system currently complies with all existing safety codes in the geographical area. The elevator system is over twenty years old and has some problems of age, wear and tear, and unavailability of parts. Of course, it is not reasonable to expect that the pro- grammers who wrote the original code for the micro- processors and related subsystems will still be with the company. In fact, there is no reason to expect that the company that originally designed and installed the ele- vator system is responsible for its maintenance. This is, of course, a typical situation in the software maintenance industry. The entire system may be viewed as having several distinct features, most of which are illustrated below in Figure 1. The system contains a set of seven elevator cars that are positioned in three banks of two elevators each, with the remaining elevator essentially by itself, although an- other nearby elevator could be used in an emergency. The banks of elevators are several hundred feet apart. The alarm system in the elevators is audible to a lo- cal human monitoring system, with monitoring at all times of day and night. The on-site human monitor enters all problems into a log book and can call the elevator company’s service center. There are also phones inside each elevator to enable a stranded user to contact the proper service personnel, or the fire department. In the late evening, the elevators automatically re- vert to limiting access to being controlled by electronic access cards. These electronic control cards are integrated into a building-wide security system with monitoring by the aforementioned human monitors and with each access entered into a database system. Microprocessors in each of the seven elevator cars can interact with communications devices that are able to transmit problem information to an off-site remote monitoring system. The microprocessors use a custom design and should Remote monitor system Alarm system Hall buttons Door open/close controls Security System Elevator (one of several) Figure 1. An OV-1, high-level view of the interaction be- tween several of the elevator’s microprocessors and some of the other relevant computer-controlled systems  Experiences Analyzing Faults in a Hybrid Distributed System with Access Only to Sanitized Data Copyright © 2010 SciRes. JSEA 448 be thought of as ASICs (Application-Specific Integrated Circuits). The lack of a standardized design makes the error rates of processors difficult to compare with other microprocessors of the same vintage. Hence it is impos- sible to use fault microprocessor data – even if it were made available – to determine if the reliability was typi- cal of long-lived systems with high degrees of reuse. It appears that the microprocessors are not readily available for replacement in all of the elevator com- pany’s installed locations. Every call for elevator service is entered into a ser- vice database at the elevator company’s central location. The elevator company’s service supervisors can see this database monitoring system. This system can be viewed, in certain circumstances, by non-company personnel. It is natural to ask why this system is an appropriate example to serve as the basis for a paper on software failures. Most modern elevators do not require a special operator and are operated by individuals who are, almost certainly, unaware of the safety, design, and control is- sues involves with their safe operation. Hence, there are multiple control and monitoring features, nearly all of which are computer-based for the system described in this paper. There are microprocessors in several subsystems of this set of elevators. The microprocessors are custom designed and cannot be replaced easily by off-the-shelf components. Each elevator has the following computer components or computer system interfaces: Each elevator contains a microprocessor that selects options, based on the buttons that have been pressed. The microprocessor controls the operation of the doors (open, closed), as well as floor selection, based on the buttons pressed. Since there are separate controls on each side of the elevator cab, each side must have its own microproces- sor. For six of the seven elevators, the buttons are ren- dered inoperable late at night by a security code set by a human operator at an in-building control center until a person uses their personal pre-assigned security code, which is entered using the in-car buttons on the keypad. Unless the code is entered correctly, the elevator car re- turns to the ground floor. For some of the higher floors, access also requires the swiping of an electronic security card. There are control units in sets of buttons, one for each floor, that allow the elevator to be called. Each of the control units contains a microprocessor for commu- nication. There are sensors in each set of door panels. There are both interior and exterior doors in each elevator. These sensors make the doors stop closing if they en- counter an obstacle, usually a human, but perhaps lug- gage or a grocery cart. These are controlled by micro- processors. Some doors have microprocessors to control smooth opening and closing of doors in the event of se- vere wind conditions affecting air flow within the eleva- tor shafts. The elevator shafts have external air access, due to elevator safety regulations. All programming of the microprocessors is done off-site and, after testing, the microprocessors are de- ployed. There is only a minimal amount of on- site pro- gramming performed. Figure 2. An OV-2 view of the system, showing need lines  Experiences Analyzing Faults in a Hybrid Distributed System with Access Only to Sanitized Data Copyright © 2010 SciRes. JSEA 449 Each elevator contains a microprocessor and a communications path that sends a service code to the elevator company’s central service location in the event of a malfunction. The company’s central service location monitors all service calls, whether called in by an authorized human monitor or the electronic call system described above. There is a company proprietary database of service calls. In certain circumstances, the database may be made available for read-only access to selected customer rep- resentatives. 3. Modeling the System To help understand and model the system’s organization, we used the Department of Defense Architectural Fram- ework, DoDAF and created the models using the System Architect for DoDAF tool from Telelogic. Representa- tions of system operation were shown in what in DoDAF terminology is called “Operational Views.” There are several types of standardized operational views: OV-1 consists of an informal, graphical representa- tion of operations as well as explanatory text. It is infor- mal in the sense that information provided in it is not included in any database or CASE tool. An OV-1 dia- gram of the system is provided in Figure 1. OV-2 is intended to track the need to exchange in- formation from specific operational nodes that play a key role in the architecture to others. OV-2 does not depict the connectivity between the nodes. OV-3 (Operational Information Interchange Matrix) This view expresses the relationship between the three basic architecture data elements of an OV (operational activities, operational nodes, and information flow) in the form of an Excel spreadsheet, with a focus on the spe- cific aspects of the information flow and the information content. This view is not provided in this paper, since it is somewhat redundant to the information included in the OV-2 and OV-5 diagrams. OV-4 (Organizational Relationships Chart) This view clarifies the various relationships that can exist be- tween organizations and sub-organizations within the architecture and between internal and external organiza- tions. Relevant organizations are the elevator service company, the company that built and installed the opera- tor, the elevator inspector, the building management company, tenants, and, although informal, the organiza- tion of elevator users. This view is not provided in this paper, since it has been superceded by a new, somewhat confidential, contractual relationship that was developed as part of the analysis that was performed as a result of this study. OV-5 (Operational Activity Diagrams) The dia- grams provided in this view represents the various activi- ties that are performed by major components of the ele- vator management system. It is intended to do the fol- lowing: Clearly delineate the lines of responsibility for ac- tivities when coupled with OV-2 Uncover unnecessary operational control activity redundancy Make decisions about streamlining, combining, or omitting activities Define or flag issues, opportunities, or operational activities and their interactions (information flows among the activities) that need to be scrutinized further Provide a necessary foundation for depicting activ- ity sequencing and timing in OV-6a, OV-6b, and OV-6c In Telelogic’s implementation of System Architect for DoDAF, three distinct OV-5 diagrams are created: an “Operational Activity Model Node Tree,” a top-level “Node Activity Diagram,” and a child-level “Node Ac- tivity Diagram.” Each of these diagrams is discussed in detail. The methodology used in this diagram in System Architect is known as IDEF0, which is used to reflect data flows. The acronym IDEF stands for Integrated Computer-Aided Manufacturing (ICAM) DEFinition. The Operational Activity Model Node Tree Diagram indicates the major components of the elevator manage- ment system: human operation; elevator car operation; remote monitoring operation; security system operation, alarm system operation, and the phone system The tree structure indicates the major operational activity de- pendencies and their relation to the primary operational activity-management of the elevator’s operation. For simplicity, only a few of the child nodes are shown in Figure 3. For each of the nodes in an operational activity dia- gram, a set of operations is allowed. We show a few of these in Figure 4, where we have presented an ICOM diagram. The acronym ICOM stands for Input Control Output Mechanism. Arrows for a few of each of these four types of interactions are shown in clockwise order, beginning at the left hand side of the highest level opera- tional activity named “Manage elevator” in Figure 4. OV-6 (Operational Activity Sequence and Timing Descriptions) OV products discussed previously model the static structure of the architecture elements and their relationships. Many of the critical characteristics of a software architecture are only discovered when the dy- namic behavior of these elements is modeled to incorpo- rate sequencing and timing aspects of the architecture. Three standard types of sequence diagrams are in com- mon use: Operational Rules Model (OV-6a), Operational State Transition Description (OV-6b), and Operational Event-Trace Description (OV-6c). Since our analysis of the failure data indicated that timing considerations did not appear to be a problem, these views are not discussed in this paper. 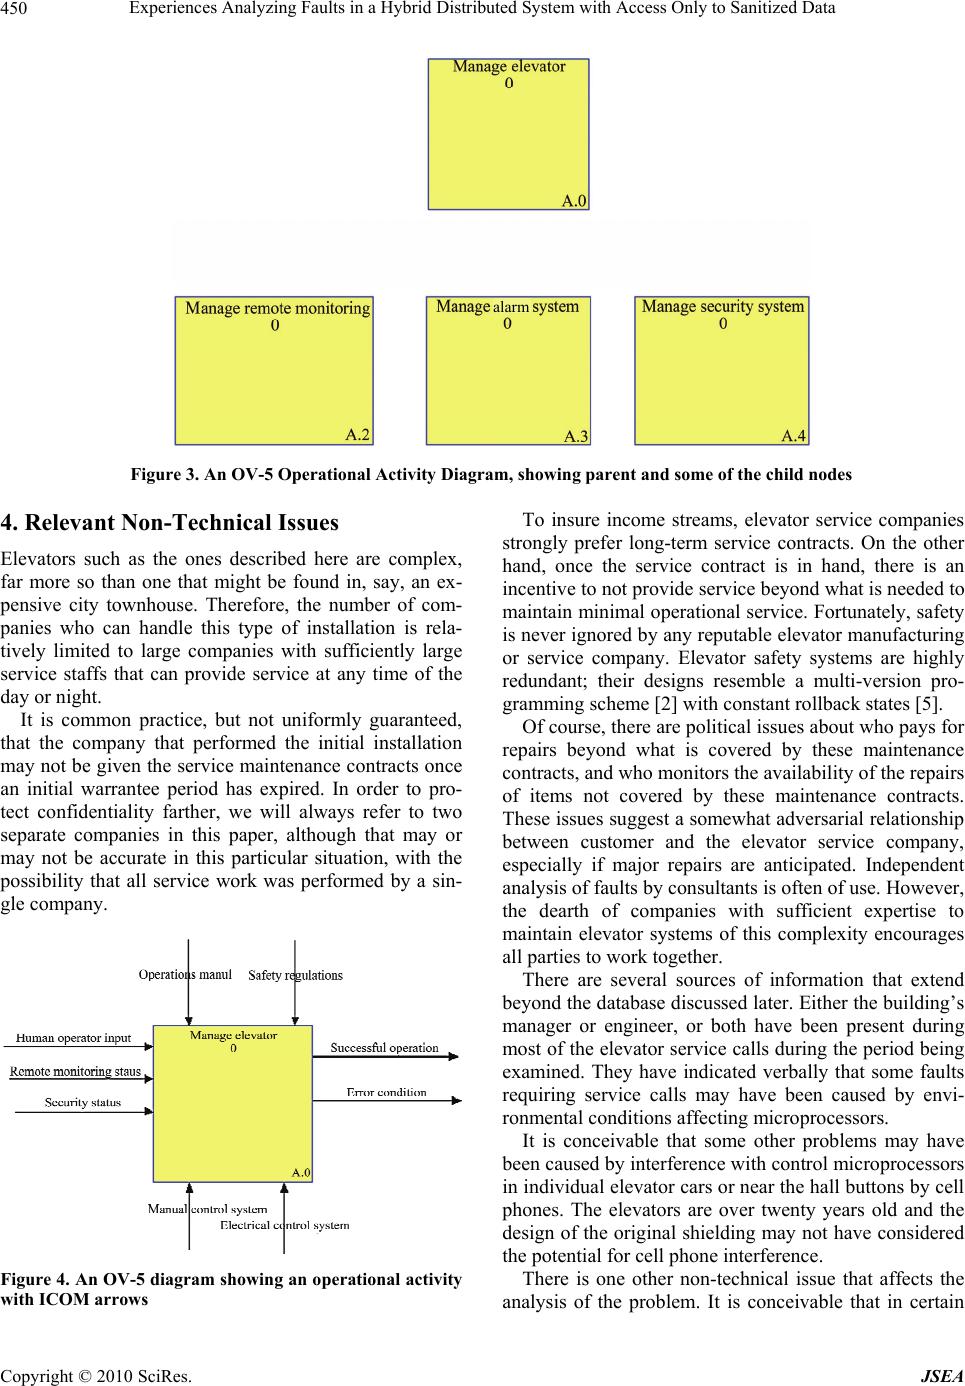 Experiences Analyzing Faults in a Hybrid Distributed System with Access Only to Sanitized Data Copyright © 2010 SciRes. JSEA 450 Figure 3. An OV-5 Operational Activity Diagram, showing parent and some of the child nodes 4. Relevant Non-Technical Issues Elevators such as the ones described here are complex, far more so than one that might be found in, say, an ex- pensive city townhouse. Therefore, the number of com- panies who can handle this type of installation is rela- tively limited to large companies with sufficiently large service staffs that can provide service at any time of the day or night. It is common practice, but not uniformly guaranteed, that the company that performed the initial installation may not be given the service maintenance contracts once an initial warrantee period has expired. In order to pro- tect confidentiality farther, we will always refer to two separate companies in this paper, although that may or may not be accurate in this particular situation, with the possibility that all service work was performed by a sin- gle company. Figure 4. An OV-5 diagram showing an operational activity with ICOM arrows To insure income streams, elevator service companies strongly prefer long-term service contracts. On the other hand, once the service contract is in hand, there is an incentive to not provide service beyond what is needed to maintain minimal operational service. Fortunately, safety is never ignored by any reputable elevator manufacturing or service company. Elevator safety systems are highly redundant; their designs resemble a multi-version pro- gramming scheme [2] with constant rollback states [5]. Of course, there are political issues about who pays for repairs beyond what is covered by these maintenance contracts, and who monitors the availability of the repairs of items not covered by these maintenance contracts. These issues suggest a somewhat adversarial relationship between customer and the elevator service company, especially if major repairs are anticipated. Independent analysis of faults by consultants is often of use. However, the dearth of companies with sufficient expertise to maintain elevator systems of this complexity encourages all parties to work together. There are several sources of information that extend beyond the database discussed later. Either the building’s manager or engineer, or both have been present during most of the elevator service calls during the period being examined. They have indicated verbally that some faults requiring service calls may have been caused by envi- ronmental conditions affecting microprocessors. It is conceivable that some other problems may have been caused by interference with control microprocessors in individual elevator cars or near the hall buttons by cell phones. The elevators are over twenty years old and the design of the original shielding may not have considered the potential for cell phone interference. There is one other non-technical issue that affects the analysis of the problem. It is conceivable that in certain alar m  Experiences Analyzing Faults in a Hybrid Distributed System with Access Only to Sanitized Data Copyright © 2010 SciRes. JSEA 451 instances, data in the aforementioned company’s pro- prietary database of service calls may provide some con- fidential information about failures of certain compo- nents. That might give some competitors an unfair ad- vantage when bidding for maintenance or major upgrade contracts. This information must be kept within the secu- rity standards of the company. Hence, such data is sani- tized considerably before release to anyone not employed by the company. 5. Current System Status In Figure 5, we illustrate the availability of the individ- ual elevators for service during a period of one year. The period shown was ended before the analysis described in this paper was undertaken. Of course, these percentages, while high, are never high enough for the elevator user who might be stuck in an elevator. The low availability of the first elevator is clearly a cause for concern. The graph shows real data, but information on specific elevators has been deleted to preserve sensitive proprie- tary information. The diagrams are screen dumps taken directly from the elevator company’s website. While it is difficult to appreciate the differences be- tween the percentages indicated, simple arithmetic shows that an elevator with an availability of 98.49% causes difficulty for its users 5½ days per year on average. Even the elevator with the highest availability was out of commission over ¾ of a day per year, on average. Data for individual elevators was available for further analysis during the same reporting period. The results by month for the first elevator (the one most troublesome in Figure 5) are shown in Figure 6. Note that there was a wide range in availability of this particular elevator, which was the most troublesome of the elevators consid- ered. Also, some of the other elevators had the desired 100% availability for multiple months. Data for the other elevators has been omitted to save space. It is important to understand the meaning of the data illustrated in Figures 5 and 6. A lack of availability might mean that a unit could not stop on a particular floor, that a hall button might not call the elevator unless it was pushed several times, or that a security code needed to be entered from a central location in the build- ing. It did not mean that the elevator car was in any dan- ger of falling. This does not happen on modern fail-safe elevators. 6. Analysis In addition to the overall data on availability of the ele- vators during a one-year period illustrated in Figure 5 and the monthly report for the same year, illustrated in Figure 6, data on this complex system were collected by the elevator maintenance company over an approxi- mately nine-month period. There were a total of 74 ser- vice visits during that nine-month period. The results of each visit were entered into the company’s service data- base, which is in the form of a Microsoft Excel spread- sheet. Since a spreadsheet normally contains less infor- mation than a database, and is less easily queried, data analysis is somewhat limited. Initially, there was little concern about the discrepancy between the nine-month period of the service visits and the yearly data reported in Figures 5 and 6. This omis- sion slowed down the analysis considerably, because it could have pointed out one of the most serious problems Figure 5. Percentage of availability of operation of the elevators during a recent one-year period Percentage Up Time  Experiences Analyzing Faults in a Hybrid Distributed System with Access Only to Sanitized Data Copyright © 2010 SciRes. JSEA 452 Figure 6. Percentage of availability of operation by month for the most troublesome elevator during a recent one-year period immediately, had it been fully understood. The entries in the database that, apparently, triggered the technician’s maintenance service call are not very illuminating from the perspective of providing insight into computer faults. The categories indicated are limited to the following: Door_performance Checked/adjusted elevator operation and phone Maintenance on controller/mr_equipment Ropes Motor_generator General_maintenance_procedure Brake_elevator Hall_buttons Door operation/car doors Maintnance_on_car_door/operator/car_top/emg_ light There were other views of this data that were some- what more informative. One was a listing of 43 of the 74 service calls on which specific items that needed to be repaired or replaced were identified in more detail. These specific items could be classified as follows in this list- ing: There were 28 issues that required mechanical re- pairs. There were 12 issues that required the replacement of one or more specific mechanical parts. There were 5 issues that required computer hard- ware repairs. There were 2 issues that required computer software repairs. In this listing, a few of the 43 service calls in which specific items that needed to be repaired or replaced were identified had multiple items, accounting for the 47 items described in the above list. It is now obvious that there are discrepancies between the entries in the database of actions (repairs, replace- ments, hardware-specific repairs, software-specific re- pairs), the number of service calls, and, to some degree, the periods of unavailability of the elevators. It is natural to ask why there are such discrepancies. One possibility that could be eliminated readily in the analysis of this data is the possibility of the elevator ser- vice company cutting corners. The elevators were under a long-term maintenance contract and, under the terms of the service contract, any unresolved issues would result in an additional service call to the elevator service com- pany. Since the service calls required transportation of service personnel, it was in the elevator service com- pany’s best interest to minimize unnecessary extra travel trips. Hence, this possibility was rejected. The elevator company’s central dispatch office as- signed technicians when faults were either detected or called in. Because of the redundancy in each of the ele- vator banks, service calls received lower priority in the dispatch office than locations with a single elevator. Oc- casionally, junior technicians were dispatched. For these reasons, it was felt that a statistical distribution of the time to fix problems would not produce more meaningful  Experiences Analyzing Faults in a Hybrid Distributed System with Access Only to Sanitized Data Copyright © 2010 SciRes. JSEA 453 data than simply reporting aggregated outages times. It is clear that the entries in the technician’s database (door_performance, hall buttons, checked/adjusted ele- vator_operation and phone, ropes, etc.) were restricted to match certain pre-defined categories. Thus, it is reason- able to assume that they might not provide much infor- mation on specific failures, especially for hardware and software failures. When examining the discrepancies, it was noted that the time period were different. One set of data was for a nine-month period, while the other was for one year. It was important to know if the discrepancy was due to the way the elevator service company sanitized the data, or to the way data was collected. In particular, if the dis- crepancy was due to a problem data collection process, what caused this failure and did the result of this failure cause a cascade of related faults? The explanation for this discrepancy was quite simple. Both the company’s database and what we have called the secondary listing of which specific items that needed to be repaired or replaced were accurate, but did not show the failures at the times they were noted by human users and monitors. The data from the technician’s ser- vice call database was accurate and reflected what was actually done (even though the codes were not always very helpful). What happened is that the remote monitoring of what is called the “health and safety” of the elevators via the communications path between the elevator microproces- sors had not been activated during the entire period. Re- initializing this communication allows microprocessors to be reset automatically if there were failures, providing much higher tolerance of hardware and software faults, thereby increasing availability. How was it determined that the remote monitoring of elevator status was not working? (It was not clear from the documentation provided to the building – the cus- tomer – that there even was remote monitoring.) The information was obtained from the elevator company’s newly appointed service manager, who gracefully pro- vided access to the data. A follow-up interview with the building manager of the building complex indicated another potential expla- nation for what had seemed to be an overly large number of microprocessor errors that required either resets or hardware replacement. The cleaning fluid used to clean the surfaces of both the in-elevator control panels and the much simpler hall buttons in several cases had seeped behind the decorative plates and caused electrical shorts. A simple change in the cleaning procedures reduced the number of observed faults. The two actions–enabling the remote monitoring of microprocessor status and enacting new procedures for cleaning – caused a great reduction in faults, with almost no down time when failures did occur as a result of these remaining faults. 7. Conclusions and Suggestions for Future Work Obviously, this was an unusual situation when compared to what is typically studied in the fault tolerance research and community. However, it may be more relevant to the practitioners of fault tolerance who are faced with solv- ing a real-world problem. The following techniques were especially useful in helping to determine the root causes of faults that led to system failures: While nearly all the reports in the maintenance ser- vice databases used pre-defined categories that, at first glance had little useful information, more detailed analy- sis indicated certain commonalities of faults. Interviews with knowledgeable people, such as the building’s manager and the elevator service company’s service manager, led to information that resulted in new policies (for keeping cleaning fluids and gels away from the microprocessors) and the proper use of the remote monitoring system. Unwritten information was useful, such as the exis- tence of the remote monitoring database and the possibil- ity of viewing this database by persons who are not em- ployees of the elevator service company. Reasoning about missing things, such as the miss- ing months in two different views of the maintenance database, led to an understanding of a major lapse in the use of the remote monitoring system. It is likely that many of the lessons learned in this analysis can be useful to practitioners of fault tolerance who are faced with similar problems with the data avail- able to them. REFERENCES [1] Unnamed elevator company, Unnamed Service Database, 2008. [2] A. Avizienis and J. P. Kelly, “Fault Tolerance by Design Diversity: Concepts and Experiments,” IEEE Computer, Vol. 17, No. 8, August 1984, pp. 67-80. [3] B. Randell, “System Structure for Software Fault Tole- rance,” IEEE Transactions on Software Engineering, Vol. 11, No. 2, June 1975, pp. 220-232. [4] R. Amuthakkannan, S. M. Kannan, K. Vijayalakshmi and N. Ramaraj, “Reliability Analysis of Programmable Mechatronics System Using Bayesian Approach,” Intern- ational Journal of Industrial and Systems Engineering, Vol. 4, No. 3, 2009, pp. 303-325. [5] V. Dhudsia, “Guidelines for Equipment Reliability,” Technical Publication, Sematech, Inc, 1997. http://www. sematech.org/docubase/document/1014agen.pdf [6] G. K. Fourlas, “An Approach towards Fault Tolerant Hybrid Control Systems,” Control & Automation Mediter-  Experiences Analyzing Faults in a Hybrid Distributed System with Access Only to Sanitized Data Copyright © 2010 SciRes. JSEA 454 ranean Conference on MED, Corsica, 27-29 June 2007, pp. 1-6. [7] J. D. Musa, A. Iannino and K. Okumoto, “Software Relia- bility: Measurement, Prediction, Application,” Mc-Graw- Hill, Inc. New York, 1987. [8] R. Isermann, “Mechatronic Systems Fundamentals,” Springer, London. 2003. [9] K. Lee, K. C. Kang, E. Koh, W. Chae, B. Kim and B. W. Choi, “Domain-Oriented Engineering of Elevator Control Software: A Product Line Practice,” Proceedings of the First Software Product Line Conference, Denver, August 2000, pp. 3-22. [10] “Facility System Safety Guidebook,” NASA-STD-8719.7, National Aeronautics and Space Administration, 1996. [11] “The use of Computers in Safety Critical Operations,” Final Report of the Study Group on the Safety of Ope- rational Computer Operations, Health and Safety Commission, UK. http://www.hse.gov.uk/nuclear/compu ters.pdf [12] N. Leveson, “Software Safety: Why, What, and How,” ACM Computing Surveys, Vol. 18, No. 2, June 1986, pp. 125-163. [13] D. E. Knuth, “Fundamental Algorithms,” The Art of Com- puter Programming, 3rd Edition, Addison-Wesley, Read- ing, Massachusetts, Vol. 1, 1973. |