Paper Menu >>
Journal Menu >>
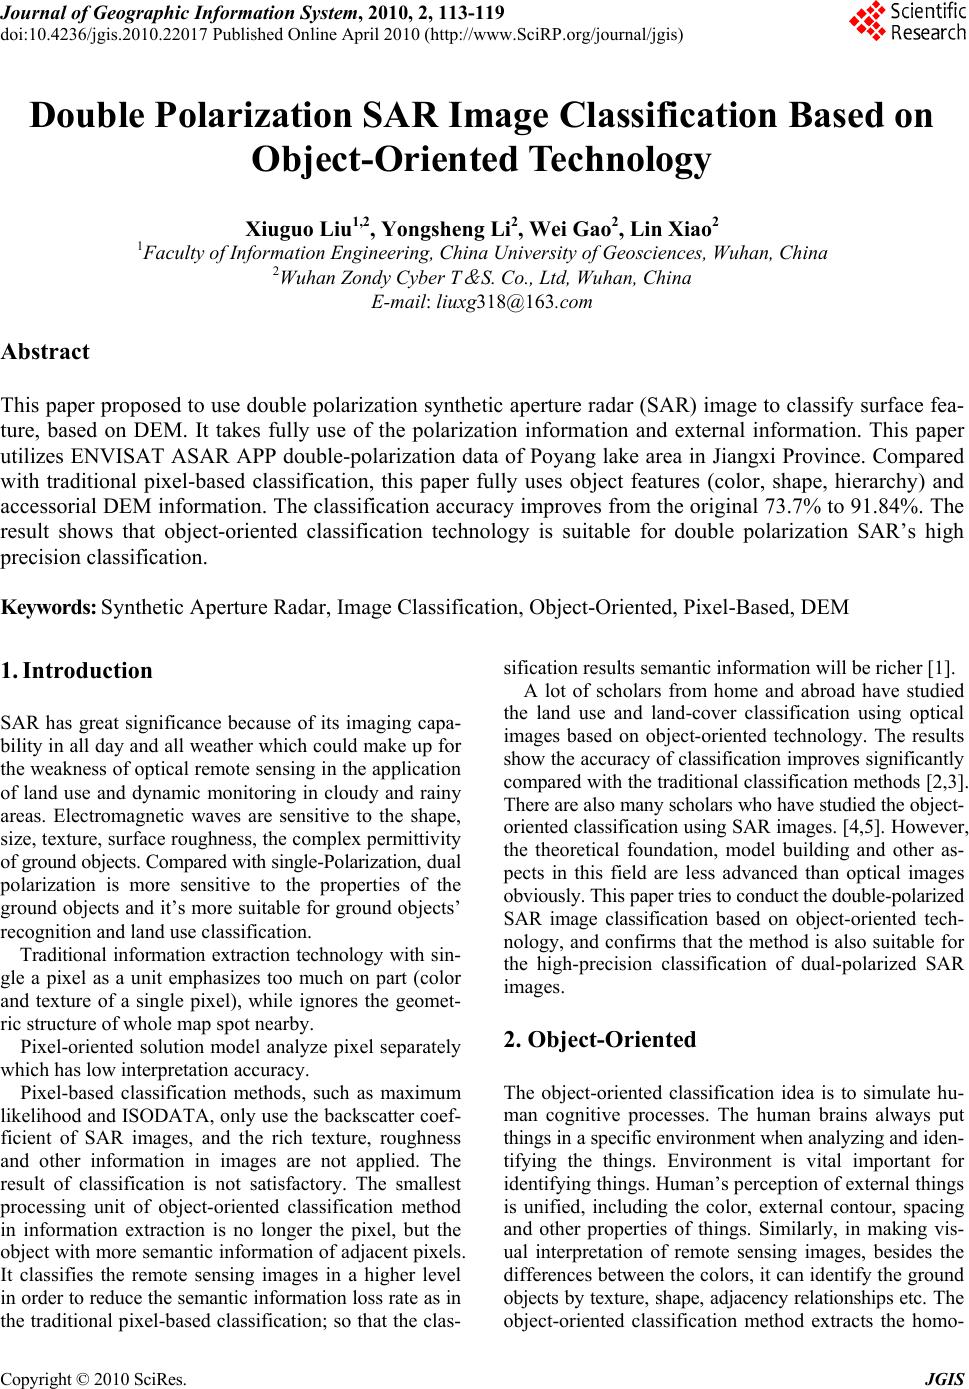 Journal of Geographic Information System, 2010, 2, 113-119 doi:10.4236/jgis.2010.22017 Published Online April 2010 (http://www.SciRP.org/journal/jgis) Copyright © 2010 SciRes. JGIS Double Polarization SAR Image Classification Based on Object-Oriented Technology Xiuguo Liu1,2, Yongsheng Li2, Wei Gao2, Lin Xiao2 1Faculty of Information Engineering, China University of Geosciences, Wuhan, China 2Wuhan Zondy Cyber T & S. Co., Ltd, Wuhan, China E-mail: liuxg318@163.com Abstract This paper proposed to use double polarization synthetic aperture radar (SAR) image to classify surface fea- ture, based on DEM. It takes fully use of the polarization information and external information. This paper utilizes ENVISAT ASAR APP double-polarization data of Poyang lake area in Jiangxi Province. Compared with traditional pixel-based classification, this paper fully uses object features (color, shape, hierarchy) and accessorial DEM information. The classification accuracy improves from the original 73.7% to 91.84%. The result shows that object-oriented classification technology is suitable for double polarization SAR’s high precision classification. Keywords: Synthetic Aperture Radar, Image Classification, Object-Oriented, Pixel-Based, DEM 1. Introduction SAR has great significance because of its imaging capa- bility in all day and all weather which could make up for the weakness of optical remote sensing in the application of land use and dynamic monitoring in cloudy and rainy areas. Electromagnetic waves are sensitive to the shape, size, texture, surface roughness, the complex permittivity of ground objects. Compared with single-Polarization, dual polarization is more sensitive to the properties of the ground objects and it’s more suitab le for ground objects’ recognition and land use classification. Traditional information extraction technology with sin- gle a pixel as a unit emphasizes too much on part (color and texture of a single pixel), while ignores the geomet- ric structure of whole map spot nearby. Pixel-oriented solution model analyze pixel separately which has low interpretation accuracy. Pixel-based classification methods, such as maximum likelihood and ISODATA, only use the backscatter coef- ficient of SAR images, and the rich texture, roughness and other information in images are not applied. The result of classification is not satisfactory. The smallest processing unit of object-oriented classification method in information extraction is no longer the pixel, but the object with more semantic information of adjacent pixels. It classifies the remote sensing images in a higher level in order to reduce the semantic information loss rate as in the traditional pix el-based classification; so that the clas- sification results semantic information will be richer [1]. A lot of scholars from home and abroad have studied the land use and land-cover classification using optical images based on object-oriented technology. The results show the accuracy of classification improves significant ly compared with the traditional classification methods [2,3]. There are also many scholars who have studied the object- oriented classification using SAR images. [4,5]. However, the theoretical foundation, model building and other as- pects in this field are less advanced than optical images obviously. This paper tries t o conduct the double-pol arized SAR image classification based on object-oriented tech- nology, and confirms that the method is also suitable for the high-precision classification of dual-polarized SAR images. 2. Object-Oriented The object-oriented classification idea is to simulate hu- man cognitive processes. The human brains always put things in a specific environment when analyzing and iden- tifying the things. Environment is vital important for identifying th ings. Human’ s pe rception o f ex tern al th ing s is unified, including the color, external contour, spacing and other properties of things. Similarly, in making vis- ual interpretation of remote sensing images, besides the differences between the colors, it can identify the ground objects by texture, shape, adjacency relationships etc. The object-oriented classification method extracts the homo- 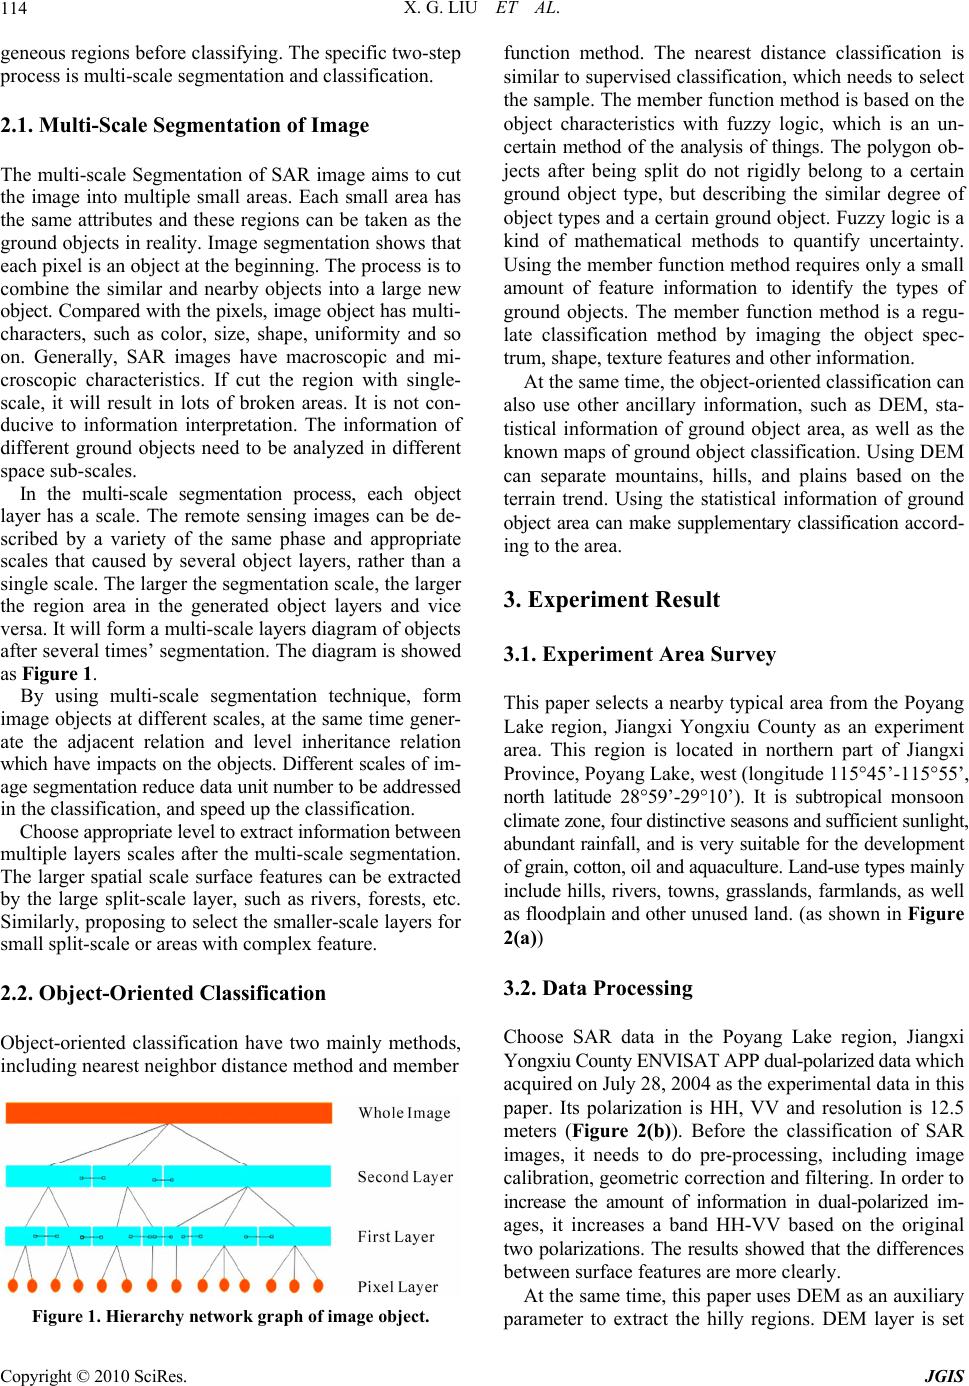 X. G. LIU ET AL. 114 geneous regions before classifying. The specific two-step process is multi-scale segmentation and classification. 2.1. Multi-Scale Segmentation of Image The multi-scale Segmentation of SAR image aims to cut the image into multiple small areas. Each small area has the same attributes and these regions can be taken as the ground objects in reality. Image seg mentation shows that each pixel is an object at the beginning. The process is to combine the similar and nearby objects into a large new object. Compared with the pixels, image object has mult i- characters, such as color, size, shape, uniformity and so on. Generally, SAR images have macroscopic and mi- croscopic characteristics. If cut the region with single- scale, it will result in lots of broken areas. It is not con- ducive to information interpretation. The information of different ground objects need to be analyzed in different space sub-scales. In the multi-scale segmentation process, each object layer has a scale. The remote sensing images can be de- scribed by a variety of the same phase and appropriate scales that caused by several object layers, rather than a single scale. The larger the segmentation scale, the larger the region area in the generated object layers and vice versa. It will form a multi-scale layers diagram of objects afte r se ver al times’ seg mentation. The d iagram is showed as Figure 1. By using multi-scale segmentation technique, form image objects at different scales, at the same time gener- ate the adjacent relation and level inheritance relation which have impacts on the objects. Different scales of i m- age segmentation reduce data unit number to be addr es s ed in the classification, and speed up the classification. Choose appropriate le vel t o ext ract information between multiple layers scales after the multi-scale segmentation. The larger spatial scale surface features can be extracted by the large split-scale layer, such as rivers, forests, etc. Similarly, proposing to select the smaller-scale layers for small split-scale or areas with complex feature. 2.2. Object-Oriented Classification Object-oriented classification have two mainly methods, including nearest neighbor distance method and member Figure 1. Hierarchy network graph of image object. function method. The nearest distance classification is similar to supervised classification, which needs to select the sample. The member function method is based on the object characteristics with fuzzy logic, which is an un- certain method of the analysis of things. The polygon ob- jects after being split do not rigidly belong to a certain ground object type, but describing the similar degree of object types and a certain ground object. Fuzzy logic is a kind of mathematical methods to quantify uncertainty. Using the member function method requires only a small amount of feature information to identify the types of ground objects. The member function method is a regu- late classification method by imaging the object spec- trum, shape, texture features and other information. At the same time, the object-oriented classification can also use other ancillary information, such as DEM, sta- tistical information of ground object area, as well as the known maps of ground obj ect classification. Using DEM can separate mountains, hills, and plains based on the terrain trend. Using the statistical information of ground object area can make supplementary classification accord- ing to the area. 3. Experiment Result 3.1. Experiment Area Survey This paper selects a nearby typical area from the Poyang Lake region, Jiangxi Yongxiu County as an experiment area. This region is located in northern part of Jiangxi Province, Poyang Lake , west (long itud e 115°45’-115 °55’, north latitude 28°59’-29°10’). It is subtropical monsoon climat e zo ne , f ou r di sti nct i ve s e aso ns a n d s uf fic ie nt sunlight, abundant rainfall, and is very suitable for the development of grain, cotton, oil and aquacu lture. Land-u se types ma i nly include hills, rivers, towns, grasslands, farmlands, as well as floodplain and other unus ed la nd. (a s sho wn in Figure 2(a)) 3.2. Data Processing Choose SAR data in the Poyang Lake region, Jiangxi Yongxiu County ENVISAT APP dual-polarized data which acquired on July 28, 2004 as the experimental data in this paper. Its polarization is HH, VV and resolution is 12.5 meters (Figure 2(b)). Before the classification of SAR images, it needs to do pre-processing, including image calibration, geometric correction and filtering. In order to increase the amount of information in dual-polarized im- ages, it increases a band HH-VV based on the original two polarizations. The results showed that the differences between surface features are more clearly. At the same time, this paper uses DEM as an auxiliary parameter to extract the hilly regions. DEM layer is set Copyright © 2010 SciRes. JGIS 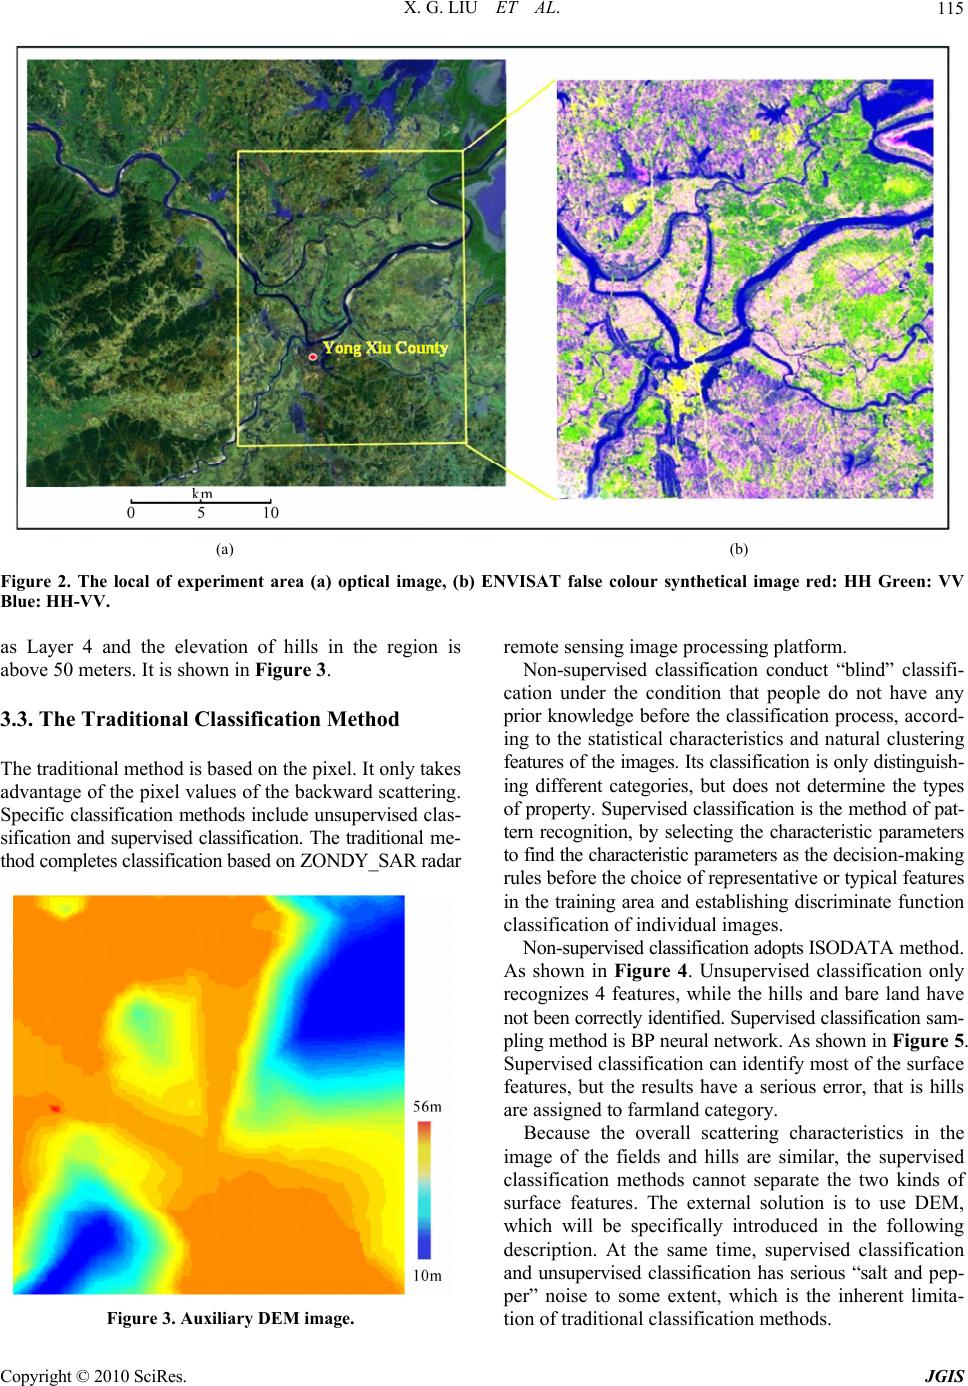 X. G. LIU ET AL. Copyright © 2010 SciRes. JGIS 115 (a) (b) Figure 2. The local of experiment area (a) optical image, (b) ENVISAT false colour synthetical image red: HH Green: VV Blue: HH-VV. as Layer 4 and the elevation of hills in the region is above 50 meters. It is shown in Figure 3. remote sensing image processing platform. Non-supervised classification conduct “blind” classifi- cation under the condition that people do not have any prior knowledge before the classification process, accord- ing to the statistical characteristics and natural clustering features of the images. Its classification is only distinguish- ing different categories, but does not determine the types of property. Supervised classification is the method of pat- tern recognition, by selecting the characteristic parameters to find the characteristic parameters as the decisi o n- ma ki ng rules before the choice of representative or typical features in the training area and establishing discriminate function classification of individual images. 3.3. The Traditional Classification Method The traditional method is based on the pixel. It only takes advantage of the pixel values of the backward scattering. Specific classification methods include unsupervised clas - sification and supervised classification. The traditional me - thod completes classification based on ZONDY_SAR radar Non-supervised classification adopts ISODATA m etho d. As shown in Figure 4. Unsupervised classification only recognizes 4 features, while the hills and bare land have not been correctly id entified. Sup ervised classif ication s am- pling method is BP neural network. As shown in Figure 5. Supervised classification can identify most of the su rface features, but the results have a serious error, that is hills are assigned to farmland category. Because the overall scattering characteristics in the image of the fields and hills are similar, the supervised classification methods cannot separate the two kinds of surface features. The external solution is to use DEM, which will be specifically introduced in the following description. At the same time, supervised classification and unsupervised classification has serious “salt and pep- per” noise to some extent, which is the inherent limita- tion of traditional classification methods. Figure 3. Auxiliary DEM image. 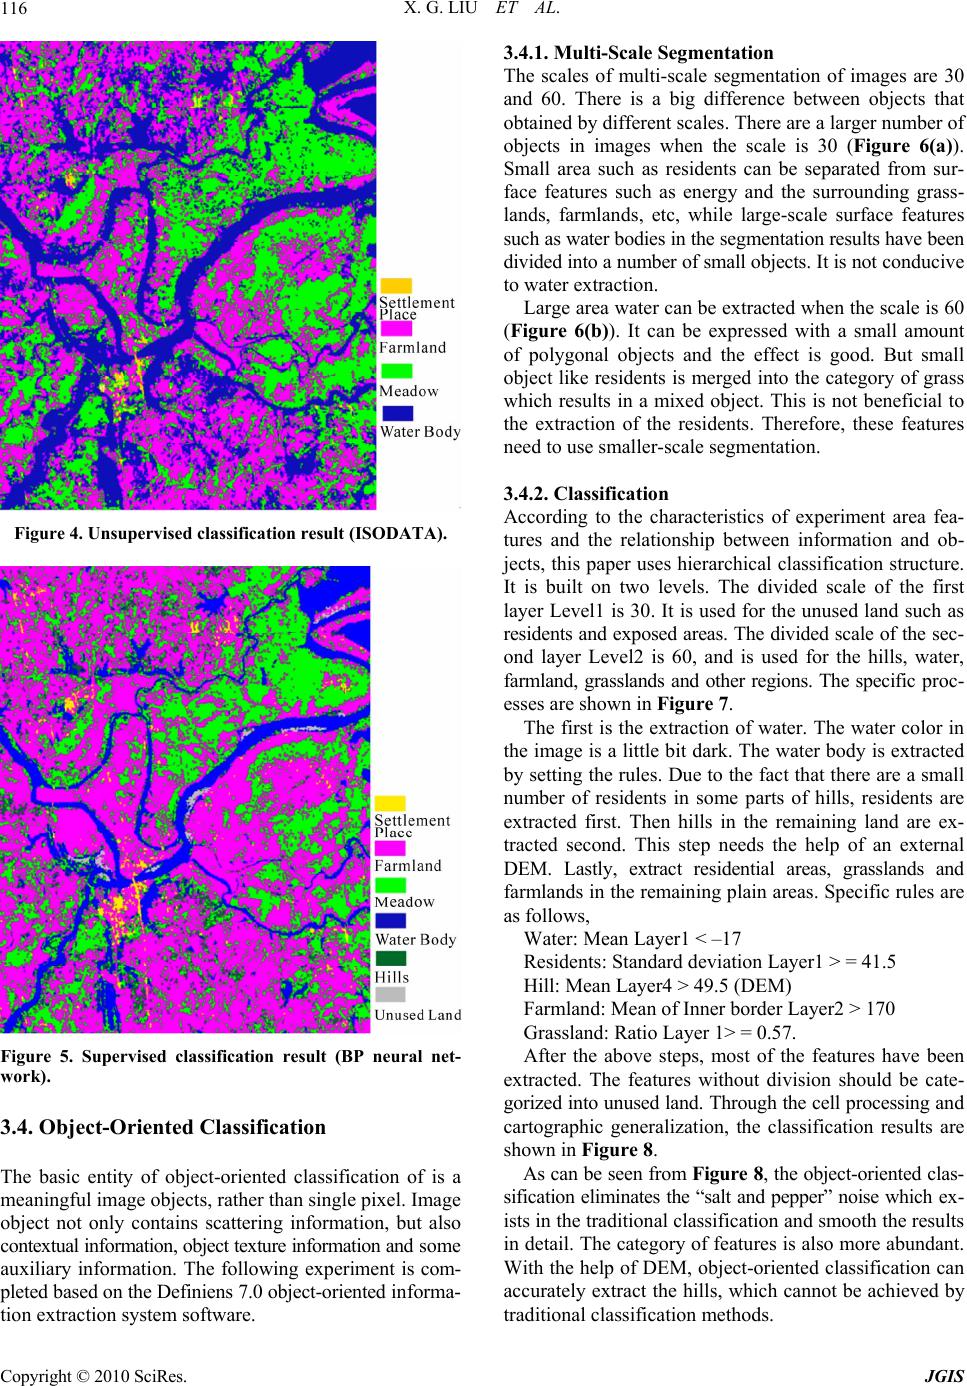 X. G. LIU ET AL. 116 Figure 4. Unsupervised classification result (ISODATA). Figure 5. Supervised classification result (BP neural net- work). 3.4. Object-Oriented Classification The basic entity of object-oriented classification of is a meaningful image objects, rather than single pixel. Image object not only contains scattering information, but also contextual information, object texture information and som e auxiliary information. The following experiment is com- pleted based on the Definiens 7.0 object-oriented in for ma - tion extraction system software. 3.4.1. Multi-Scale Segmenta t i o n The scales of multi-scale segmentation of images are 30 and 60. There is a big difference between objects that obtained by different scales. There are a larger number of objects in images when the scale is 30 (Figure 6(a)). Small area such as residents can be separated from sur- face features such as energy and the surrounding grass- lands, farmlands, etc, while large-scale surface features such as water bodies in the segmentation results have been divided into a number of small objects. It is not con d u civ e to water extraction. Large area water can be extracted when the scale is 60 (Figure 6(b)). It can be expressed with a small amount of polygonal objects and the effect is good. But small object like residents is merged into the category of grass which results in a mixed object. This is not beneficial to the extraction of the residents. Therefore, these features need to use smaller-scale segmentation. 3.4.2. Cl assification According to the characteristics of experiment area fea- tures and the relationship between information and ob- jects, this paper uses hierarchical classification structure. It is built on two levels. The divided scale of the first layer Level1 is 30. It is used for the unused land such as residents and exposed areas. The divided scale of the se c- ond layer Level2 is 60, and is used for the hills, water, farmland, grasslands and other regions. The specific proc- esses are shown in Figure 7. The first is the extraction of water. The water color in the image is a little bit dark. The water body is extracted by setting the rules. Due to the fact that there are a small number of residents in some parts of hills, residents are extracted first. Then hills in the remaining land are ex- tracted second. This step needs the help of an external DEM. Lastly, extract residential areas, grasslands and farmlands in the remaining plain areas. Specific rules are as follows, Water: Mean Layer1 < –17 Residents: Standard deviation Layer1 > = 41.5 Hill: Mean Layer4 > 49.5 (DEM) Farmland: Mean of Inner border Layer2 > 170 Grassland: Ratio Layer 1> = 0.57. After the above steps, most of the features have been extracted. The features without division should be cate- gorized into unused land. Through the cell processing an d cartographic generalization, the classification results are shown in Figure 8. As can be seen from Figure 8, the object-oriented clas- sification eliminates the “salt and pepper” noise which ex - ists in the traditional classificatio n and smooth th e results in detail. The category of features is also more abundant. With the help of DEM, object-oriented classification can accurately extract the hills, which cannot be achieved by traditional classification methods. Copyright © 2010 SciRes. JGIS  X. G. LIU ET AL.117 3.5. Accuracy Evaluation Choose the results of supervised classification and object- oriented classification to do accuracy evaluation compari- son. The two methods are both based on sam ples. (a) (b) Figure 6. Result of Different-Scale Segmentation. (a) scale 30; (b) scale 60. Figure 7. Processing flow chart of object-oriented classifi- cation. Figure 8. Result of object-oriented classification. Supervised classification is based on a sample of pixel, while when it comes to object-oriented methods; the sam- ple is based on image objects shown in Table 1 and Ta- ble 2. As shown in the Table 1 and Table 2 which record the classification accuracy of evaluation results, the overall classification accuracy and Kappa coefficient of the tra- ditional supervised classification is 73.7% and 0.654. While the overall object-oriented classification accuracy and Kappa coefficient is 91.84% and 0.895, respectively. This shows that the object-oriented technology improves the accuracy of SAR image classification significantly. The traditional method is very easy to mislead hill to farmland because of the similar scattering characteristics. By using the external DEM, the object-oriented approach Copyright © 2010 SciRes. JGIS 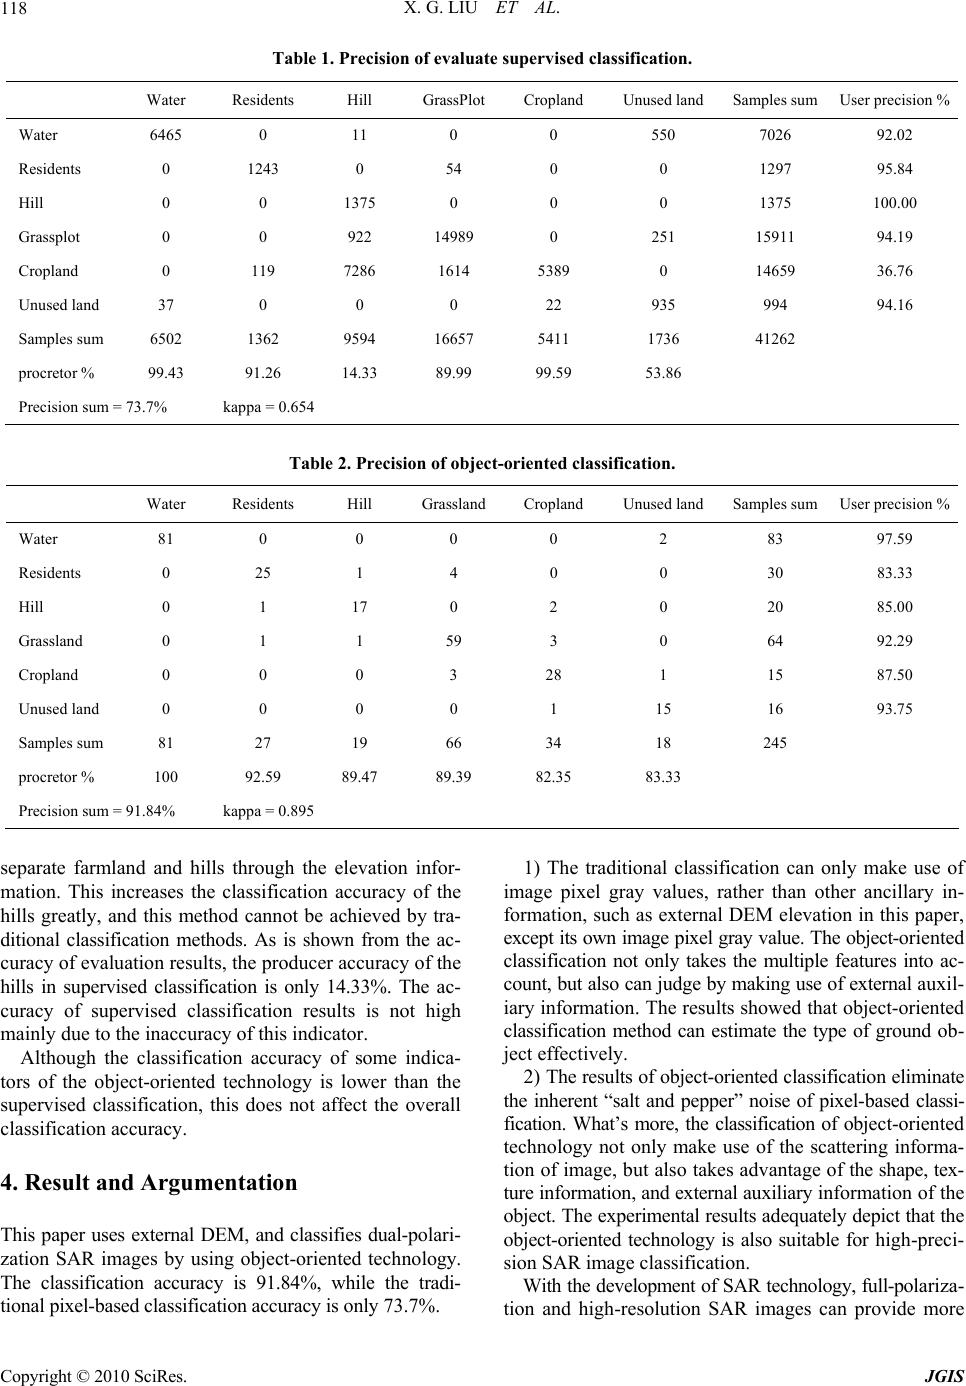 X. G. LIU ET AL. Copyright © 2010 SciRes. JGIS 118 Table 1. Precision of evaluate supervised classification. Water Residents Hill GrassPlotCropland Unused land Samples sum User precision % Water 6465 0 11 0 0 550 7026 92.02 Residents 0 1243 0 54 0 0 1297 95.84 Hill 0 0 1375 0 0 0 1375 100.00 Grassplot 0 0 922 14989 0 251 15911 94.19 Cropland 0 119 7286 1614 5389 0 14659 36.76 Unused land 37 0 0 0 22 935 994 94.16 Samples sum 6502 1362 9594 16657 5411 1736 41262 procretor % 99.43 91.26 14.33 89.99 99.59 53.86 Precision sum = 73 .7% kappa = 0.654 Table 2. Precision of object-oriented classification. Water Residents Hill GrasslandCropland Unused land Samples sum User precision % Water 81 0 0 0 0 2 83 97.59 Residents 0 25 1 4 0 0 30 83.33 Hill 0 1 17 0 2 0 20 85.00 Grassland 0 1 1 59 3 0 64 92.29 Cropland 0 0 0 3 28 1 15 87.50 Unused land 0 0 0 0 1 15 16 93.75 Samples sum 81 27 19 66 34 18 245 procretor % 100 92.59 89.47 89.39 82.35 83.33 Precision sum = 91 .84% kappa = 0.895 separate farmland and hills through the elevation infor- mation. This increases the classification accuracy of the hills greatly, and this method cannot be achieved by tra- ditional classification methods. As is shown from the ac- curacy of evaluation results, the producer accuracy of the hills in supervised classification is only 14.33%. The ac- curacy of supervised classification results is not high mainly due to the inaccuracy of this indicator. Although the classification accuracy of some indica- tors of the object-oriented technology is lower than the supervised classification, this does not affect the overall classification accuracy. 4. Result and Argumentation This paper uses external DEM, and classifies dual-polari- zation SAR images by using object-oriented technology. The classification accuracy is 91.84%, while the tradi- tional pixel-based classification accuracy is only 73.7%. 1) The traditional classification can only make use of image pixel gray values, rather than other ancillary in- formation, such as external DEM elevation in this pap er, except its own image pixel gray value. The object-o ri en ted classification not only takes the multiple features into ac- count, but also can judge by making use of external aux il- iary information. The results showed that object-oriented classification method can estimate the type of ground ob- ject effectively. 2) The results of object-oriented classification eliminate the inherent “salt and pepper” noise of pixel-based classi- fication. What’s more, the classification of object-oriented technology not only make use of the scattering informa- tion of image, but also takes advantage of the shape, tex- ture information, and external auxiliary info r ma ti o n of th e object. The experimental results adequately depict that the object-oriented technology is also suitable for high-preci- sion SAR image classification. With th e developmen t of SAR techno logy, full-po la ri za - tion and high-resolution SAR images can provide more 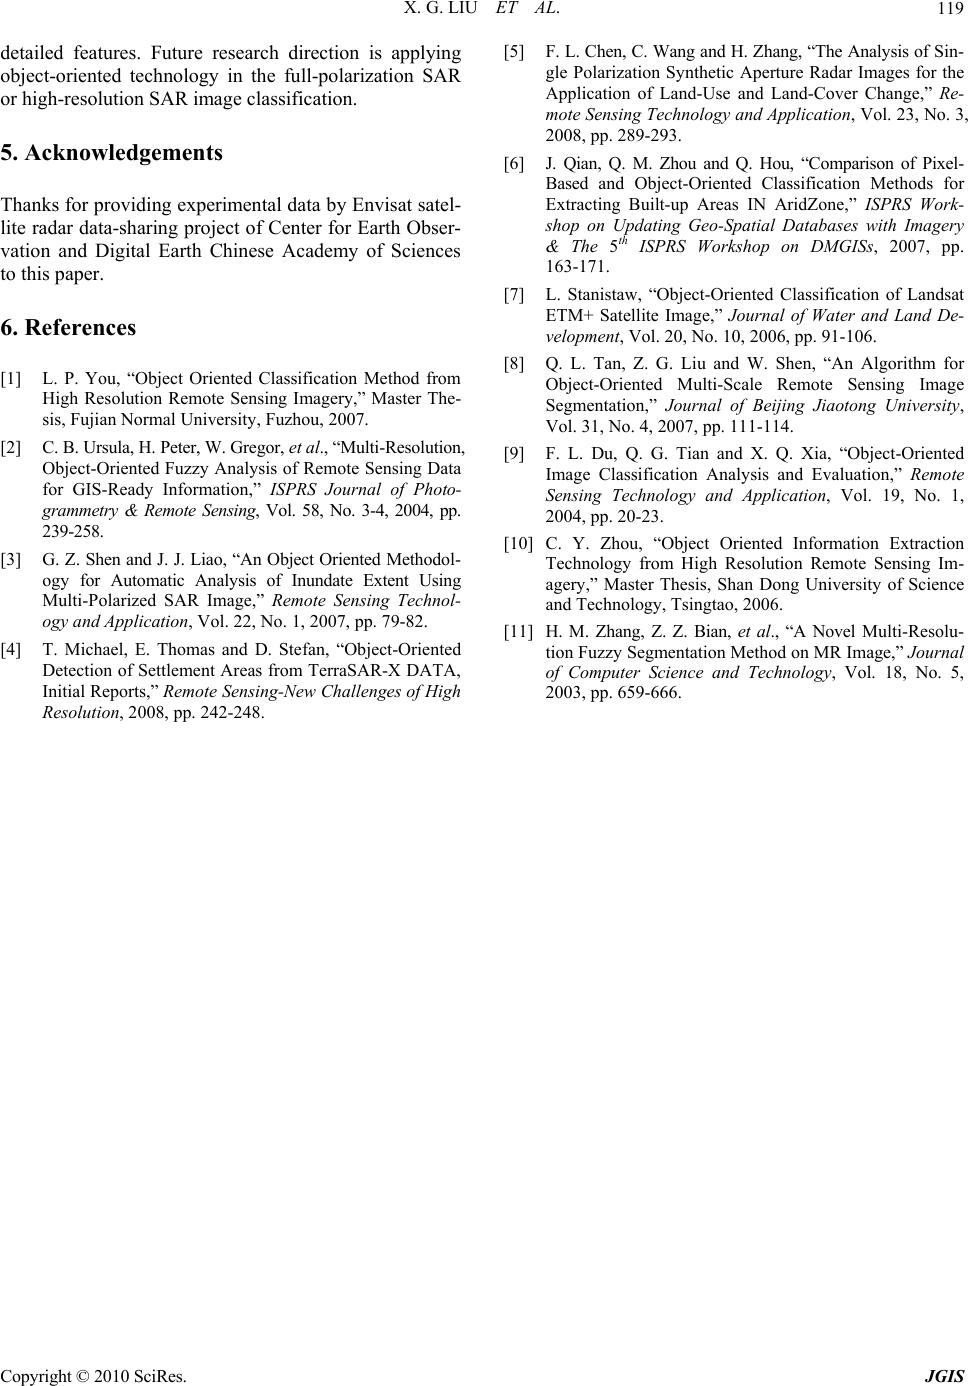 X. G. LIU ET AL.119 detailed features. Future research direction is applying object-oriented technology in the full-polarization SAR or high-resolution SAR image classification. 5. Acknowledgements Thanks for providing experimental data by Envisat satel- lite radar data-sharing project of Center for Earth Obser- vation and Digital Earth Chinese Academy of Sciences to this paper. 6. References [1] L. P. You, “Object Oriented Classification Method from High Resolution Remote Sensing Imagery,” Master The- sis, Fujian Normal University, Fuzhou, 2007. [2] C. B. Ursula, H. Peter, W. Gregor, et al., “Multi-Resolution, Object-Oriented Fuzzy Analysis of Remote Sensing Data for GIS-Ready Information,” ISPRS Journal of Photo- grammetry & Remote Sensing, Vol. 58, No. 3-4, 2004, pp. 239-258. [3] G. Z. Shen and J. J. Liao, “An Object Oriented Methodol - ogy for Automatic Analysis of Inundate Extent Using Multi-Polarized SAR Image,” Remote Sensing Technol- ogy and Application, Vol. 22, No. 1, 2007, pp. 79-82. [4] T. Michael, E. Thomas and D. Stefan, “Object-Oriented Detection of Settlement Areas from TerraSAR-X DATA, Initial Reports,” Remote Sensing-New Challenges of High Resolution, 2008, pp. 242-248. [5] F. L. Chen, C. Wang and H. Zhang, “The Analysis of S in- gle Polarization Synthetic Aperture Radar Images for the Application of Land-Use and Land-Cover Change,” Re- mote Sensing Technology and Application, Vol. 23, No. 3, 2008, pp. 289-293. [6] J. Qian, Q. M. Zhou and Q. Hou, “Comparison of Pixel- Based and Object-Oriented Classification Methods for Extracting Built-up Areas IN AridZone,” ISPRS Work- shop on Updating Geo-Spatial Databases with Imagery & The 5th ISPRS Workshop on DMGISs, 2007, pp. 163-171. [7] L. Stanistaw, “Object-Oriented Classification of Landsat ETM+ Satellite Image,” Journal of Water and Land De- velopment, Vol. 20, No. 10, 2006, pp. 91-106. [8] Q. L. Tan, Z. G. Liu and W. Shen, “An Algorithm for Object-Oriented Multi-Scale Remote Sensing Image Segmentation,” Journal of Beijing Jiaotong University, Vol. 31, No. 4, 2007, pp. 111-114. [9] F. L. Du, Q. G. Tian and X. Q. Xia, “Object-Oriented Image Classification Analysis and Evaluation,” Remote Sensing Technology and Application, Vol. 19, No. 1, 2004, pp. 20-23. [10] C. Y. Zhou, “Object Oriented Information Extraction Technology from High Resolution Remote Sensing Im- agery,” Master Thesis, Shan Dong University of Science and Technology, Tsingtao, 2006. [11] H. M. Zhang, Z. Z. Bian, et al., “A Novel Multi-Resolu- tion Fuzzy Segmentation Method on MR Image,” Journal of Computer Science and Technology, Vol. 18, No. 5, 2003, pp. 659-666. Copyright © 2010 SciRes. JGIS |