Paper Menu >>
Journal Menu >>
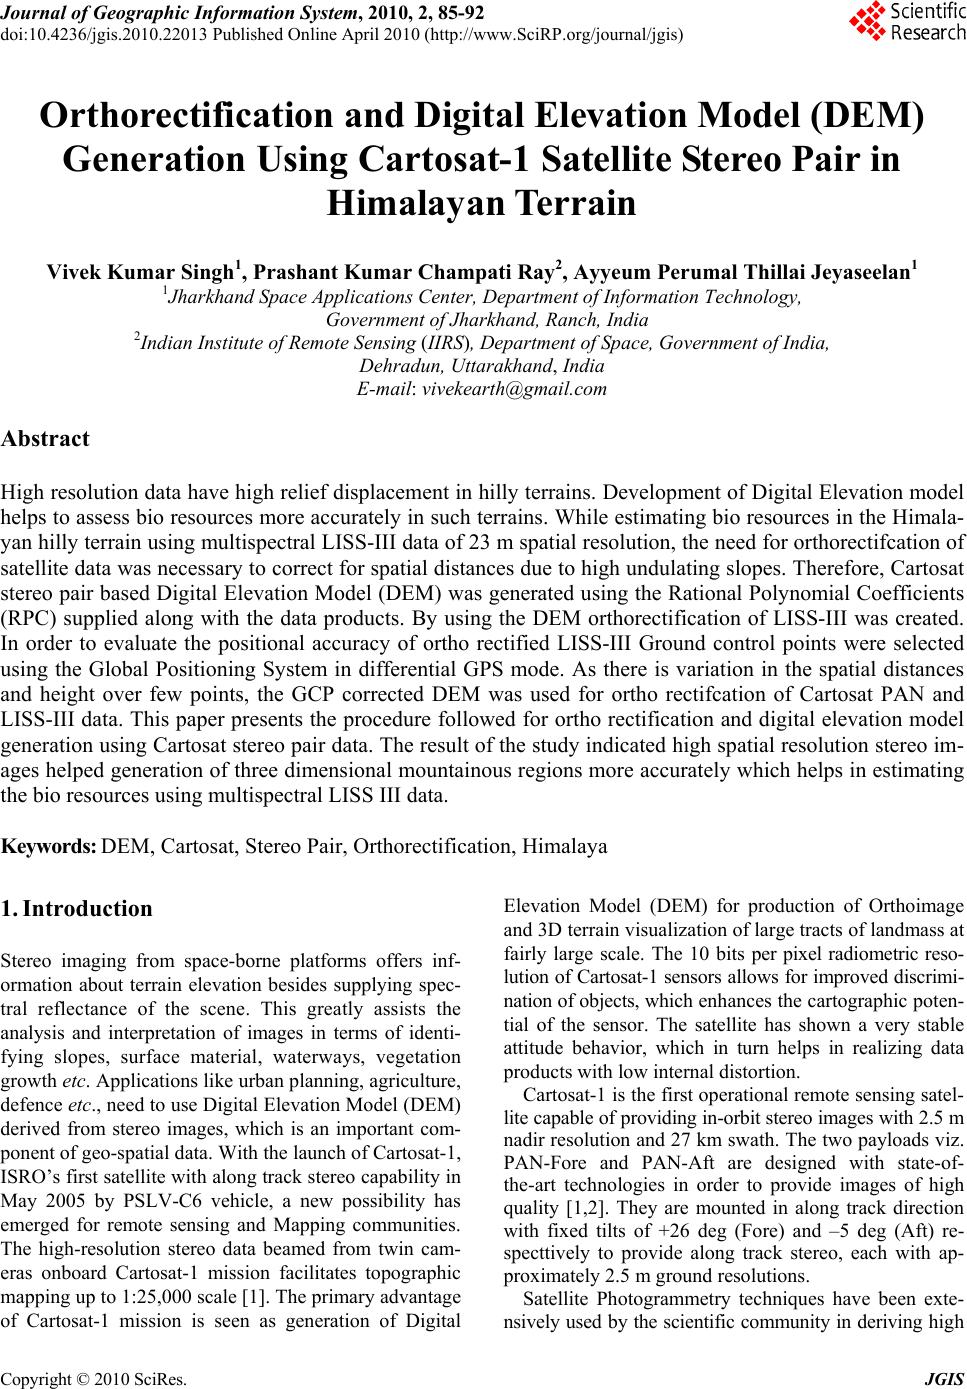 Journal of Geographic Information System, 2010, 2, 85-92 doi:10.4236/jgis.2010.22013 Published Online April 2010 (http://www.SciRP.org/journal/jgis) Copyright © 2010 SciRes. JGIS Orthorectification and Digital Elevation Model (DEM) Generation Using Cartosat-1 Satellite Stereo Pair in Himalayan Terrain Vivek Kumar Singh1, Prashant Kumar Champati Ray2, Ayyeum Perumal Thillai Jeyaseelan1 1Jharkhand Space Applications Center, Department of Information Technology, Governm e nt of Jharkhand, Ra nc h, India 2Indian Institute of Remote Sensing (IIRS), Department of Space, Government of India, Dehradun, Uttarakhand, India E-mail: vivekearth@gmail.com Abstract High resolution data have high relief displacement in hilly terrains. Development of Digital Elevation model helps to assess bio resources more accurately in such terrains. While estimating bio resources in the Himala- yan hilly terrain using multispectral LISS-III data of 23 m spatial resolution, the need for orthorectifcation of satellite data was necessary to correct for spatial distances due to high undulating slopes. Therefore, Cartosat stereo pair based Digital Elevation Model (DEM) was generated using the Rational Polynomial Coefficients (RPC) supplied along with the data products. By using the DEM orthorectification of LISS-III was created. In order to evaluate the positional accuracy of ortho rectified LISS-III Ground control points were selected using the Global Positioning System in differential GPS mode. As there is variation in the spatial distances and height over few points, the GCP corrected DEM was used for ortho rectifcation of Cartosat PAN and LISS-III data. This paper presents the procedure followed for ortho rectification and digital elevation model generation using Cartosat stereo pair data. The result of the study indicated high spatial resolution stereo im- ages helped generation of three dimensional mountainous regions more accurately which helps in estimating the bio resources using multispectral LISS III data. Keywords: DEM, Cartosat, Stereo Pair, Orthorectification, Himalaya 1. Introduction Stereo imaging from space-borne platforms offers inf- ormation about terrain elevation besides supplying spec- tral reflectance of the scene. This greatly assists the analysis and interpretation of images in terms of identi- fying slopes, surface material, waterways, vegetation growth etc. Applications like urban planning, agriculture, defence etc., need to use Digital Elevation Model (DEM) derived from stereo images, which is an important com- ponent of geo-spatial data. With the launch of Cartosat-1, ISRO’s first satellite with along track stereo capability in May 2005 by PSLV-C6 vehicle, a new possibility has emerged for remote sensing and Mapping communities. The high-resolution stereo data beamed from twin cam- eras onboard Cartosat-1 mission facilitates topographic mapping up to 1:25,000 scale [1]. The primary advantage of Cartosat-1 mission is seen as generation of Digital Elevation Model (DEM) for production of Orthoimage and 3D terrain visualization of large tracts of landmass at fairly large scale. The 10 bits per pixel radiometric reso- lution of Cartosat-1 sensors allows for improved discrimi- nation of objects, which enhan ces the cart ogra phi c po ten- tial of the sensor. The satellite has shown a very stable attitude behavior, which in turn helps in realizing data products with low internal disto rtion. Cartosat-1 is the first operational remote sensing satel- lite capable of providing in-orbit stereo images with 2.5 m nadir resolution and 27 km swath. The two payloads viz. PAN-Fore and PAN-Aft are designed with state-of- the-art technologies in order to provide images of high quality [1,2]. They are mounted in along track direction with fixed tilts of +26 deg (Fore) and –5 deg (Aft) re- specttively to provide along track stereo, each with ap- proximately 2.5 m ground resolutions. Satellite Photogrammetry techniques have been exte- nsively used by the scientific community in deriving hig h 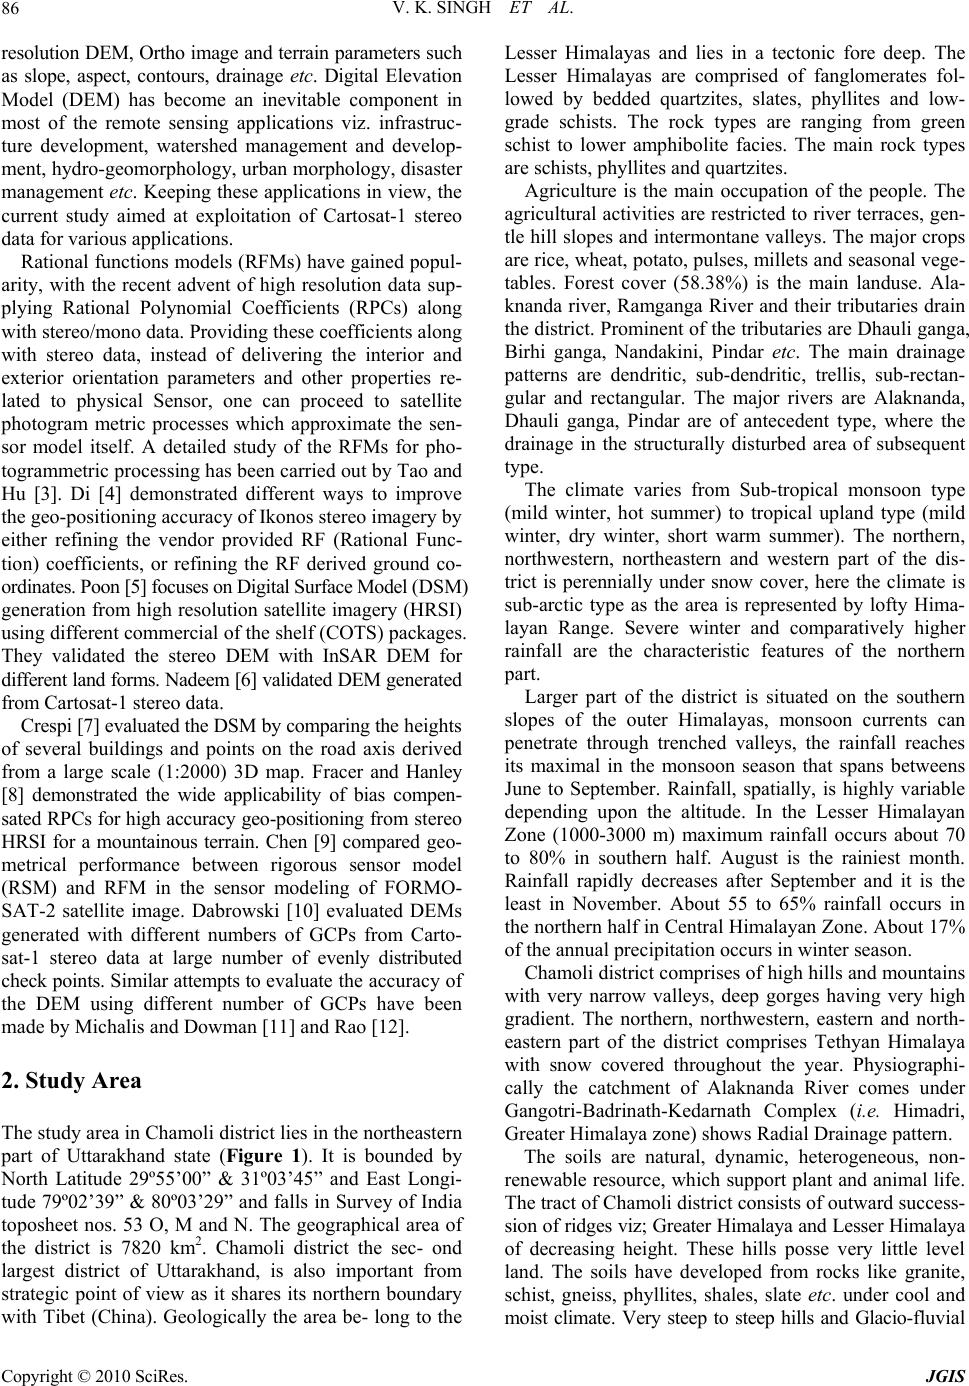 V. K. SINGH ET AL. 86 resolution DEM, Ortho image and terrain parameters such as slope, aspect, contours, drainage etc. Digital Elevation Model (DEM) has become an inevitable component in most of the remote sensing applications viz. infrastruc- ture development, watershed management and develop- ment, hydro-geomorphology, urban morphology, disaster management etc. Keeping these applicatio ns in view, the current study aimed at exploitation of Cartosat-1 stereo data for various applications. Rational functions models (RFMs) have gained popul- arity, with the recent advent of high resolution data sup- plying Rational Polynomial Coefficients (RPCs) along with stereo/mono data. Providing these coefficients along with stereo data, instead of delivering the interior and exterior orientation parameters and other properties re- lated to physical Sensor, one can proceed to satellite photogram metric processes which approximate the sen- sor model itself. A detailed study of the RFMs for pho- togrammetric processing has been carried out by Tao and Hu [3]. Di [4] demonstrated different ways to improve the geo-positioning accuracy of Ikonos stereo imagery by either refining the vendor provided RF (Rational Func- tion) coefficients, or refining the RF derived ground co- ordinates. Poon [5] focuses on Digital Surface Model (DSM) generation from high resolution satellite imagery (HRSI) using different commercial of the shelf (COTS) packages. They validated the stereo DEM with InSAR DEM for different land forms. Nadeem [6] valida ted DEM ge ne ra te d from Cartosat-1 stereo data. Crespi [7] evaluated the DSM by comparing the h e i ght s of several buildings and points on the road axis derived from a large scale (1:2000) 3D map. Fracer and Hanley [8] demonstrated the wide applicability of bias compen- sated RPCs for high accuracy geo-positioning f ro m st ere o HRSI for a mountainous terrain. Chen [9] compared geo- metrical performance between rigorous sensor model (RSM) and RFM in the sensor modeling of FORMO- SAT-2 satellite image. Dabrowski [10] evaluated DEMs generated with different numbers of GCPs from Carto- sat-1 stereo data at large number of evenly distributed check points. Similar attempts to evaluate the accuracy of the DEM using different number of GCPs have been made by Michalis and Dowman [11] and Rao [12]. 2. Study Area The study area in Chamoli district lies in the northeastern part of Uttarakhand state (Figure 1). It is bounded by North Latitude 29º55’00” & 31º03’45” and East Longi- tude 79º02’39” & 80º03’29” and falls in Survey of India toposheet nos. 53 O, M and N. The geographical area of the district is 7820 km2. Chamoli district the sec- ond largest district of Uttarakhand, is also important from strategic point of view as it shares its northern boundary with Tibet (China). Geologically the area be- long to the Lesser Himalayas and lies in a tectonic fore deep. The Lesser Himalayas are comprised of fanglomerates fol- lowed by bedded quartzites, slates, phyllites and low- grade schists. The rock types are ranging from green schist to lower amphibolite facies. The main rock types are schists, phyllites and quartzites. Agriculture is the main occupation of the people. The agricultural activities are restricted to river terraces, gen- tle hill slopes and intermontane valleys. The major crops are rice, wheat, potato, pulses, millets and seasonal vege- tables. Forest cover (58.38%) is the main landuse. Ala- knanda river, Ramganga River and their tributaries drain the district. Prominent of the tributaries are Dh auli ganga, Birhi ganga, Nandakini, Pindar etc. The main drainage patterns are dendritic, sub-dendritic, trellis, sub-rectan- gular and rectangular. The major rivers are Alaknanda, Dhauli ganga, Pindar are of antecedent type, where the drainage in the structurally disturbed area of subsequent type. The climate varies from Sub-tropical monsoon type (mild winter, hot summer) to tropical upland type (mild winter, dry winter, short warm summer). The northern, northwestern, northeastern and western part of the dis- trict is perennially under snow cover, here the climate is sub-arctic type as the area is represented by lofty Hima- layan Range. Severe winter and comparatively higher rainfall are the characteristic features of the northern part. Larger part of the district is situated on the southern slopes of the outer Himalayas, monsoon currents can penetrate through trenched valleys, the rainfall reaches its maximal in the monsoon season that spans betweens June to September. Rainfall, spatially, is highly variable depending upon the altitude. In the Lesser Himalayan Zone (1000-3000 m) maximum rainfall occurs about 70 to 80% in southern half. August is the rainiest month. Rainfall rapidly decreases after September and it is the least in November. About 55 to 65% rainfall occurs in the northern half in Central Himalayan Zone. About 17% of the annual precipitation occurs in winter season. Chamoli district comprises of high hills and mountains with very narrow valleys, deep gorges having very high gradient. The northern, northwestern, eastern and north- eastern part of the district comprises Tethyan Himalaya with snow covered throughout the year. Physiographi- cally the catchment of Alaknanda River comes under Gangotri-Badrinath-Kedarnath Complex (i.e. Himadri, Greater Himalaya zone) shows Radial Drainage pattern. The soils are natural, dynamic, heterogeneous, non- renewable resource, which support plant and animal life. The tract of Chamoli district consists of outward success- sion of ridges viz; Greater Himalaya and Lesser Himalaya of decreasing height. These hills posse very little level land. The soils have developed from rocks like granite, schist, gneiss, phyllites, shales, slate etc. under cool and moist climate. Very steep to steep hills and Glacio-fluvial Copyright © 2010 SciRes. JGIS  V. K. SINGH ET AL. Copyright © 2010 SciRes. JGIS 87 Figure 1. Satellite image showing study area. 4. Data Processing and Methodology valleys are dominantly occupied with very shallow to moderately shallow excessively drained, sandy-skeletal to loamy-sk eletal, neu tral to sli ghtly acidic w ith low av ai l- able water capacity soils. They have been classified as Lithic/Typic Cryorthents. These soils are in general un- der sparse vegetation. The Lesser Himalayan range is mainly composed of highly compressed and altered rocks like granite, phyllites, quartzite etc. and a major part of it is under forest. Intermittent sparse patchy terraced culti- vation is also practiced on fairly steep hill slop es whereas dry and wet cultivation are prevalent on the uplands and low-lying valleys respectively. The broader valley slopes dominantly have deep, well drained, fine-loamy, moder- ately acidic and slightly st ony. A standard methodology has been adopted for the generat- ion of DEM and ortho Image as is shown in Figure 2. It comprises of reconnaissance survey and DGPS survey, establishment of reference station by network adjustment with IGS stations , establishment of a sub reference station with respect to reference station, establishment of GCPs with respect to sub-reference station, stereo data analysis using RPCs and updation of RPCs using GCPs, generation of DEM and Ortho image generation from DEM, accuracy assessment of DEM and ortho image, generation of DEM by refining Rational Polynomial Coefficients (RPCs) with different number and distribution of GCPs, validating the DEM, generating the DEM, Ortho images at the best check point RMSE. 3. Data Used The field data of base and rover stations were processed in DGPS mode using Leica’s Ski-Pro. The field recordings were first transferred to the system and the points were assigned as reference and rover accordingly. Single point rocessing (SPP) was first done for the base points and For Digital Elevation Model and ortho image generation from Cartosat-1 satellite data following data sets were used. The details of the Cartosat-1 data are given in Ta- ble 1. p  V. K. SINGH ET AL. Copyright © 2010 SciRes. JGIS 88 Table 1. Details of cartosat stereo pair used for DEM generation and orthorectification. S. No. Aft Scenes Fore Scenes 1. Satellite ID = CARTOSAT-1 Satellite ID = CARTOSAT-1 2. Date of Pass = 09NOV2005 Date of Pass = 09NOV2005 3. Sensor = PAN_AFT Sensor = PAN_FORE 4. Path = 0534 Path = 0534 5. Row = 0258 Row = 0258 6. Resolution along = 2.5 m Resolution along = 2.5 m 7. Resolution across = 2.5 m Resolution across = 2.5 m 8. No. of scans = 120 00 No. of scans = 12000 9. No. of Pixels = 12 000 No. of Pixels = 12000 Figure 2. Flow chart methodology showing the detail proc- edure for DEM generation from Cartosat-1 stereo pair and orthorectification. then the rover points were processed with respect to the base. The points which could not be accurately resolved were post-processed to remove ambiguities. However, only seventeen points could be determined precisely. The fore and aft scenes of Cartosat-1 data were used to generate the Digital Elevation Model in Leica’s Photo- grammetry Suite with OrthoBase Pro. The scenes were provided with Rational Functions Coefficients (RPC). These coefficients are used to specify the geometric model, which defines the internal characteristics (i.e. internal ge- ometry of the camera or sensor while capturing the im- agery) and external parameters (i.e. original position and orientation of the cam era or sensor). The reference coordinate system is assigned a project- ion in UTM with spheroid and datum as WGS84. A block file is created in LPS and the two scenes added to the frame (Figure 3). The chipping coefficients are di- rectly taken from the RPC text files provided with Car- tosat-1 data. Pyramid layers, based on a binomial interpolation alg- orithm and a Gaussian filter, were generated to preserve image contents and save computation time. Internal ori- entation is done to define the pixel coordinate positions of the calibrated fiducial marks within each image of the block. External orientation is done to define the position and orientation of the perspective centre. If very precise values (i.e. less than a meter) of exterior orientation are imported, the aerial triangulation process can even ass- igned a horizontal c ontrol as they were l ocated besi de clif f. 5. Results and Discussions It was observed that while using only RPC information for Cartosat-1 stereo data, the error in height was in the range 124 to 286m. However, after use of GPS points and triangulation adjustment, the Cartosat DEM (Figure 4) becomes smooth and the error in height was reduced to 3 to 18m (Figure 5). It was found that accuracy of contours generated from Cartosat-1 stereo data was very accurate and close to ground height. Accuracy of DEM and ortho image was improved by triangulation iteration convergence option with less RMSE as shown in Tab le 2. The ortho image of Cartosat aft and fore image by DEM is shown in Figure 6. This Cartosat-1 stereo data can be used for height information generation at 4 m contour interval. The DEM generated from Cartosat-1 stereo data will be very much useful for topographic analysis in the field of water recourses, Landslide study, agriculture etc. 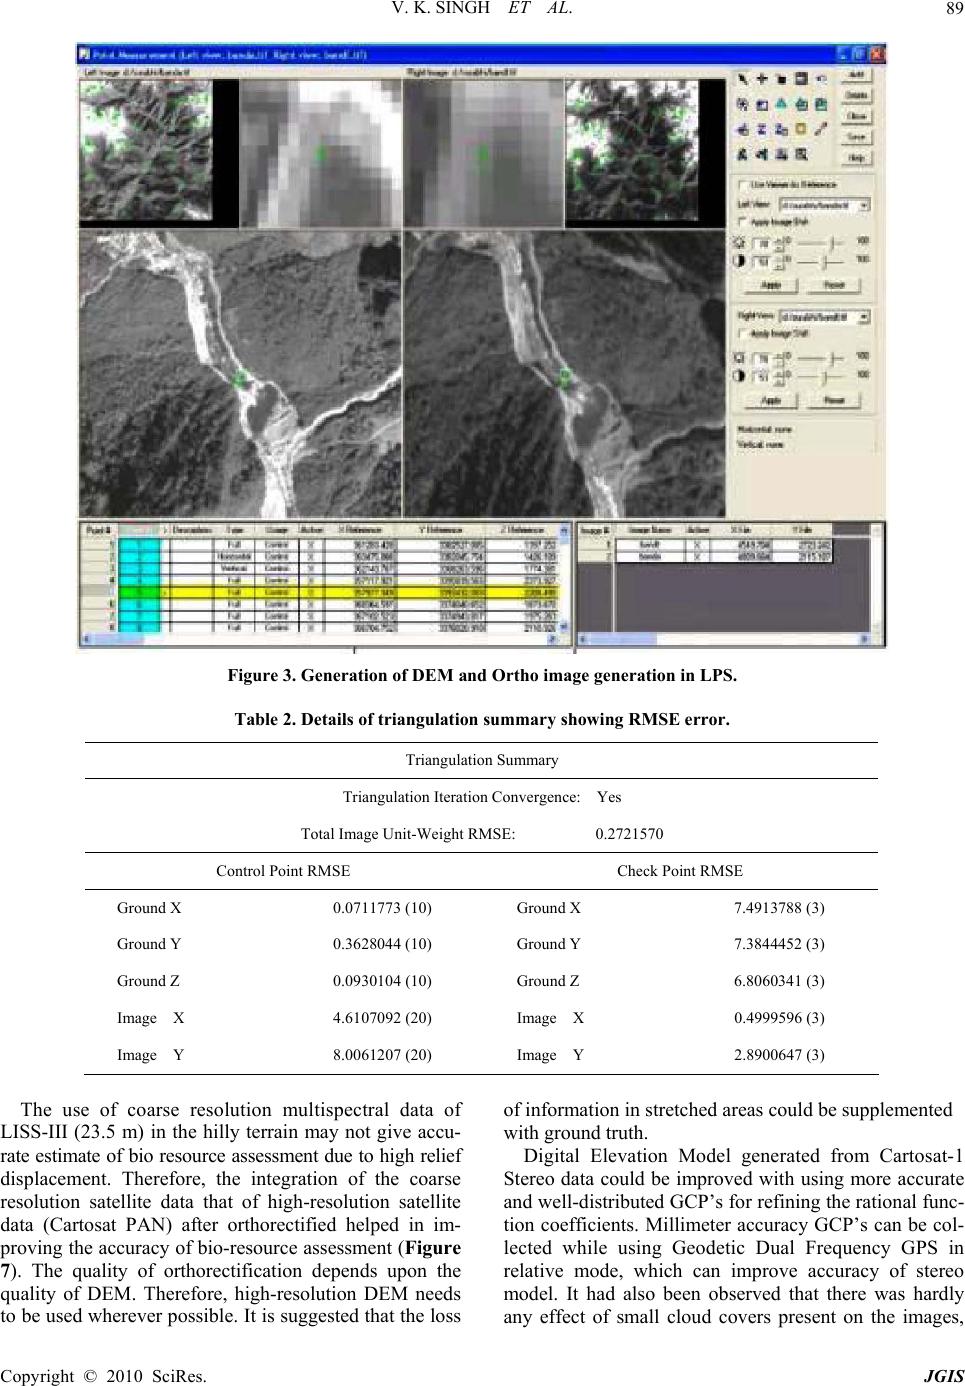 V. K. SINGH ET AL. Copyright © 2010 SciRes. JGIS 89 Figure 3. Generation of DEM and Ortho image generation in LPS. Table 2. Details of triangulation summary showing RMSE error. Triangulation Summary Triangulation Iteration Convergence: Yes Total Image Unit-Weight RMSE: 0.2721570 Control Point RMSE Check Point RMSE Ground X 0.0711773 (10) Ground X 7.4913788 (3) Ground Y 0.3628044 (10) Ground Y 7.3844452 (3) Ground Z 0.0930104 (10) Ground Z 6.8060341 (3) Image X 4.6107092 (20) Image X 0.4999596 (3) Image Y 8.0061207 (20) Image Y 2.8900647 (3) The use of coarse resolution multispectral data of LISS-III (23.5 m) in the hilly terrain may not give accu- rate estimate of bio resource assessment due to high relief displacement. Therefore, the integration of the coarse resolution satellite data that of high-resolution satellite data (Cartosat PAN) after orthorectified helped in im- proving the accuracy of bio-resource assessment (Figure 7). The quality of orthorectification depends upon the quality of DEM. Therefore, high-resolution DEM needs to be used wherever possible. It is suggested that the loss of information in stretched areas could be supplemented with gro un d truth. Digital Elevation Model generated from Cartosat-1 Stereo data could be improved with using more accurate and well-distributed GCP’s for refining the rational func- tion coefficients. Millimeter accuracy GCP’s can be col- lected while using Geodetic Dual Frequency GPS in relative mode, which can improve accuracy of stereo model. It had also been observed that there was hardly any effect of small cloud covers present on the images, 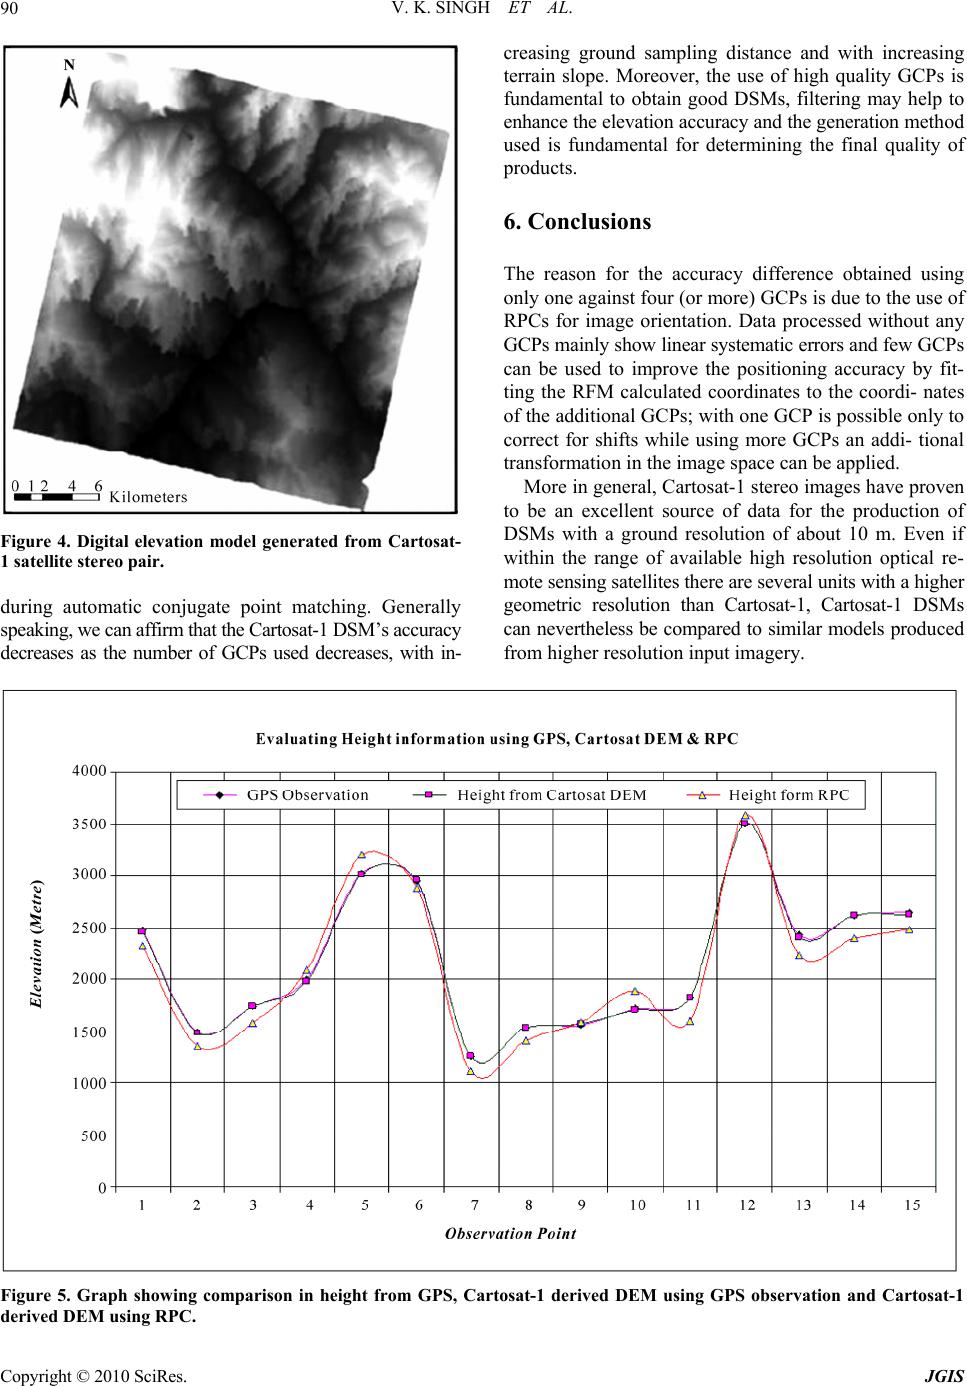 V. K. SINGH ET AL. 90 Figure 4. Digital elevation model generated from Cartosat- 1 satellite stereo pair. during automatic conjugate point matching. Generally speaking, we can a ffirm that the Cartosat -1 DSM’s accura cy decreases as the number of GCPs used decreases, with in- creasing ground sampling distance and with increasing terrain slope. Moreover, the use of high quality GCPs is fundamental to obtain good DSMs, filtering may help to enhance the elevation accuracy and the generation method used is fundamental for determining the final quality of products. 6. Conclusions The reason for the accuracy difference obtained using only one against four (or more) GCPs is due to the use of RPCs for image orientation. Data processed without any GCPs mainly sh ow linear s yste matic errors a nd few G C P s can be used to improve the positioning accuracy by fit- ting the RFM calculated coordinates to the coordi- nates of the additional GCPs; with one GCP is possible only to correct for shifts while using more GCPs an addi- tional transformation in the image space can be applied. More in general, Cartosat-1 stereo images have proven to be an excellent source of data for the production of DSMs with a ground resolution of about 10 m. Even if within the range of available high resolution optical re- mote sensing satellites there are several units with a higher geometric resolution than Cartosat-1, Cartosat-1 DSMs can nevertheless be compared to similar models produced from higher resolution input imagery. Figure 5. Graph showing comparison in height from GPS, Cartosat-1 derived DEM using GPS observation and Cartosat-1 derived DEM using RPC. Copyright © 2010 SciRes. JGIS 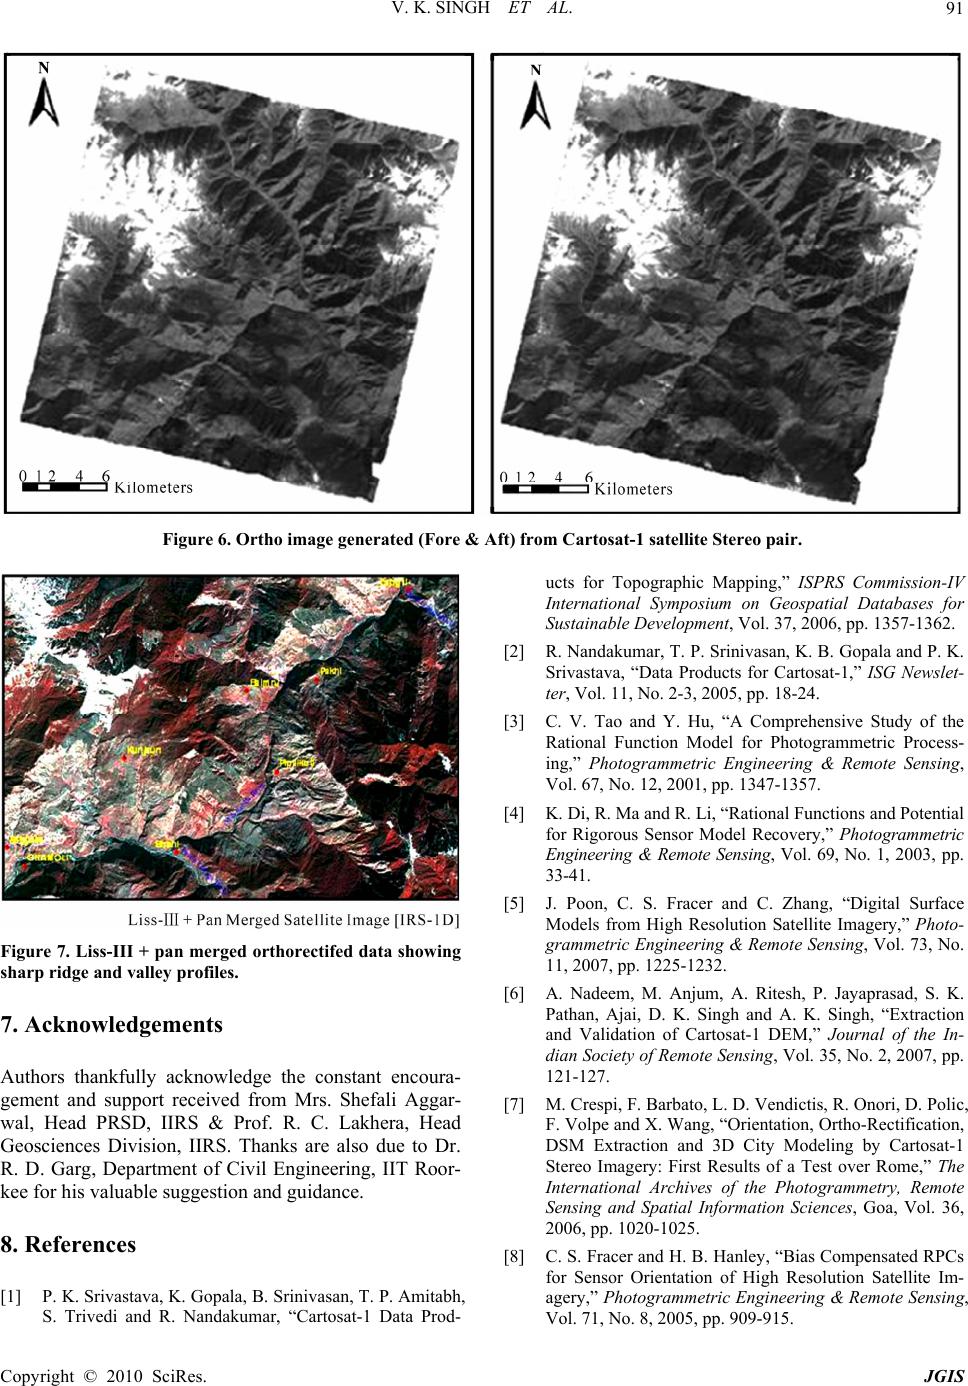 V. K. SINGH ET AL.91 Figure 6. Ortho image generated (Fore & Aft) from Cartosat-1 satellite Stereo pair. Figure 7. Liss-III + pan merged orthorectifed data showing sharp ridge and valley pr ofile s. 7. Acknowledgements Authors thankfully acknowledge the constant encoura- gement and support received from Mrs. Shefali Aggar- wal, Head PRSD, IIRS & Prof. R. C. Lakhera, Head Geosciences Division, IIRS. Thanks are also due to Dr. R. D. Garg, Department of Civil Engineering, IIT Roor- kee for hi s v a luable suggestion and guidance. 8. References [1] P. K. Srivastava, K. Gopala, B. Srinivasan, T. P. Amitabh, S. Trivedi and R. Nandakumar, “Cartosat-1 Data Prod- ucts for Topographic Mapping,” ISPRS Commission-IV International Symposium on Geospatial Databases for Sustainable Development, Vol. 37, 2006, pp. 1357-1362. [2] R. Nandakumar, T. P. Srinivasan, K. B. Gopala and P. K. Srivastava, “Data Products for Cartosat-1,” ISG Newslet- ter, Vol. 11, No. 2-3, 2005, pp. 18-24. [3] C. V. Tao and Y. Hu, “A Comprehensive Study of the Rational Function Model for Photogrammetric Process- ing,” Photogrammetric Engineering & Remote Sensing, Vol. 67, No. 12, 2001, pp. 1347-1357. [4] K. Di, R. Ma and R. Li, “Rational Functions and Potential for Rigorous Sensor Model Recovery,” Photogrammetric Engineering & Remote Sensing, Vol. 69, No. 1, 2003, pp. 33-41. [5] J. Poon, C. S. Fracer and C. Zhang, “Digital Surface Models from High Resolution Satellite Imagery,” Photo- grammetric Engineering & Remote Sensing, Vol. 73, No. 11, 2007, pp. 1225-1232. [6] A. Nadeem, M. Anjum, A. Ritesh, P. Jayaprasad, S. K. Pathan, Ajai, D. K. Singh and A. K. Singh, “Extraction and Validation of Cartosat-1 DEM,” Journal of the In- dian Society of Remote Sensing, Vol. 35, No. 2, 2007, pp. 121-127. [7] M. Crespi, F. Barbato, L. D. Vendictis, R. Onori, D. Polic, F. Volpe and X. Wang, “Orientation, Ortho-Rectification, DSM Extraction and 3D City Modeling by Cartosat-1 Stereo Imagery: First Results of a Test over Rome,” The International Archives of the Photogrammetry, Remote Sensing and Spatial Information Sciences, Goa, Vol. 36, 2006, pp. 1020-1025. [8] C. S. Fracer and H. B. Hanley, “Bias Compensated RPCs for Sensor Orientation of High Resolution Satellite Im- agery,” Photogrammetric Engineering & Remote Sensing, Vol. 71, No. 8, 2005, pp. 909-915. Copyright © 2010 SciRes. JGIS  V. K. SINGH ET AL. 92 [9] L. C. Chen, T. A. Teo and C. L. Liu, “The Geometrical Comparison of RSM and RFM for FORMOSAT-2 Satel- lite Images,” Photogrammetric Engineering & Remote Sensing, Vol. 72, No. 7, 2006, pp. 573-579. [10] R. Dabrowski, M. Kedzierski, W. Fedorowicz, R. Kac- zynski and J. Zych, “Geo-Interpretation Capabilities and Precision of an Ortho-Photomap Obtained from Cartosat Images,” The International Archives of the Photogram- metry, Remote Sensing and Spatial Information Sciences, Vol. 36, 2006, pp. 1038-1040. [11] P. Michalis and I. Dowman, “Sensor Model Evaluation and DEM Generation for Cartosat-1,” The International Archives of the Photogrammetry, Remote Sensing and Spatial Information Sciences, Goa, Vol. 36, Part IVB, 2006, pp. 1009-1013. [12] B. S. Rao, A. S. R. K. V. Murali Mohan, K. Kalyanara- man and K. Radhakrishnan, “Evaluation of Cartosat-1 Stereo Data of Rome,” The International Archives of the Photogrammetry, Remote Sensing and Spatial Informa- tion Scie nces , Goa, Vol. 36, Part 4B, 2006, pp. 1026-1029. Copyright © 2010 SciRes. JGIS |