 Vol.2, No.4, 357-367 (2010) Natural Science http://dx.doi.org/10.4236/ns.2010.24043 Copyright © 2010 SciRes. OPEN ACCESS Effect of Ba2+ in BNT ceramics on dielectric and conductivity properties Konapala Sambasiva Rao, Kuan China Varada Rajulu, Bollepalli Tilak, Anem Swathi Centre for Piezoelectric Transducer Materials, Department of Physics, Andhra University, Visakhapatnam, India; sambasivaraokonapala@yahoo.co.in; konapala@sify.com Received 11 December 2009; revised 13 January 2010; accepted 19 February 2010. ABSTRACT The polycrystalline (Na0.5Bi0.5)1-xBaxTiO 3 (x = 0.026, 0.055 & 0.065) (BNBT) ceramics have been synthesized by conventional solid state sinter- ing technique. The tolerance (t) factor of the BNBT composition have been estimated and found to be 0.988, 0.990 and 0.991 for x = 0.026, 0.055 and 0.065 respectively, revealing system is stable perovskite type structure. The com- pound has a rhombohedral-tetragonal Morphtropic Phase Boun- dary (MPB) at x = 0.065. XRD re- sults indicated the crystalline structure of the investigated materials are of single phase with rhombohedral structure and the average parti- cle size of the calcined powder is found to lie between 45 nm - 60 nm. The effect of Ba2+ on dielectric and conductivity properties in Bis- muth Sodium Titanate (BNT) has been studied. The variation of dielectric constant with fre- quency (45 Hz-5 MHz) and temperature (35℃-590℃) has been performed. The value of Tm and Td are found to decrease with increase of concentration of Barium in BNT. The value of tan in the studied materials is found to be the order of 10-2 indicating low loss materials. The evaluated Curie constant in the composi- tion is found to be the order of 105 revealing the materials belong to oxygen octahedra ferro- electrics. The theoretical dielectric data of the studied composition have been fitted by us- ing Jonscher’s dielectric dispersion relation: ))( )( )( 2 )(sin( 1)(' Tn o r Ta Tn . The pre-factor a(T), which indicates the strength of the po- larizability showed a maximum at transition temperature (Tm). The exponent n(T) which gives a large extent of interaction between the charge carriers and polarization is found to be minimum in the vicinity of Tm. The A.C. and d.c conductivity activation energies have been eva- luated; the difference in activation energies could be due to the grain boundary effect. The activation enthalpy energies, have been esti- mated and found to be Hm = 0.37 eV, 0.26 eV and 0.25 eV for BNBT-26, BNBT-55 and BNBT-65 re- spectively. Keywords: MPB; Dielectric; Perovskite; Conductivity; Tolerance Factor 1. INTRODUCTION Recently, according to the stern restriction of environ- mental pollution such as waste electrical and electronic equipment (WEEE) and restriction of hazardous sub- stance (RoSH), development of lead free piezoelectric ceramics capable of replacing lead-based ceramics is strongly required. The development of lead-free piezo- electric materials has been required. Lead free piezo- electric ceramics have recently attracted great attention for the consideration of environmental protection. Tung- sten-Bronze (TB) type, Bismuth Layer-Structured (BLS) type and perovskite type ferroelectrics are known for lead-free piezoelectric ceramics. Now a days Na0.5Bi0.5TiO3 (NBT) is considered to be a parent component for lead-free ferroelectric and piezo- electric material [1,2]. But Bi ion is highly volatile at high temperature above 1130℃ during sintering and making this material difficult to pole due to its high conductivity [3]. The solution to this problem has been found by many researchers, who were able to modify BNT crystal by the substitution of other A and B-site cations, such as in (Bi0.5Na0.5)(1-1.5x)LaxTiO3; (BNLT) [4], BNT-KNbO3(KN) [5], and BNT-Ba(Ti,Zr)O3 [6] solid- solution ceramic system. The piezoelectric properties of these ceramics were significantly improved. The piezoelectric property of Na1/2Bi1/2TiO3-BaTiO3 (BNBT) system with perovskite structure was studied by B.J. Chu et al. [7]. A simple aqueous route was devel- oped for the preparation of (1-x)Na1/2 Bi1/2 TiO3xBaTiO3 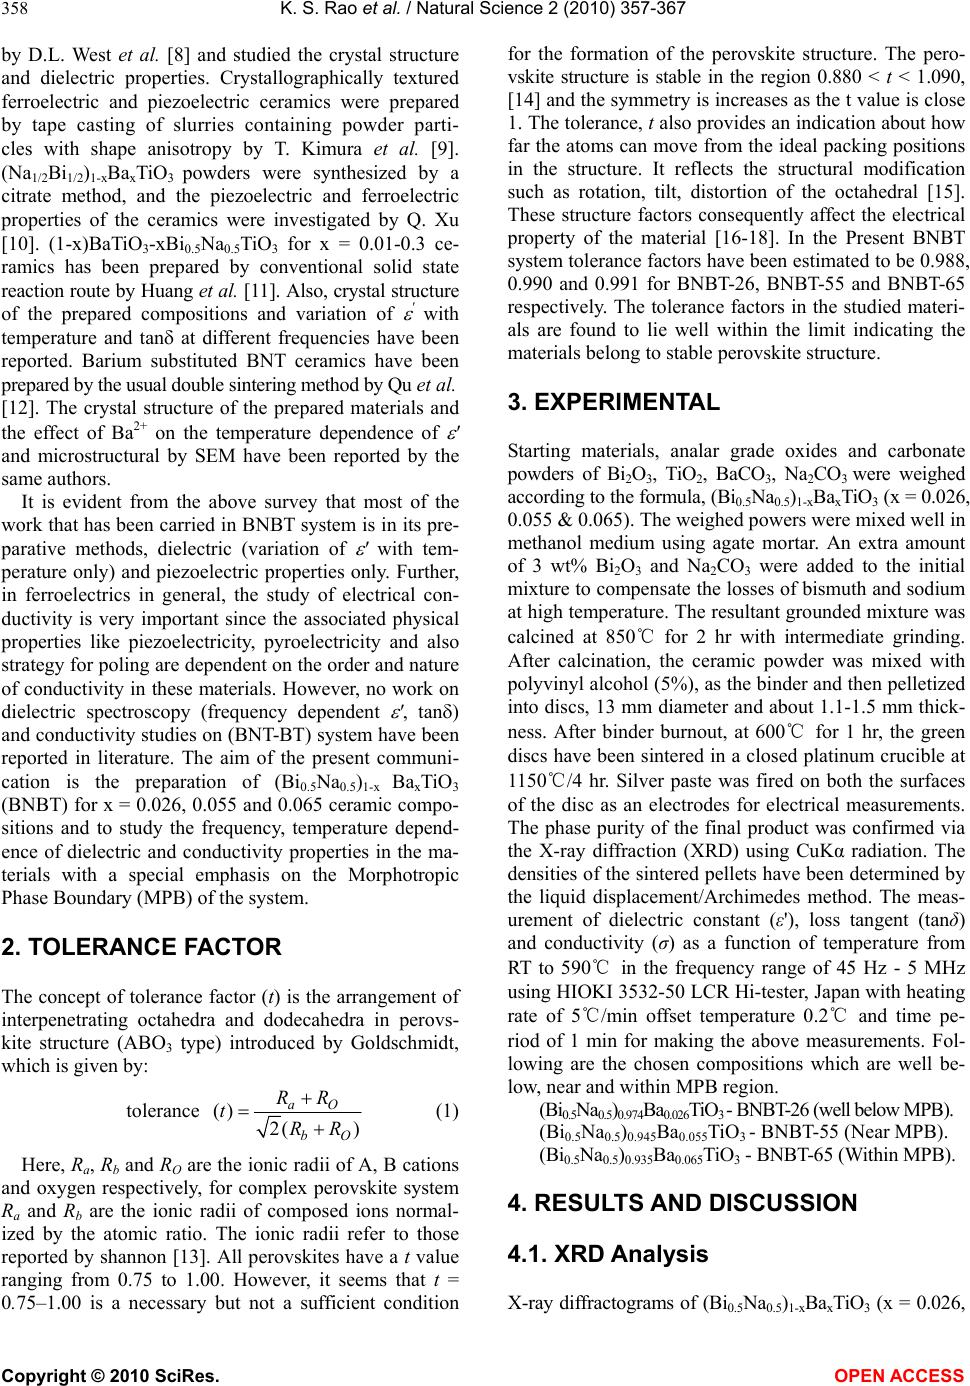 K. S. Rao et al. / Natural Science 2 (2010) 357-367 Copyright © 2010 SciRes. OPEN ACCESS 358 by D.L. West et al. [8] and studied the crystal structure and dielectric properties. Crystallographically textured ferroelectric and piezoelectric ceramics were prepared by tape casting of slurries containing powder parti- cles with shape anisotropy by T. Kimura et al. [9]. (Na1/2Bi1/2)1-xBaxTiO3 powders were synthesized by a citrate method, and the piezoelectric and ferroelectric properties of the ceramics were investigated by Q. Xu [10]. (1-x)BaTiO3-xBi0.5Na0.5TiO3 for x = 0.01-0.3 ce- ramics has been prepared by conventional solid state reaction route by Huang et al. [11]. Also, crystal structure of the prepared compositions and variation of ' with temperature and tan at different frequencies have been reported. Barium substituted BNT ceramics have been prepared by the usual double sintering method by Qu et al. [12]. The crystal structure of the prepared materials and the effect of Ba2+ on the temperature dependence of ' and microstructural by SEM have been reported by the same authors. It is evident from the above survey that most of the work that has been carried in BNBT system is in its pre- parative methods, dielectric (variation of ' with tem- perature only) and piezoelectric properties only. Further, in ferroelectrics in general, the study of electrical con- ductivity is very important since the associated physical properties like piezoelectricity, pyroelectricity and also strategy for poling are dependent on the order and nature of conductivity in these materials. However, no work on dielectric spectroscopy (frequency dependent ', tan) and conductivity studies on (BNT-BT) system have been reported in literature. The aim of the present communi- cation is the preparation of (Bi0.5Na0.5)1-x BaxTiO3 (BNBT) for x = 0.026, 0.055 and 0.065 ceramic compo- sitions and to study the frequency, temperature depend- ence of dielectric and conductivity properties in the ma- terials with a special emphasis on the Morphotropic Phase Boundary (MPB) of the system. 2. TOLERANCE FACTOR The concept of tolerance factor (t) is the arrangement of interpenetrating octahedra and dodecahedra in perovs- kite structure (ABO3 type) introduced by Goldschmidt, which is given by: tolerance () 2( ) aO bO RR tRR (1) Here, Ra, Rb and RO are the ionic radii of A, B cations and oxygen respectively, for complex perovskite system Ra and Rb are the ionic radii of composed ions normal- ized by the atomic ratio. The ionic radii refer to those reported by shannon [13]. All perovskites have a t value ranging from 0.75 to 1.00. However, it seems that t = 0.75–1.00 is a necessary but not a sufficient condition for the formation of the perovskite structure. The pero- vskite structure is stable in the region 0.880 < t < 1.090, [14] and the symmetry is increases as the t value is close 1. The tolerance, t also provides an indication about how far the atoms can move from the ideal packing positions in the structure. It reflects the structural modification such as rotation, tilt, distortion of the octahedral [15]. These structure factors consequently affect the electrical property of the material [16-18]. In the Present BNBT system tolerance factors have been estimated to be 0.988, 0.990 and 0.991 for BNBT-26, BNBT-55 and BNBT-65 respectively. The tolerance factors in the studied materi- als are found to lie well within the limit indicating the materials belong to stable perovskite structure. 3. EXPERIMENTAL Starting materials, analar grade oxides and carbonate powders of Bi2O3, TiO2, BaCO3, Na2CO3 were weighed according to the formula, (Bi0.5Na0.5)1-xBaxTiO3 (x = 0.026, 0.055 & 0.065). The weighed powers were mixed well in methanol medium using agate mortar. An extra amount of 3 wt% Bi2O3 and Na2CO3 were added to the initial mixture to compensate the losses of bismuth and sodium at high temperature. The resultant grounded mixture was calcined at 850℃ for 2 hr with intermediate grinding. After calcination, the ceramic powder was mixed with polyvinyl alcohol (5%), as the binder and then pelletized into discs, 13 mm diameter and about 1.1-1.5 mm thick- ness. After binder burnout, at 600℃ for 1 hr, the green discs have been sintered in a closed platinum crucible at 1150℃/4 hr. Silver paste was fired on both the surfaces of the disc as an electrodes for electrical measurements. The phase purity of the final product was confirmed via the X-ray diffraction (XRD) using CuKα radiation. The densities of the sintered pellets have been determined by the liquid displacement/Archimedes method. The meas- urement of dielectric constant (ε'), loss tangent (tanδ) and conductivity (σ) as a function of temperature from RT to 590℃ in the frequency range of 45 Hz - 5 MHz using HIOKI 3532-50 LCR Hi-tester, Japan with heating rate of 5℃/min offset temperature 0.2℃ and time pe- riod of 1 min for making the above measurements. Fol- lowing are the chosen compositions which are well be- low, near and within MPB region. (Bi0.5Na0.5)0.974Ba0.026TiO3 - BNBT-26 (well below MPB). (Bi0.5Na0.5)0.945Ba0.055Ti O3 - BNBT-55 (Near MPB). (Bi0.5Na0.5)0.935Ba0.065TiO3 - BNBT-65 (Within MPB). 4. RESULTS AND DISCUSSION 4.1. XRD Analysis X-ray diffractograms of (Bi0.5Na0.5)1-xBaxTiO3 (x = 0.026, 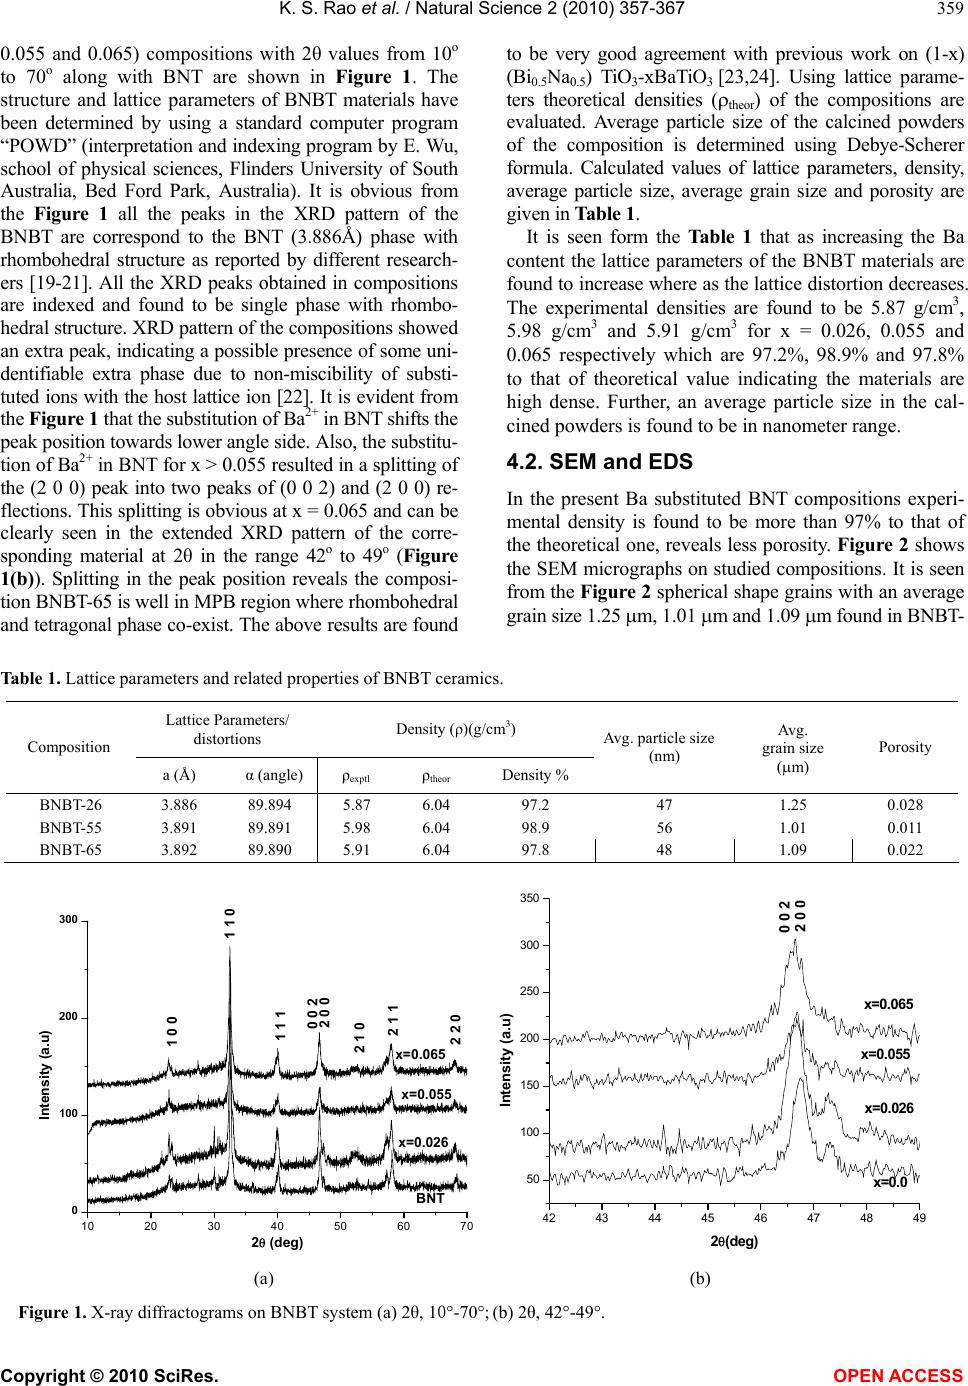 K. S. Rao et al. / Natural Science 2 (2010) 357-367 Copyright © 2010 SciRes. OPEN ACCESS 359 0.055 and 0.065) compositions with 2θ values from 10o to 70o along with BNT are shown in Figure 1. The structure and lattice parameters of BNBT materials have been determined by using a standard computer program “POWD” (interpretation and indexing program by E. Wu, school of physical sciences, Flinders University of South Australia, Bed Ford Park, Australia). It is obvious from the Figure 1 all the peaks in the XRD pattern of the BNBT are correspond to the BNT (3.886Å) phase with rhombohedral structure as reported by different research- ers [19-21]. All the XRD peaks obtained in compositions are indexed and found to be single phase with rhombo- hedral structure. XRD pattern of the compositions showed an extra peak, indicating a possible presence of some uni- dentifiable extra phase due to non-miscibility of substi- tuted ions with the host lattice ion [22]. It is evident from the Figure 1 that the substitution of Ba2+ in BNT shifts the peak position towards lower angle side. Also, the substitu- tion of Ba2+ in BNT for x > 0.055 resulted in a splitting of the (2 0 0) peak into two peaks of (0 0 2) and (2 0 0) re- flections. This splitting is obvious at x = 0.065 and can be clearly seen in the extended XRD pattern of the corre- sponding material at 2θ in the range 42o to 49o (Figure 1(b)). Splitting in the peak position reveals the composi- tion BNBT-65 is well in MPB region where rhombohedral and tetragonal phase co-exist. The above results are found to be very good agreement with previous work on (1-x) (Bi0.5Na0.5) TiO3-xBaTiO3 [23,24]. Using lattice parame- ters theoretical densities (theor) of the compositions are evaluated. Average particle size of the calcined powders of the composition is determined using Debye-Scherer formula. Calculated values of lattice parameters, density, average particle size, average grain size and porosity are given in Table 1. It is seen form the Table 1 that as increasing the Ba content the lattice parameters of the BNBT materials are found to increase where as the lattice distortion decreases. The experimental densities are found to be 5.87 g/cm3, 5.98 g/cm3 and 5.91 g/cm3 for x = 0.026, 0.055 and 0.065 respectively which are 97.2%, 98.9% and 97.8% to that of theoretical value indicating the materials are high dense. Further, an average particle size in the cal- cined powders is found to be in nanometer range. 4.2. SEM and EDS In the present Ba substituted BNT compositions experi- mental density is found to be more than 97% to that of the theoretical one, reveals less porosity. Figure 2 shows the SEM micrographs on studied compositions. It is seen from the Figure 2 spherical shape grains with an average grain size 1.25 m, 1.01 m and 1.09 m found in BNBT- Table 1. Lattice parameters and related properties of BNBT ceramics. Lattice Parameters/ distortions Density (ρ)(g/cm3) Composition a (Å) α (angle) ρexptl ρtheor Density % Avg. particle size (nm) Avg. grain size (m) Porosity BNBT-26 3.886 89.894 5.87 6.04 97.2 47 1.25 0.028 BNBT-55 3.891 89.891 5.98 6.04 98.9 56 1.01 0.011 BNBT-65 3.892 89.890 5.91 6.04 97.8 48 1.09 0.022 10 20 30 40 50 6070 0 100 200 300 0 0 2 2 2 0 2 1 1 2 1 0 2 0 0 1 1 1 1 1 0 x=0.065 x=0.055 Intensity (a.u) 2(deg) BNT x=0.026 1 0 0 42 43 44 45 46 47 48 49 50 100 150 200 250 300 350 x=0.0 65 x=0. 055 Intensity (a.u) 2(deg) 2 0 0 0 0 2 x=0. 026 x=0.0 (a) (b) Figure 1. X-ray diffractograms on BNBT system (a) 2θ, 10°-70°; (b) 2θ, 42°-49°.  K. S. Rao et al. / Natural Science 2 (2010) 357-367 Copyright © 2010 SciRes. OPEN ACCESS 360 (a) (b) (c) Figure 2. SEM micrographs of (a) BNBT-26; (b) BNBT-55; (c) BNBT-65. (a) (b) (c) Figure 3. Energy dispersive X-ray spectrums. (a) BNBT-26; (b) BNBT-55; (c) BNBT-65. Table 2. Dielectric properties of BNBT ceramics. Dielectric constant(ε') (1 kHz) Td (℃) Tm (℃)Tan δ (1 kHz) Composition RT Tm RTTm Conductivity (σ)(1 kHz) Curie Constant (X105) oK n(T) log A(T) BNBT-26 541 1625 180 318 0.0590.05 1.38x10⁻⁸(s/cm)1.35 0.285 -9.4 BNBT-55 818 1891 140 313 0.040.02 2.02x10⁻⁸(s/cm)1.51 0.184 -3.5 BNBT-65 701 1233 100 305 0.060.02 2.46x10⁻⁸(s/cm)1.0 0.19 -3.6 26, BNBT-55 and BNBT-65 respectively. Energy Dispersive X-ray Spectroscopy (EDS) is a chemical microanalysis technique used in conjunction with SEM and is not a surface science technique. The EDS technique detects X-rays emitted from the sample during bombardment by an electron beam to characterize the elemental composition of the analyzed volume. Fig- ure 3 shows the EDS of Ba substituted BNT compositions. The spectrum (Figure 3) shows the elements present in the prepared compositions are Na, Bi, Ba, Ti and O only. 4.3. Dielectric The temperature dependence of dielectric constant ε' and dielectric loss tanδ of Ba substituted BNT system at 1 kHz are shown in Figure 4. It is seen from Figure 4(a) that two dielectric peaks have been observed in each composition. The observed two dielectric peaks can be attributed to the factors caused by the phase transitions from ferroelectric to an- ti-ferroelectric, which is called depolarization tempera- 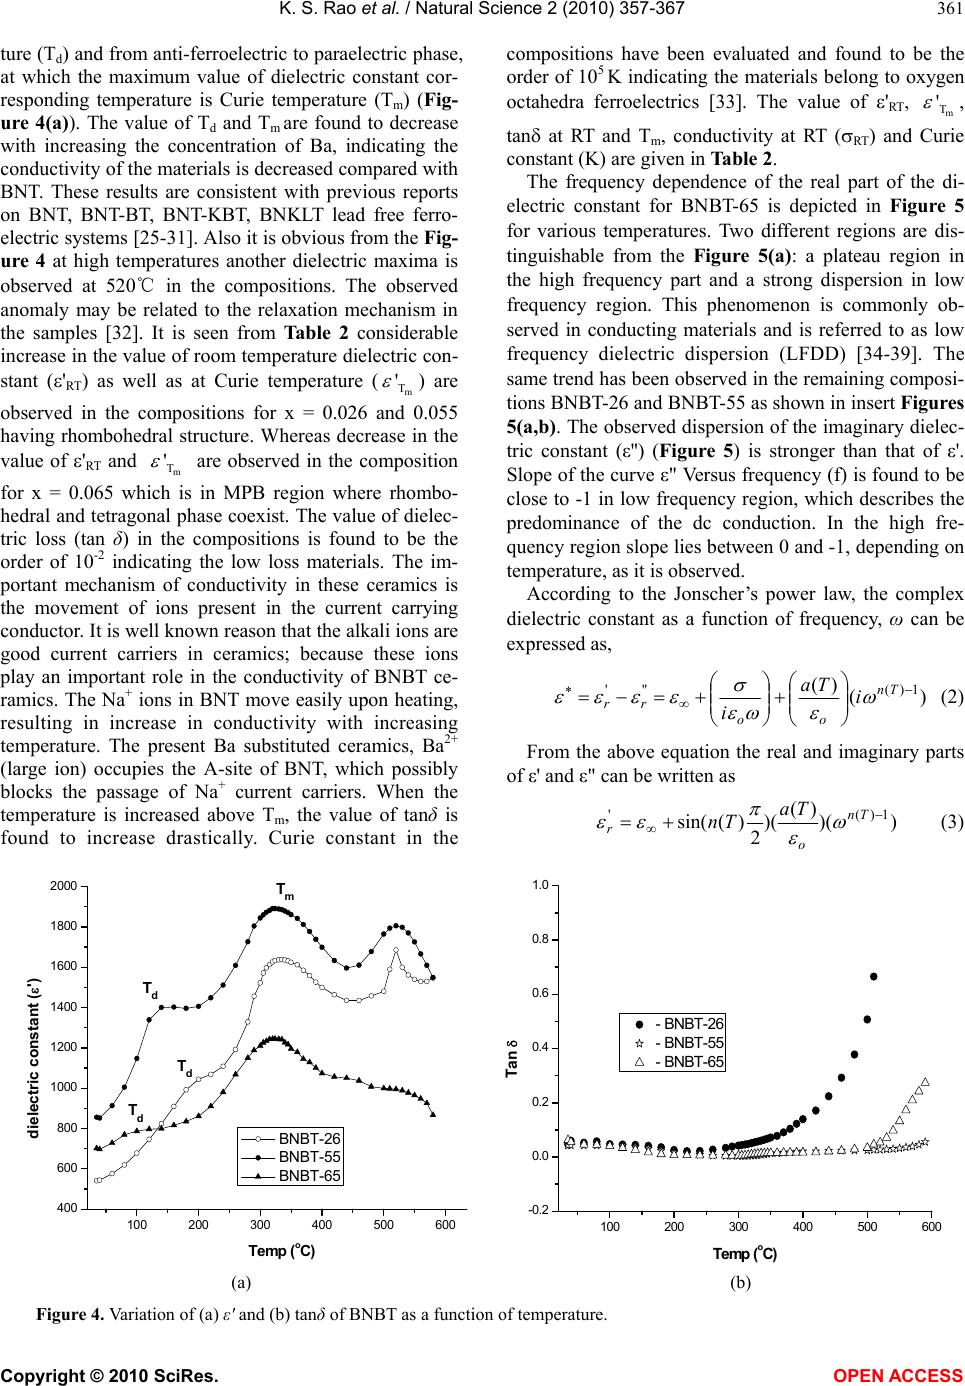 K. S. Rao et al. / Natural Science 2 (2010) 357-367 Copyright © 2010 SciRes. OPEN ACCESS 361 ture (Td) and from anti-ferroelectric to paraelectric phase, at which the maximum value of dielectric constant cor- responding temperature is Curie temperature (Tm) (Fig- ure 4(a)). The value of Td and Tm are found to decrease with increasing the concentration of Ba, indicating the conductivity of the materials is decreased compared with BNT. These results are consistent with previous reports on BNT, BNT-BT, BNT-KBT, BNKLT lead free ferro- electric systems [25-31]. Also it is obvious from the Fig- ure 4 at high temperatures another dielectric maxima is observed at 520℃ in the compositions. The observed anomaly may be related to the relaxation mechanism in the samples [32]. It is seen from Table 2 considerable increase in the value of room temperature dielectric con- stant ('RT) as well as at Curie temperature (m T ' ) are observed in the compositions for x = 0.026 and 0.055 having rhombohedral structure. Whereas decrease in the value of 'RT and m T ' are observed in the composition for x = 0.065 which is in MPB region where rhombo- hedral and tetragonal phase coexist. The value of dielec- tric loss (tan δ) in the compositions is found to be the order of 10-2 indicating the low loss materials. The im- portant mechanism of conductivity in these ceramics is the movement of ions present in the current carrying conductor. It is well known reason that the alkali ions are good current carriers in ceramics; because these ions play an important role in the conductivity of BNBT ce- ramics. The Na+ ions in BNT move easily upon heating, resulting in increase in conductivity with increasing temperature. The present Ba substituted ceramics, Ba2+ (large ion) occupies the A-site of BNT, which possibly blocks the passage of Na+ current carriers. When the temperature is increased above Tm, the value of tanδ is found to increase drastically. Curie constant in the compositions have been evaluated and found to be the order of 105 K indicating the materials belong to oxygen octahedra ferroelectrics [33]. The value of 'RT, m T ' , tan at RT and T m, conductivity at RT (RT) and Curie constant (K) are given in Table 2. The frequency dependence of the real part of the di- electric constant for BNBT-65 is depicted in Figure 5 for various temperatures. Two different regions are dis- tinguishable from the Figure 5(a): a plateau region in the high frequency part and a strong dispersion in low frequency region. This phenomenon is commonly ob- served in conducting materials and is referred to as low frequency dielectric dispersion (LFDD) [34-39]. The same trend has been observed in the remaining composi- tions BNBT-26 and BNBT-55 as shown in insert Figures 5(a,b). The observed dispersion of the imaginary dielec- tric constant (ε'') (Figure 5) is stronger than that of ε'. Slope of the curve ε" Versus frequency (f) is found to be close to -1 in low frequency region, which describes the predominance of the dc conduction. In the high fre- quency region slope lies between 0 and -1, depending on temperature, as it is observed. According to the Jonscher’s power law, the complex dielectric constant as a function of frequency, ω can be expressed as, )( )( 1)(''' Tn oo rr i Ta i (2) From the above equation the real and imaginary parts of ε' and ε" can be written as ))( )( )( 2 )(sin( 1)(' Tn o r Ta Tn (3) 100 200 300 400 500 600 400 600 800 1000 1200 1400 1600 1800 2000 Tm Td Td Td dielectric constant (') Temp (oC) BNBT-26 BNBT-55 BNBT-65 100 200 300 400 500 600 -0.2 0.0 0.2 0.4 0.6 0.8 1.0 Tan Temp (oC) - BNBT-26 - BNBT-55 - BNBT-65 (a) (b) Figure 4. Variation of (a) ε' and (b) tanδ of BNBT as a function of temperature. 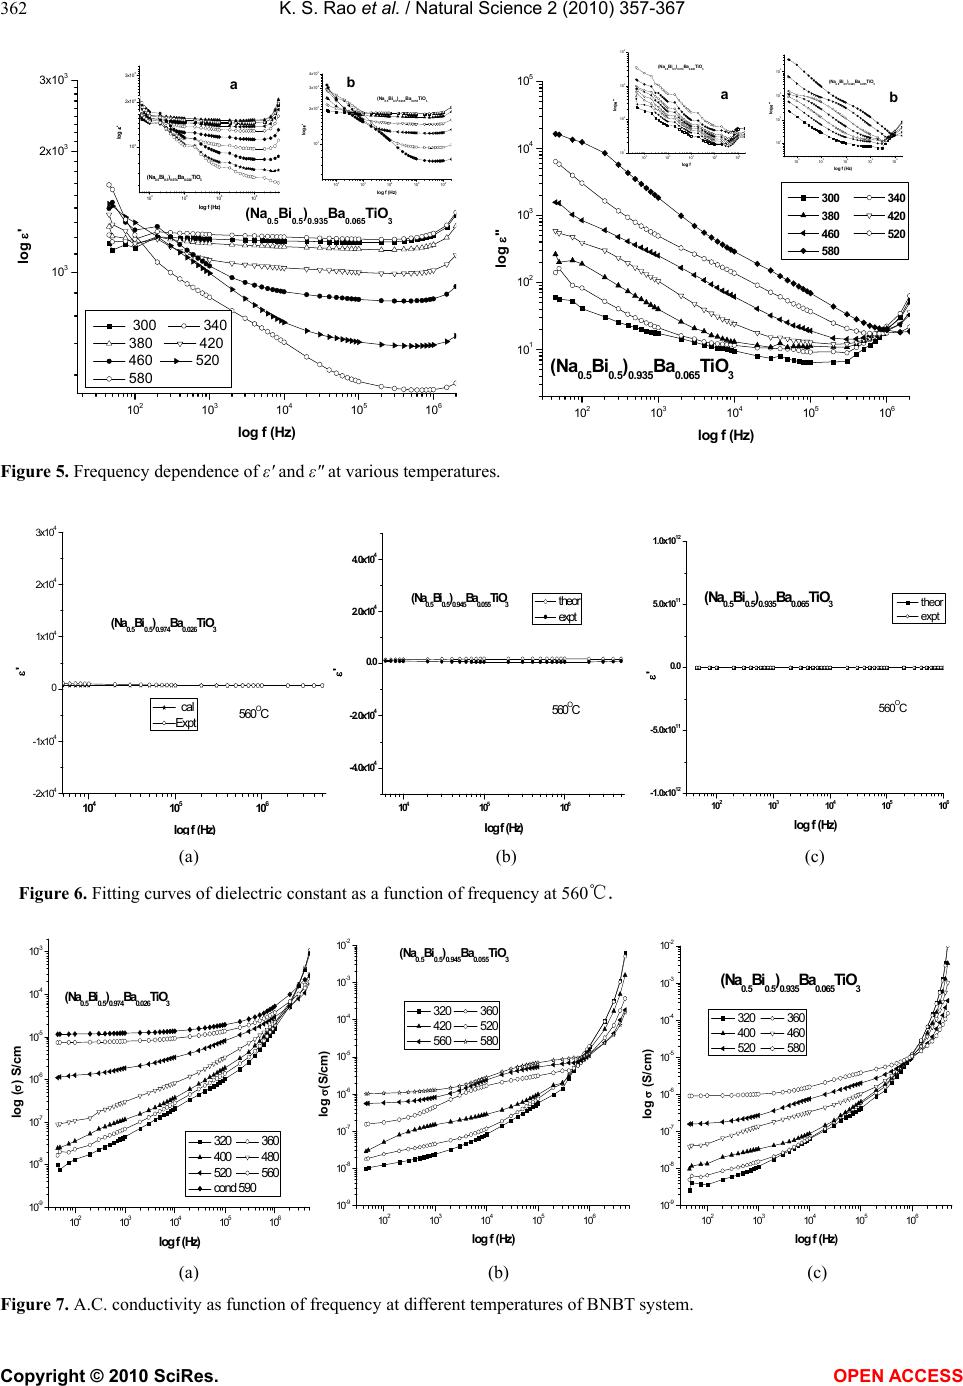 K. S. Rao et al. / Natural Science 2 (2010) 357-367 Copyright © 2010 SciRes. OPEN ACCESS 362 102103104105106 101 102 103 104 105 102103104105106 101 102 103 104 (Na0.5Bi0.5)0.945Ba0.055Ti O3 log " log f (Hz) 102103104105106 101 102 103 104 (Na0.5Bi0.5)0.974Ba0.026TiO3 log '' log f (Na0.5Bi0.5)0.935Ba0.065 TiO3 log " log f (Hz) 300 340 380 420 460 520 580 ab Figure 5. Frequency dependence of ε' and ε" at various temperatures. 104105106 -2x10⁴ -1x10⁴ 0 1x10⁴ 2x10⁴ 3x10⁴ (Na0.5Bi0.5)0.974Ba 0.026TiO3 ' lo f Hz cal Expt 560O C 104105106 -4.0x10⁴ -2.0x10⁴ 0.0 2.0x10 4 4.0x10 4 560O C (Na0.5Bi0. 5)0.945Ba0. 055TiO3 lo f Hz theor expt 102103104105106 -1.0x10¹² -5.0x10¹¹ 0.0 5. 0x1011 1. 0x1012 560O C (Na0.5Bi0.5)0.935 Ba0 .065TiO3 ' log f (Hz) theor expt (a) (b) (c) Figure 6. Fitting curves of dielectric constant as a function of frequency at 560℃. 102103104105106 10-9 10-8 10-7 10-6 10-5 10-4 10-3 (Na0.5Bi0.5)0.974Ba0. 026TiO3 log () S/cm log f (Hz) 320 360 400 480 520 560 cond 590 102103104105106 10-9 10-8 10-7 10-6 10-5 10-4 10-3 10-2 (Na0.5Bi0. 5)0.945Ba0.055TiO3 log (S/cm) log f (Hz) 320 360 420 520 560 580 102103104105106 10-9 10-8 10-7 10-6 10-5 10-4 10-3 10-2 (Na0.5Bi0.5)0. 935Ba0. 065TiO3 log (S/cm) log f (Hz) 320 360 400 460 520 580 (a) (b) (c) Figure 7. A.C. conductivity as function of frequency at different temperatures of BNBT system. 102103104105106 103 2x10³ 3x10³ 102103104105106 103 2x10³ 3x10³ 4x10³ (Na0.5Bi0.5)0.945Ba0.055TiO3 log ' log f (Hz) (Na0.5Bi 0. 5)0.935Ba0.065TiO3 103104105106 103 2x10³ 3x10³ (Na0.5Bi0.5)0.974Ba 0.026TiO3 log ' log f (Hz) log ' log f (Hz) 300 340 380 420 460 520 580 ab 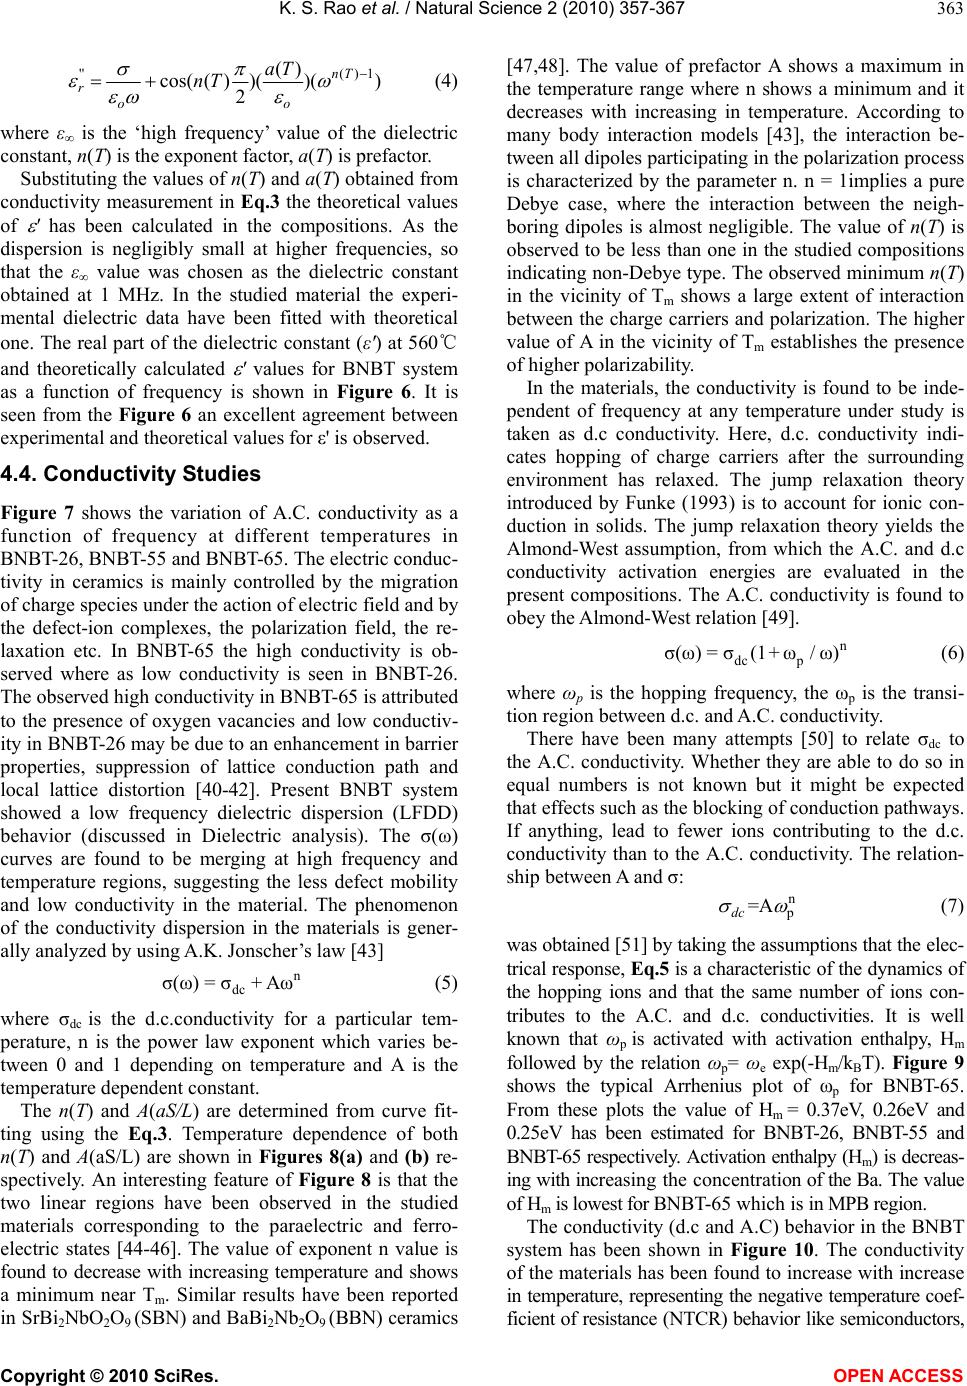 K. S. Rao et al. / Natural Science 2 (2010) 357-367 Copyright © 2010 SciRes. OPEN ACCESS 363 ))( )( )( 2 )(cos(1)('' Tn oo r Ta Tn (4) where ε∞ is the ‘high frequency’ value of the dielectric constant, n(T) is the exponent factor, a(T) is prefactor. Substituting the values of n(T) and a(T) obtained from conductivity measurement in Eq.3 the theoretical values of ' has been calculated in the compositions. As the dispersion is negligibly small at higher frequencies, so that the ε∞ value was chosen as the dielectric constant obtained at 1 MHz. In the studied material the experi- mental dielectric data have been fitted with theoretical one. The real part of the dielectric constant (ε') at 560℃ and theoretically calculated ' values for BNBT system as a function of frequency is shown in Figure 6. It is seen from the Figure 6 an excellent agreement between experimental and theoretical values for ε' is observed. 4.4. Conductivity Studies Figure 7 shows the variation of A.C. conductivity as a function of frequency at different temperatures in BNBT-26, BNBT-55 and BNBT-65. The electric conduc- tivity in ceramics is mainly controlled by the migration of charge species under the action of electric field and by the defect-ion complexes, the polarization field, the re- laxation etc. In BNBT-65 the high conductivity is ob- served where as low conductivity is seen in BNBT-26. The observed high conductivity in BNBT-65 is attributed to the presence of oxygen vacancies and low conductiv- ity in BNBT-26 may be due to an enhancement in barrier properties, suppression of lattice conduction path and local lattice distortion [40-42]. Present BNBT system showed a low frequency dielectric dispersion (LFDD) behavior (discussed in Dielectric analysis). The σ(ω) curves are found to be merging at high frequency and temperature regions, suggesting the less defect mobility and low conductivity in the material. The phenomenon of the conductivity dispersion in the materials is gener- ally analyzed by using A.K. Jonscher’s law [43] n dc σ(ω)=σ+Aω (5) where σdc is the d.c.conductivity for a particular tem- perature, n is the power law exponent which varies be- tween 0 and 1 depending on temperature and A is the temperature dependent constant. The n(T) and A(aS/L) are determined from curve fit- ting using the Eq.3. Temperature dependence of both n(T) and A(aS/L) are shown in Figures 8(a) and (b) re- spectively. An interesting feature of Figure 8 is that the two linear regions have been observed in the studied materials corresponding to the paraelectric and ferro- electric states [44-46]. The value of exponent n value is found to decrease with increasing temperature and shows a minimum near Tm. Similar results have been reported in SrBi2NbO2O9 (SBN) and BaBi2Nb2O9 (BBN) ceramics [47,48]. The value of prefactor A shows a maximum in the temperature range where n shows a minimum and it decreases with increasing in temperature. According to many body interaction models [43], the interaction be- tween all dipoles participating in the polarization process is characterized by the parameter n. n = 1implies a pure Debye case, where the interaction between the neigh- boring dipoles is almost negligible. The value of n(T) is observed to be less than one in the studied compositions indicating non-Debye type. The observed minimum n(T) in the vicinity of Tm shows a large extent of interaction between the charge carriers and polarization. The higher value of A in the vicinity of Tm establishes the presence of higher polarizability. In the materials, the conductivity is found to be inde- pendent of frequency at any temperature under study is taken as d.c conductivity. Here, d.c. conductivity indi- cates hopping of charge carriers after the surrounding environment has relaxed. The jump relaxation theory introduced by Funke (1993) is to account for ionic con- duction in solids. The jump relaxation theory yields the Almond-West assumption, from which the A.C. and d.c conductivity activation energies are evaluated in the present compositions. The A.C. conductivity is found to obey the Almond-West relation [49]. n dc p σ(ω)=σ(1+ ω/ω) (6) where ωp is the hopping frequency, the ωp is the transi- tion region between d.c. and A.C. conductivity. There have been many attempts [50] to relate σdc to the A.C. conductivity. Whether they are able to do so in equal numbers is not known but it might be expected that effects such as the blocking of conduction pathways. If anything, lead to fewer ions contributing to the d.c. conductivity than to the A.C. conductivity. The relation- ship between A and σ: n =A dc (7) was obtained [51] by taking the assumptions that the elec- trical response, Eq.5 is a characteristic of the dynamics of the hopping ions and that the same number of ions con- tributes to the A.C. and d.c. conductivities. It is well known that ωp is activated with activation enthalpy, Hm followed by the relation ωp= ωe exp(-Hm/kBT). Figure 9 shows the typical Arrhenius plot of ωp for BNBT-65. From these plots the value of Hm = 0.37eV, 0.26eV and 0.25eV has been estimated for BNBT-26, BNBT-55 and BNBT-65 respectively. Activation enthalpy (Hm) is decreas- ing with increasing the concentration of the Ba. The value of Hm is lowest for BNBT-65 which is in MPB region. The conductivity (d.c and A.C) behavior in the BNBT system has been shown in Figure 10. The conductivity of the materials has been found to increase with increase in temperature, representing the negative temperature coef- ficient of resistance (NTCR) behavior like semiconductors,  K. S. Rao et al. / Natural Science 2 (2010) 357-367 Copyright © 2010 SciRes. OPEN ACCESS 364 250 300 350 400 450 500 -11.0 -10.5 -10.0 -9.5 -9.0 -8.5 -8.0 (Na 0.5 Bi 0.5 ) 0.974 Ba 0.026 TiO 3 log A Temperature ( o C) T C 250 300 350 400 450 500 0.30 0.35 0.40 0.45 (Na0.5Bi 0.5)0.974Ba0.026TiO3 n-parameter Temperature (oC) TC 250 300 350 400 450500 0.1 0.2 0.3 0.4 0.5 0.6 0.7 0.8 0.9 (Na 0.5 Bi 0.5 ) 0.945 Ba 0.055 TiO 3 n Temp ( o C) 250 300350400450 500 -22 -20 -18 -16 -14 -12 -10 -8 -6 -4 -2 (Na0.5Bi0.5)0.945Ba0.055Ti O3 log A Temp(oC) 200 250 300 350 400 450 500 550 600 0.2 0.3 0.4 0.5 0.6 (Na 0.5 Bi 0.5 ) 0.935 Ba 0.065 TiO 3 n-parameter Temp ( o C) T C 200 250 300 350 400 450 500 550 600 -16 -14 -12 -10 -8 -6 -4 -2 (Na0.5Bi0.5)0.935Ba0. 065TiO3 TC log A Temp(oC) (a) (b) Figure 8. Temperature depence of (a) n(T) and (b) A(T) parameters of BNBT system. 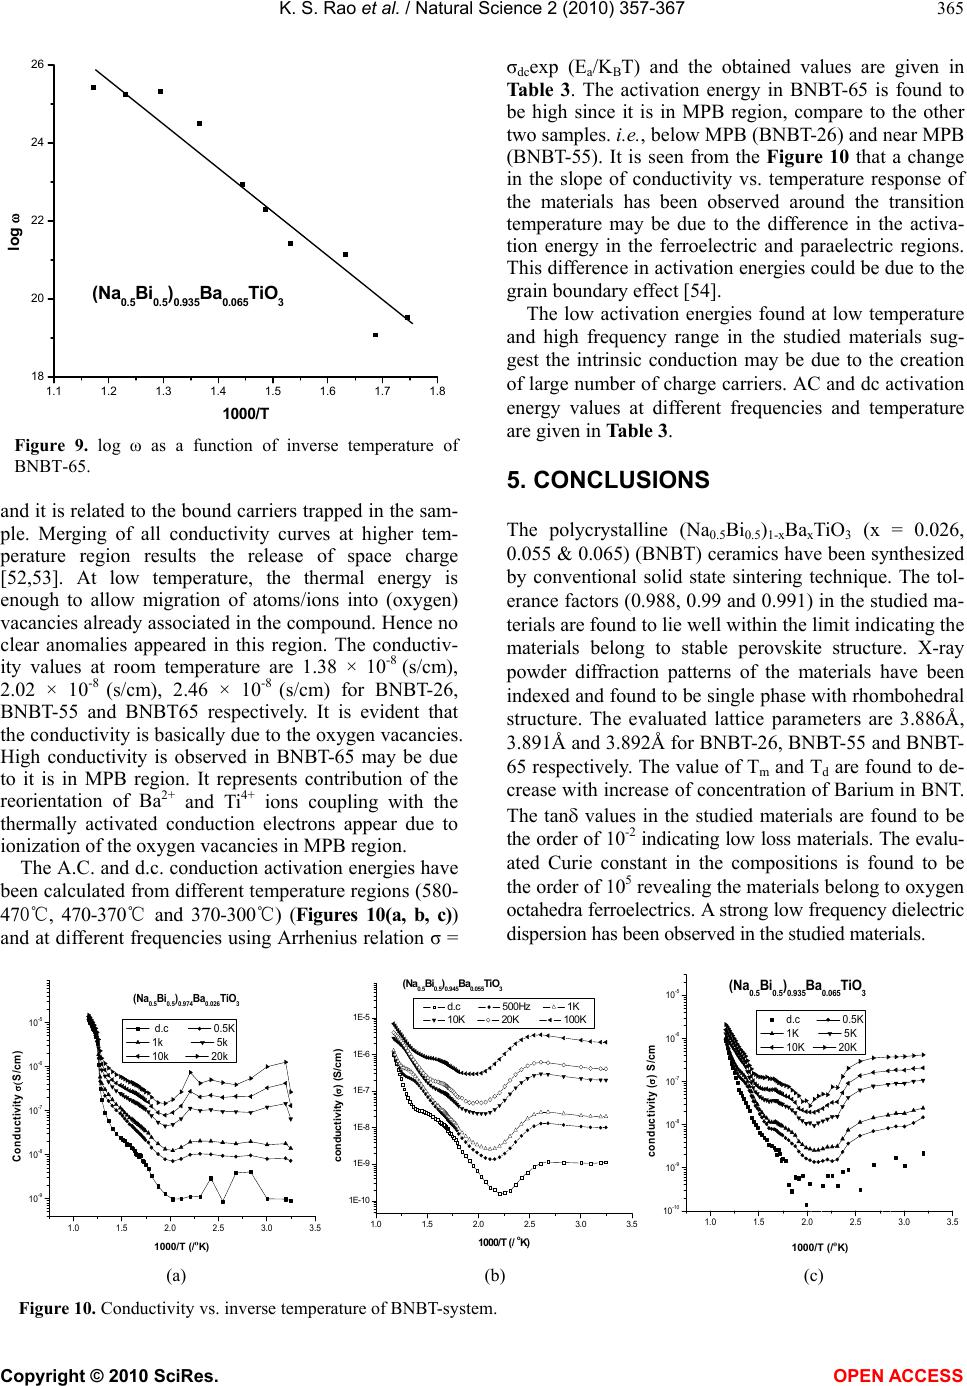 K. S. Rao et al. / Natural Science 2 (2010) 357-367 Copyright © 2010 SciRes. OPEN ACCESS 365 1.1 1.2 1.3 1.4 1.5 1.6 1.7 1.8 18 20 22 24 26 (Na0.5Bi0.5)0.935Ba0. 065Ti O3 log 1000/T Figure 9. log ω as a function of inverse temperature of BNBT-65. and it is related to the bound carriers trapped in the sam- ple. Merging of all conductivity curves at higher tem- perature region results the release of space charge [52,53]. At low temperature, the thermal energy is enough to allow migration of atoms/ions into (oxygen) vacancies already associated in the compound. Hence no clear anomalies appeared in this region. The conductiv- ity values at room temperature are 1.38 × 10⁻⁸ (s/cm), 2.02 × 10⁻⁸ (s/cm), 2.46 × 10⁻⁸ (s/cm) for BNBT-26, BNBT-55 and BNBT65 respectively. It is evident that the conductivity is basically due to the oxygen vacancies. High conductivity is observed in BNBT-65 may be due to it is in MPB region. It represents contribution of the reorientation of Ba2+ and Ti4+ ions coupling with the thermally activated conduction electrons appear due to ionization of the oxygen vacancies in MPB region. The A.C. and d.c. conduction activation energies have been calculated from different temperature regions (580- 470℃, 470-370℃ and 370-300℃) (Figures 10(a, b, c)) and at different frequencies using Arrhenius relation σ = σdcexp (Ea/KBT) and the obtained values are given in Table 3. The activation energy in BNBT-65 is found to be high since it is in MPB region, compare to the other two samples. i.e., below MPB (BNBT-26) and near MPB (BNBT-55). It is seen from the Figure 10 that a change in the slope of conductivity vs. temperature response of the materials has been observed around the transition temperature may be due to the difference in the activa- tion energy in the ferroelectric and paraelectric regions. This difference in activation energies could be due to the grain boundary effect [54]. The low activation energies found at low temperature and high frequency range in the studied materials sug- gest the intrinsic conduction may be due to the creation of large number of charge carriers. AC and dc activation energy values at different frequencies and temperature are given in Table 3. 5. CONCLUSIONS The polycrystalline (Na0.5Bi0.5)1-xBaxTiO3 (x = 0.026, 0.055 & 0.065) (BNBT) ceramics have been synthesized by conventional solid state sintering technique. The tol- erance factors (0.988, 0.99 and 0.991) in the studied ma- terials are found to lie well within the limit indicating the materials belong to stable perovskite structure. X-ray powder diffraction patterns of the materials have been indexed and found to be single phase with rhombohedral structure. The evaluated lattice parameters are 3.886Å, 3.891Å and 3.892Å for BNBT-26, BNBT-55 and BNBT- 65 respectively. The value of Tm and Td are found to de- crease with increase of concentration of Barium in BNT. The tan values in the studied materials are found to be the order of 10-2 indicating low loss materials. The evalu- ated Curie constant in the compositions is found to be the order of 105 revealing the materials belong to oxygen octahedra ferroelectrics. A strong low frequency dielectric dispersion has been observed in the studied materials. 1.01.52.02.53.03.5 10 -9 10 -8 10 -7 10 -6 10 -5 (Na 0.5 Bi 0.5 ) 0.974 Ba 0.026 TiO 3 Conductivity S/cm) 1000/T ( o K) d.c 0.5K 1k 5k 10k 20k 1000/T (/ º K) 1.0 1.5 2.0 2.5 3.0 3.5 1E-10 1E-9 1E-8 1E-7 1E-6 1E-5 (Na0.5Bi0.5)0.945Ba0.055Ti O3 conductivity () (S/cm) 1000/T (/ oK) d.c 500Hz 1K 10K 20K 100K 1.0 1.52.0 2.5 3.03.5 10 -10 10 -9 10 -8 10 -7 10 -6 10 -5 (Na 0.5 Bi 0.5 ) 0.935 Ba 0.065 TiO 3 conductivity ( ) S/cm 1000/T ( o K) d.c 0.5K 1K 5K 10K 20K 1000/T (/ º K) (a) (b) (c) Figure 10. Conductivity vs. inverse temperature of BNBT-system. 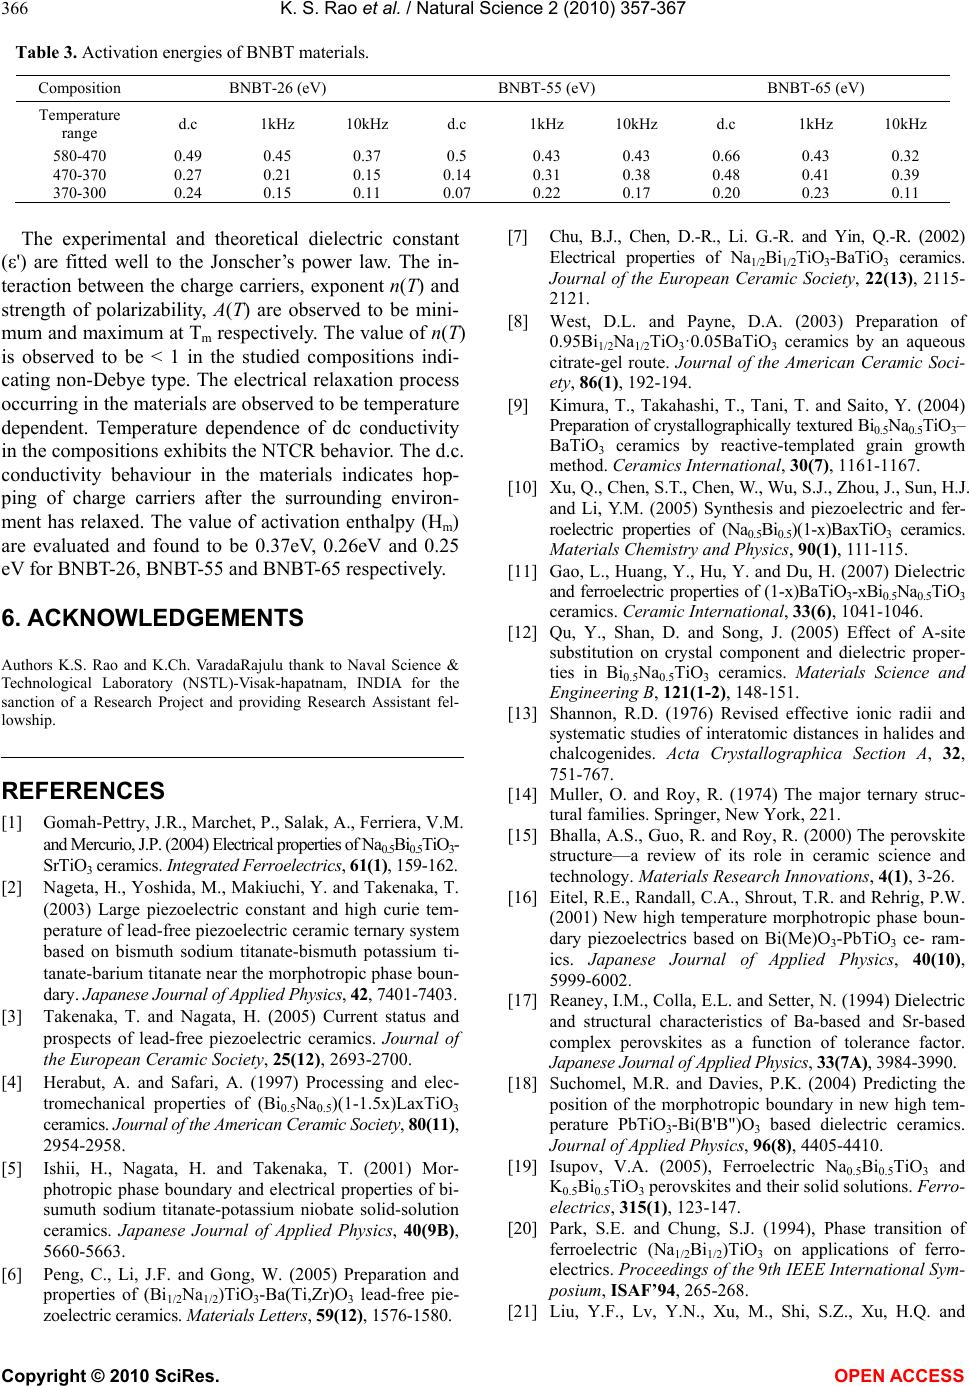 K. S. Rao et al. / Natural Science 2 (2010) 357-367 Copyright © 2010 SciRes. OPEN ACCESS 366 Table 3. Activation energies of BNBT materials. Composition BNBT-26 (eV) BNBT-55 (eV) BNBT-65 (eV) Temperature range d.c 1kHz 10kHz d.c 1kHz 10kHz d.c 1kHz 10kHz 580-470 0.49 0.45 0.37 0.5 0.43 0.43 0.66 0.43 0.32 470-370 0.27 0.21 0.15 0.14 0.31 0.38 0.48 0.41 0.39 370-300 0.24 0.15 0.11 0.07 0.22 0.17 0.20 0.23 0.11 The experimental and theoretical dielectric constant (ε') are fitted well to the Jonscher’s power law. The in- teraction between the charge carriers, exponent n(T) and strength of polarizability, A(T) are observed to be mini- mum and maximum at Tm respectively. The value of n(T) is observed to be < 1 in the studied compositions indi- cating non-Debye type. The electrical relaxation process occurring in the materials are observed to be temperature dependent. Temperature dependence of dc conductivity in the compositions exhibits the NTCR behavior. The d.c. conductivity behaviour in the materials indicates hop- ping of charge carriers after the surrounding environ- ment has relaxed. The value of activation enthalpy (Hm) are evaluated and found to be 0.37eV, 0.26eV and 0.25 eV for BNBT-26, BNBT-55 and BNBT-65 respectively. 6. ACKNOWLEDGEMENTS Authors K.S. Rao and K.Ch. VaradaRajulu thank to Naval Science & Technological Laboratory (NSTL)-Visak-hapatnam, INDIA for the sanction of a Research Project and providing Research Assistant fel- lowship. REFERENCES [1] Gomah-Pettry, J.R., Marchet, P., Salak, A., Ferriera, V.M. and Mercurio, J.P. (2004) Electrical properties of Na0.5Bi0.5Ti O3- SrTiO3 ceramics. Integrated Ferroelectrics, 61(1), 159-162. [2] Nageta, H., Yoshida, M., Makiuchi, Y. and Takenaka, T. (2003) Large piezoelectric constant and high curie tem- perature of lead-free piezoelectric ceramic ternary system based on bismuth sodium titanate-bismuth potassium ti- tanate-barium titanate near the morphotropic phase boun- dary. Japanese Journal of Applied Physics, 42, 7401-7403. [3] Takenaka, T. and Nagata, H. (2005) Current status and prospects of lead-free piezoelectric ceramics. Journal of the European Ceramic Society, 25(12), 2693-2700. [4] Herabut, A. and Safari, A. (1997) Processing and elec- tromechanical properties of (Bi0.5Na0.5)(1-1.5x)LaxTiO3 ceramics. Journal of the American Ceramic Society, 80(11), 2954-2958. [5] Ishii, H., Nagata, H. and Takenaka, T. (2001) Mor- photropic phase boundary and electrical properties of bi- sumuth sodium titanate-potassium niobate solid-solution ceramics. Japanese Journal of Applied Physics, 40(9B), 5660-5663. [6] Peng, C., Li, J.F. and Gong, W. (2005) Preparation and properties of (Bi1/2Na1/2)TiO3-Ba(Ti,Zr)O3 lead-free pie- zoelectric ceramics. Materials Letters, 59(12), 1576-1580. [7] Chu, B.J., Chen, D.-R., Li. G.-R. and Yin, Q.-R. (2002) Electrical properties of Na1/2 Bi1/ 2Ti O3-BaTiO3 ceramics. Journal of the European Ceramic Society, 22(13), 2115- 2121. [8] West, D.L. and Payne, D.A. (2003) Preparation of 0.95Bi1/2Na1/2TiO3·0.05BaTiO3 ceramics by an aqueous citrate-gel route. Journal of the American Ceramic Soci- ety, 86(1), 192-194. [9] Kimura, T., Takahashi, T., Tani, T. and Saito, Y. (2004) Preparation of crystallographically textured Bi0.5Na0.5TiO3– BaTiO3 ceramics by reactive-templated grain growth method. Ceramics International, 30(7), 1161-1167. [10] Xu, Q., Chen, S.T., Chen, W., Wu, S.J., Zhou, J., Sun, H.J. and Li, Y.M. (2005) Synthesis and piezoelectric and fer- roelectric properties of (Na0.5Bi0.5)(1-x)BaxTiO3 ceramics. Materials Chemistry and Physics, 90(1), 111-115. [11] Gao, L., Huang, Y., Hu, Y. and Du, H. (2007) Dielectric and ferroelectric properties of (1-x)BaTiO3-xBi0.5Na0.5TiO3 ceramics. Ceramic International, 33(6), 1041-1046. [12] Qu, Y., Shan, D. and Song, J. (2005) Effect of A-site substitution on crystal component and dielectric proper- ties in Bi0.5Na0.5TiO3 ceramics. Materials Science and Engineering B, 121(1-2), 148-151. [13] Shannon, R.D. (1976) Revised effective ionic radii and systematic studies of interatomic distances in halides and chalcogenides. Acta Crystallographica Section A, 32, 751-767. [14] Muller, O. and Roy, R. (1974) The major ternary struc- tural families. Springer, New York, 221. [15] Bhalla, A.S., Guo, R. and Roy, R. (2000) The perovskite structure—a review of its role in ceramic science and technology. Materials Research Innovations, 4(1), 3-26. [16] Eitel, R.E., Randall, C.A., Shrout, T.R. and Rehrig, P.W. (2001) New high temperature morphotropic phase boun- dary piezoelectrics based on Bi(Me)O3-PbTiO3 ce- ram- ics. Japanese Journal of Applied Physics, 40(10), 5999-6002. [17] Reaney, I.M., Colla, E.L. and Setter, N. (1994) Dielectric and structural characteristics of Ba-based and Sr-based complex perovskites as a function of tolerance factor. Japanese Journal of Applied Physics, 33(7A), 3984-3990. [18] Suchomel, M.R. and Davies, P.K. (2004) Predicting the position of the morphotropic boundary in new high tem- perature PbTiO3-Bi(B'B")O3 based dielectric ceramics. Journal of Applied Physics, 96(8), 4405-4410. [19] Isupov, V.A. (2005), Ferroelectric Na0.5Bi0.5TiO3 and K0.5Bi0.5TiO3 perovskites and their solid solutions. Ferro- electrics, 315(1), 123-147. [20] Park, S.E. and Chung, S.J. (1994), Phase transition of ferroelectric (Na1/2Bi1/2)TiO3 on applications of ferro- electrics. Proceedings of the 9th IEEE International Sym- posium, ISAF’94, 265-268. [21] Liu, Y.F., Lv, Y.N., Xu, M., Shi, S.Z., Xu, H.Q. and  K. S. Rao et al. / Natural Science 2 (2010) 357-367 Copyright © 2010 SciRes. OPEN ACCESS 367 Yang, X.D. (2007) Structure and electric properties of (1-x)(Bi1/2Na1/2) TiO3-xBaTiO3 systems. Journal of Wuhan University of Technology - Materials Science Edition, 22(2), 315-319. [22] Mahboob, S., Prasad, G. and Kumar, G.S. (2007) Im- pedance spectroscopy and conductivity studies on B site modified (Na0.5Bi0.5)(Nd-xTi(1-2x)Nbx)O-3 ceramics. Journal of Material Science, 42, 10275-10283. [23] Takenaka, T. (1999) Piezoelectric properties of some lead-free ferroelectric ceramics. Ferroelectric s, 230, 87- 98. [24] Liu, Y.F., et al. (2007) Journal of Wuhan University of Technology - Materials Science Edition. [25] Takenaka, T. (1989) Piezoelectric properties of some lead-free ferroelectric ceramics. Ferroelectrics, 230, 389. [26] Yoshii, K., Nagata, H. and Takenaka, T. (2006) Electri- cal properties and depolarization temperature of (Bi1/2Na1/2)TiO3–(Bi1/2K1/2)TiO3 lead-free piezoelectric ceramics. Japanese Journal of Applied Physics, 45, 4493. [27] Takenaka, T., Okuda, T. and Takegahara, K. (1997) Lead-free piezoelectric ceramics based on (Bi1/2Na1/2) TiO3-NaNbO3. Ferroelectrics, 196, 175. [28] Li, H.D., Feng, C.D. and Yao, W.L. (2005) Some effects of different additives on dielectric and piezoelectric properties of (Bi0.5Na0.5)TiO3-BaTiO3 morphotropic phase boundary composition. Materials Letters, 58, 1194- 1198. [29] Nagata, H. and Takenaka, T. (2001) Additive effects on electrical properties of (Bi1/2Na1/2)TiO3 ferroelectric ce- ramics. Journal of European Ceramic Society, 21, 1299. [30] Wei, Z., Heping, Z. and Yongke, Y., et al. (2007) Dielec- tric and piezoelectric properties of Y2O3 doped (Bi0.5Na0.5)0.94Ba0.06TiO3 lead-free piezoelectric ceram- ics. Key Engineering Materials, 105, 336-338. [31] Lin, D., Xiao, D., Zhu, J. and Yu, P. (2006) Piezoelectric and ferroelectric properties of [Bi0.5Na1-x-yKxLiy0.5]TiO3 lead-free piezoelectric ceramics. Applied Physics Letters, 88. [32] Tu, C.S., Siny, I.G. and Schimidt, V.H. (1994) Dielectric, NMR and X-Ray diffraction study of Cs1-x(NH4)xH2PO4. Physical Review B, 49, 11550. [33] Chowdury, P.R. and Deshpande, S.B. (1984) Indian Journal of Pure & Applied Physics, 22, 708. [34] Jonscher, A.K. and Dube, D.C. (1978) Low frequency dispersion in tri-glycyne sulphate. Ferroelectrics, 17, 533-536. [35] Jonscher, A.K. (1989) Interpretation of non-ideal dielec- tric plots. Journal of Material Science, 24, 372. [36] Garcia-Martin, S., Veiga, M.L., Pico, C., Santamaria, J., Gonzalez-Diaz, G. and Sanchez-Quesada, F. (1990) Di- electric response and ionic conductivity of Cs(NbTe)O6. Materials Research Bulletin, 25, 1393. [37] Jonscher, A.K., Deori, K.L., Reau, J.M. and Moali, J. (1979) The dielectric response of KxAlxTi8-xO16 and KxMgx/2Ti8-x/2O16. Journal of Materials Science, 14, 1308- 1320. [38] Garcia-Martin, S., Veiga, M.L., Pico, C., Santamaria, J., Gonzalez-Diaz, G. and Sanchez-Quesada, F. (1990) Barrier effects on ionic conductivity and dielectric re- sponse of Ti(NbTe)O6. Solid State Ionics, 44, 131. [39] Varez, A., Alario-Franco, M.A., Santamaria, J., Gon- zalez-Diaz, G. and Sanchez-Quesada, F. (1990) Ionic conductivity of lithium inserted Ba2YCu3O7-y. Solid State Communications, 76(7), 917-920. [40] Kumar, A., Singh, B.P., Choudary, R.N.P. and Thakur, A.K. (2005) A.C. impedance analysis of the effect of dopant concentration on electrical properties of calcium modified BaSnO3. Journal of Alloys and Compounds, 394(1-2), 292-302. [41] Scott, B.A., Geiss, E.A., Olson, B.L., Burns, G., Smith, A.W. and O’Kane, D.F. (1970) The tungsten bronze field in the system K2O|Li2O|Nb2O5. Materials Research Bul- letin, 5(1), 47-56. [42] Kroger, F.A. and Vink, H.J. (1956) Relations between the concentrations of imperfections in crystalline solids. Solid State Physics, 3, 307. [43] Jonscherm A.K. (1983) Dielectric relaxation in solids. Chelesa Dielectric Press, London. [44] Henn, F.E.G., Giuntini, J.C., Zanchetta, J.V., Granier, W. and Taha, A. (1990) Frequency dependent protonic con- duction in N2H5Sn3F7 glass and RbHSeO4 single crystal. Solid State Ionics, 42(1-2), 29-36. [45] Giuntini, J.C., Deroide, B., Belougne, P. and Zanchetta, J.V. (1987) Numerical approach of the correlated barrier hopping model. Solid State Communications, 62, 739. [46] Bensimon, Y., Giuntini, J.C., Belougne, P., Deroide, B. and Zanchetta, J.V. (1988) Solid State Communications, 68,189. [47] Venkataraman, B.H. and Varma, K.B.R. (2004) Fre- quency-dependent dielectric characteristics of ferroe- lectric SrBi2Nb2O9 ceramics. Solid State Ionics, 167, 197-202. [48] Krthik, C. and Varma, K.B.R. (2006) Dielectric and AC conductivity behavior of BaBi2Nb209 ceramics. Journal of Physics and Chemistry of Solids, 67(12), 2437-2441. [49] Almond, D.P. and West, A.R. (1983) Mobile ion con- centrations in solid electrolytes from an analysis of a.c. conductivity. Solid State Ionics, 22, 277. [50] Hill, R.M. and Jonscher, A.K. (1979) Journal of Non- Crystalline Solids, 32, 53. [51] Almond, D.P., West, A.R. and Grant, R.J. (1982) Tem- perature dependence of the a.c. conductivity of Naβ- alumina. Solid State Communications, 44(8), 1277-1280. [52] Sundarkannan, S., Kakimoto, K. and Ohsato, H. (2003) Journal of Applied Physics, 9, 5182. [53] Lu, Z., Bonnet, J.P., Ravez, J. and Hagenmullar, P. (1992) Correlation between low frequency dielectric dispersion (LFDD) and impedance relaxation in ferroelectric ce- ramic Pb2KNb4TaO15. Solid State Ionics, 57(3-4), 235- 244. [54] Thakur, O.P. and Prakash, C. (2003) Dielectric properties of samarium substituted barium strontium titanate. Phase Transformation, 76(6), 567-574.
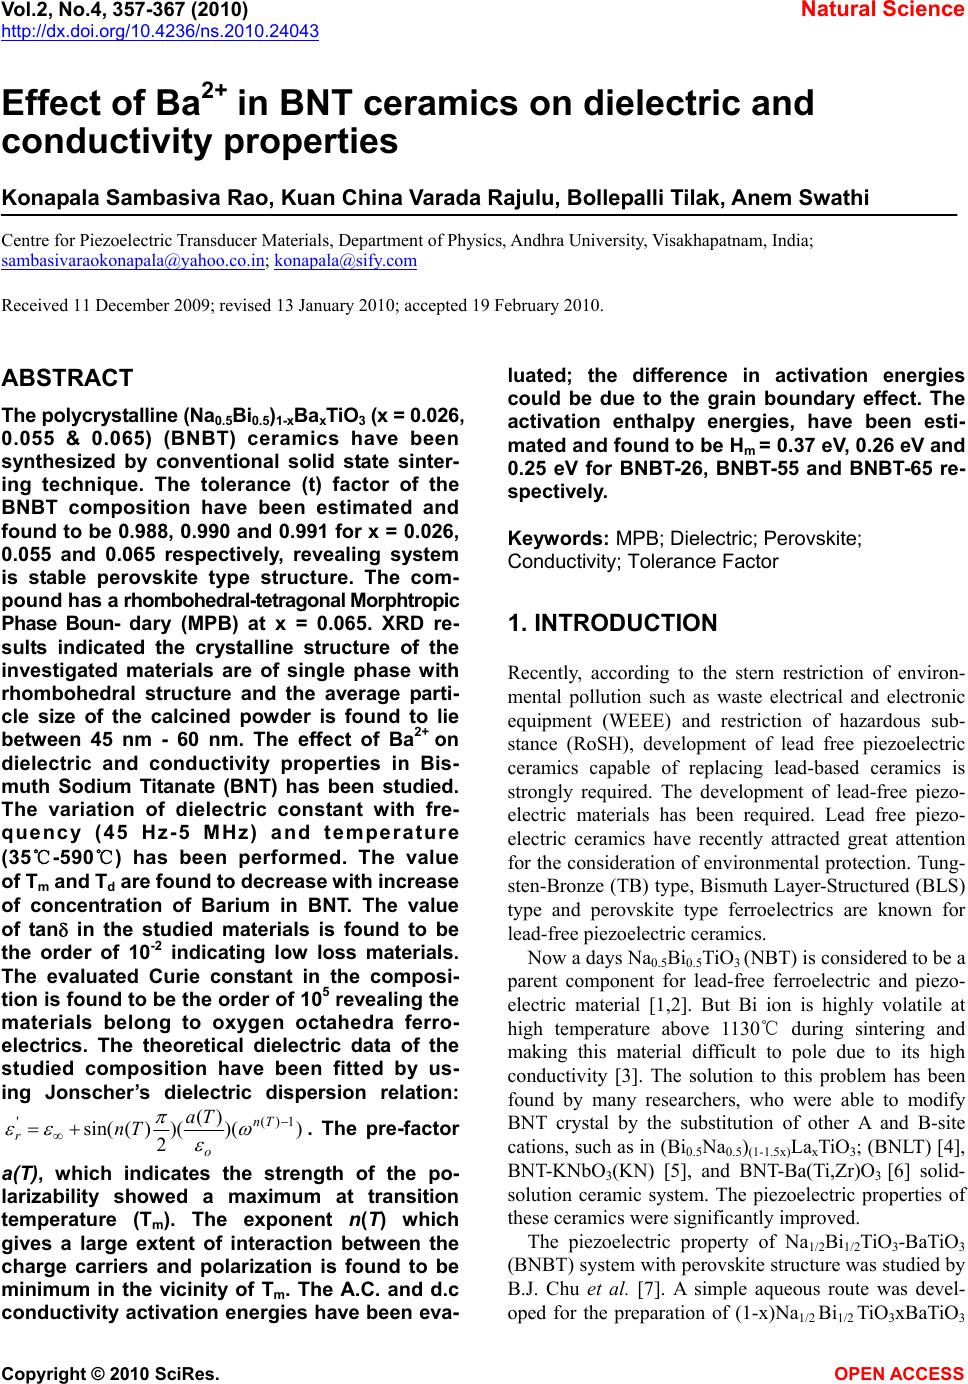
|