 Creative Education 2012. Vol.3, No.1, 16-23 Published Online February 2012 in SciRes (http://www.SciRP.org/journal/ce) http://dx.doi.org/10.4236/ce.2012.31003 Copyright © 2012 SciRes. 16 Program Selection among Pre-Service Teachers: MBTI Profiles within a College of Education Stephen Rushton, Jenni Menon Mariano, Tary L. Wallace University of South Florida Sarasota-Manatee, Sarasota, USA Email: srushton@sar.usf.edu Received October 8th, 2011; revised November 7th, 2011; accepted November 20th, 2011 This study examined the relationship College of Education programs selected by pre-service teachers and their personality traits. Using the Myers-Briggs Type Indicator (MBTI) 368, pre-service teachers in 5 dif- ferent programs were assessed. Twenty-eight percent of Elementary program students favored the Sensing, Feeling, Judging typology with a mental function SF. While ECE pre-service students were inclined to- ward Sensing, Feeling and Judging (SFJ) typology they also favored Extraversion, Intuition, Feeling, Judging (ENFJ). Alternatively, Special Education pre-service students preferred Introversion, Intuition, Thinking, and Judging (INTJ). Graduate students in the Education Leadership program had a strong pref- erence for Extraversion, Sensing, Thinking and Judging (ESTJ), while students in the Masters of Arts in Teaching program had no significant type. These findings suggest that at least four groups of teacher education students self-select to a particular program depending upon their type. Implications for the re- sults for teacher-training are discussed. Keywords: Personality; Myers-Briggs; Pre-Service Students; College of Education Introduction Research studies have identified correlations between teacher effectiveness and student achievement (e.g., Copple & Brede- kamp, 2010; Darling-Hammond, 1999; Rivkin, Hanushek, & Kain, 2005; Rockoff, 2004; Sanders & Horn, 1995). Although these studies demonstrate some mixed findings, correlations were found to exist between student achievement and, teachers’ dispositions, articulation and classroom management skills, content matter preparation, and the number of years of teaching. In each of their own ways, these factors contribute to teacher effectiveness and greater student learning. The importance of the classroom teacher for enhancing student achievement was highlighted by Sanders and Horn (1998) using the Tennessee Value-Added Assessment System and later replicated using databases from Dallas, Texas. In summary, studies find teach- ing effectiveness to be a major determinant of student learning. It appears as though students who are assigned to ineffective teachers have significantly lower gains in achievement com- pared to those students assigned to highly effective teachers (Sanders & Rivers, 1996, p. 21). But what makes for a highly effective teacher? Certainly, as Brandsford & Darling-Hammond (2006) note, teaching effec- tiveness can be enhanced through improved teacher education, certification status, and years of experience. However, in this paper, we examine the personality traits that student teachers bring to their programs before they set out on any formal train- ing. Knowledge of students’ personality traits is important for teacher-educators. Studies over the past forty years relating to teachers’ person- ality traits have produced generally positive results (Rushton, Jackson, & Richard, 2007). However, there is consistent evi- dence that a positive relationship exists between student learn- ing and teachers who display such strengths as flexibility, crea- tivity and adaptability (Berliner & Biddle, 1995; Rushton Smith & Knoop, 2006). Results of one study demonstrated that edu- cators awarded the honor of “Teacher of the Year” by their school boards were viewed as being perceptive, open to new ideas, intuitive, and embodying a range of teaching strategies and interactive styles (Rushton et al., 2006). These findings are consistent with other research on effective teaching, suggesting successful teachers are able to adjust their teaching to suit the varying needs of different students and the demands of different instructional goals, topics and methods (Marzano, Pickering, & Pollock, 2001). In this paper we will explore the Myers-Briggs “Types” of students entering one College of Education (COE). Our purpose was to determine how pre-service teachers’ personality traits differ by their choice of program. We first provide a context for the study by reviewing the relevant research on psychological type theory and its application to career choices and the field of education. We then discuss our methodology and findings and conclude with a discussion of the implications of this study in the broader context of teacher preparation. Psychological Type The or y Psychological type theory has been found to support the connection between individual differences in personality pro- files and particular professional career choices. Rooted in the work of Jung (1971), the Myers-Briggs Type Indicator (MBTI) is a 166 item self-report inventory (G Form) based on four bi- polar dimensions. Each scale represents a continuum of a par- ticular trait. Once scored, a four-by-four matrix describes 16 individual Type s, each differentiated with unique characteristics and understanding of how: 1) we are either oriented to the outer world of people, or, are oriented internally by ideas, thoughts and feelings (Extraversion-Introversion); 2) we either gather information from the world around us using our five senses, or understand the world from a more intuitive self (Sensing-Intui- 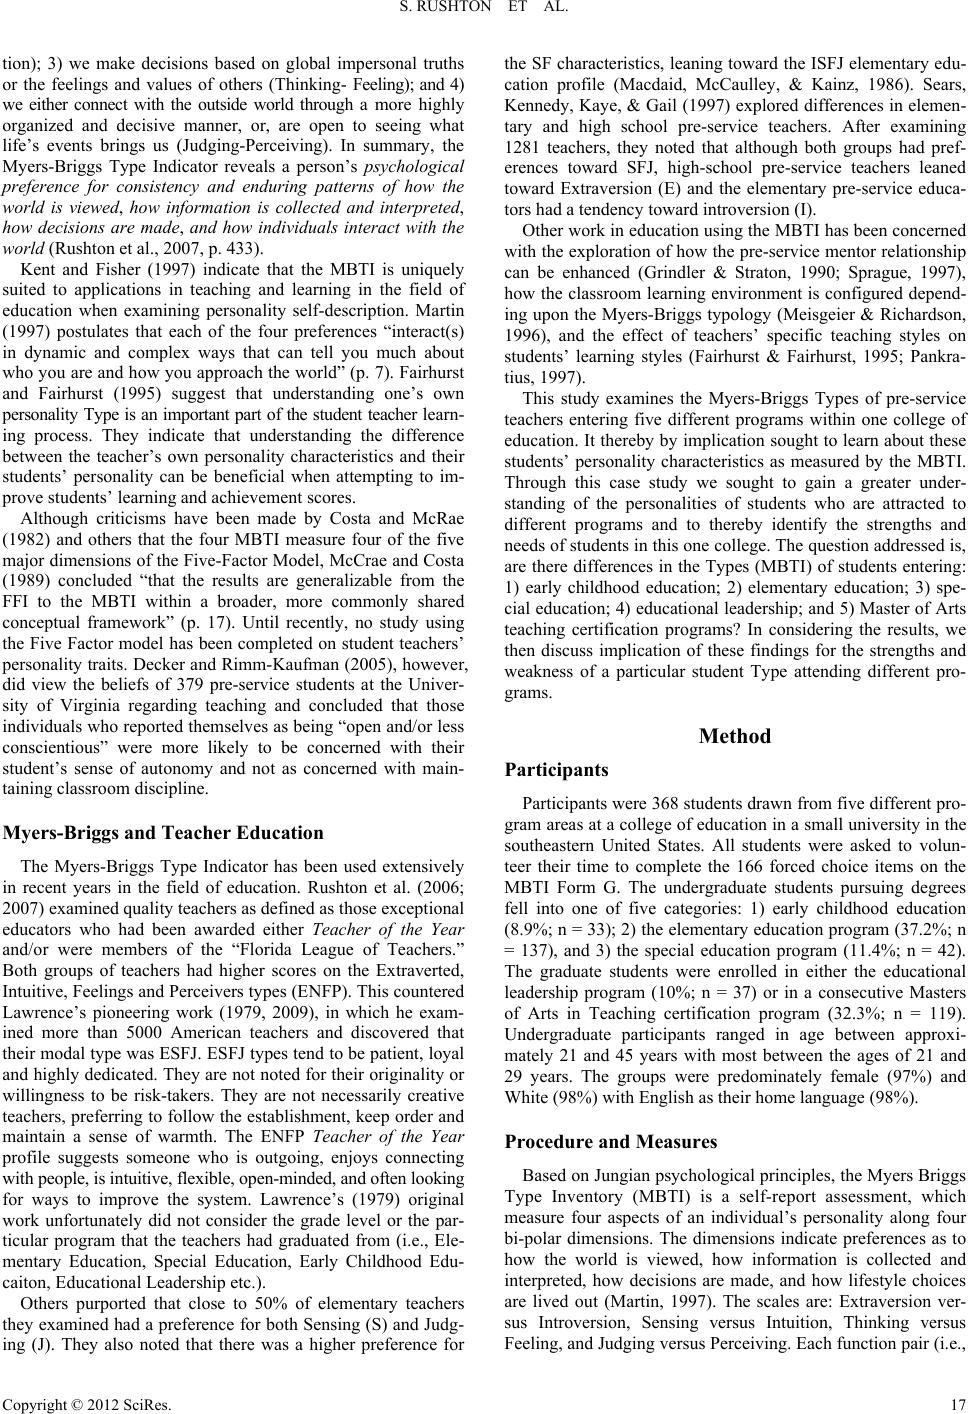 S. RUSHTON ET AL. tion); 3) we make decisions based on global impersonal truths or the feelings and values of others (Thinking- Feeling); and 4) we either connect with the outside world through a more highly organized and decisive manner, or, are open to seeing what life’s events brings us (Judging-Perceiving). In summary, the Myers-Briggs Type Indicator reveals a person’s psychological preference for consistency and enduring patterns of how the world is viewed, how information is collected and interpreted, how decisions are made, and how individuals interact with the world (Rushton et al., 2007, p. 433). Kent and Fisher (1997) indicate that the MBTI is uniquely suited to applications in teaching and learning in the field of education when examining personality self-description. Martin (1997) postulates that each of the four preferences “interact(s) in dynamic and complex ways that can tell you much about who you are and how you approach the world” (p. 7). Fairhurst and Fairhurst (1995) suggest that understanding one’s own personality Type is an important part of the student teacher learn- ing process. They indicate that understanding the difference between the teacher’s own personality characteristics and their students’ personality can be beneficial when attempting to im- prove students’ learning and achievement scores. Although criticisms have been made by Costa and McRae (1982) and others that the four MBTI measure four of the five major dimensions of the Five-Factor Model, McCrae and Costa (1989) concluded “that the results are generalizable from the FFI to the MBTI within a broader, more commonly shared conceptual framework” (p. 17). Until recently, no study using the Five Factor model has been completed on student teachers’ personality traits. Decker and Rimm-Kaufman (2005), however, did view the beliefs of 379 pre-service students at the Univer- sity of Virginia regarding teaching and concluded that those individuals who reported themselves as being “open and/or less conscientious” were more likely to be concerned with their student’s sense of autonomy and not as concerned with main- taining classroom discipline. Myers-Briggs and Te a cher Educa tion The Myers-Briggs Type Indicator has been used extensively in recent years in the field of education. Rushton et al. (2006; 2007) examined quality teachers as defined as those exceptional educators who had been awarded either Teacher of the Year and/or were members of the “Florida League of Teachers.” Both groups of teachers had higher scores on the Extraverted, Intuitive, Feelings and Perceivers types (ENFP). This countered Lawrence’s pioneering work (1979, 2009), in which he exam- ined more than 5000 American teachers and discovered that their modal type was ESFJ. ESFJ types tend to be patient, loyal and highly dedicated. They are not noted for their originality or willingness to be risk-takers. They are not necessarily creative teachers, preferring to follow the establishment, keep order and maintain a sense of warmth. The ENFP Teacher of the Year profile suggests someone who is outgoing, enjoys connecting with people, is intuitive, flexible, open-minded, and often looking for ways to improve the system. Lawrence’s (1979) original work unfortunately did not consider the grade level or the par- ticular program that the teachers had graduated from (i.e., Ele- mentary Education, Special Education, Early Childhood Edu- caiton, Educational Leadership etc.). Others purported that close to 50% of elementary teachers they examined had a preference for both Sensing (S) and Judg- ing (J). They also noted that there was a higher preference for the SF characteristics, leaning toward the ISFJ elementary edu- cation profile (Macdaid, McCaulley, & Kainz, 1986). Sears, Kennedy, Kaye, & Gail (1997) explored differences in elemen- tary and high school pre-service teachers. After examining 1281 teachers, they noted that although both groups had pref- erences toward SFJ, high-school pre-service teachers leaned toward Extraversion (E) and the elementary pre-service educa- tors had a tendency toward introversion (I). Other work in education using the MBTI has been concerned with the exploration of how the pre-service mentor relationship can be enhanced (Grindler & Straton, 1990; Sprague, 1997), how the classroom learning environment is configured depend- ing upon the Myers-Briggs typology (Meisgeier & Richardson, 1996), and the effect of teachers’ specific teaching styles on students’ learning styles (Fairhurst & Fairhurst, 1995; Pankra- tius, 1997). This study examines the Myers-Briggs Types of pre-service teachers entering five different programs within one college of education. It thereby by implication sought to learn about these students’ personality characteristics as measured by the MBTI. Through this case study we sought to gain a greater under- standing of the personalities of students who are attracted to different programs and to thereby identify the strengths and needs of students in this one college. The question addressed is, are there differences in the Types (MBTI) of students entering: 1) early childhood education; 2) elementary education; 3) spe- cial education; 4) educational leadership; and 5) Master of Arts teaching certification programs? In considering the results, we then discuss implication of these findings for the strengths and weakness of a particular student Type attending different pro- grams. Method Participants Participants were 368 students drawn from five different pro- gram areas at a college of education in a small university in the southeastern United States. All students were asked to volun- teer their time to complete the 166 forced choice items on the MBTI Form G. The undergraduate students pursuing degrees fell into one of five categories: 1) early childhood education (8.9%; n = 33); 2) the elementary education program (37.2%; n = 137), and 3) the special education program (11.4%; n = 42). The graduate students were enrolled in either the educational leadership program (10%; n = 37) or in a consecutive Masters of Arts in Teaching certification program (32.3%; n = 119). Undergraduate participants ranged in age between approxi- mately 21 and 45 years with most between the ages of 21 and 29 years. The groups were predominately female (97%) and White (98%) with English as their home language (98%). Procedure and Measures Based on Jungian psychological principles, the Myers Briggs Type Inventory (MBTI) is a self-report assessment, which measure four aspects of an individual’s personality along four bi-polar dimensions. The dimensions indicate preferences as to how the world is viewed, how information is collected and interpreted, how decisions are made, and how lifestyle choices are lived out (Martin, 1997). The scales are: Extraversion ver- sus Introversion, Sensing versus Intuition, Thinking versus Feeling, and Judging versus Perceiving. Each function pair (i.e., Copyright © 2012 SciRes. 17  S. RUSHTON ET AL. Copyright © 2012 SciRes. 18 I-E) is continuous in nature and although an individual may score toward one end of the scale this does not preclude them from acting in ways that support the opposite mental function. There are, therefore, 16 possible combinations of the four di- mensions that represent different personality inclinations. Di- mensions can be further delineated into functions pairs sensing and thinking (ST), sensing and feeling (SF), intuition and feel- ing (NF), and intuition and thinking (NT). As reported in a meta-analytic reliability generalization study on the MBTI by Capraro & Capraro (2005), test-retest and internal consistency reliability estimates are described as acceptable to strong across studies, and have varied by context. The mean Cronbach alpha coefficient for the full scale across the studies they reviewed is .816 (SD = .082), while the mean test-retest reliability coeffi- cient is .813 (SD = .098). Construct validity of the MBTI has been studied by Devito (1985) and by Myers and McCauley (1989), who found correlations among MBTI ratings, self-as- sessment of participants’ own MBTI type, and behaviors reflec- tive of MBTI constructs. Factor analysis conducted on the MBTI by Thompson and Borrello (1986) show discrete factors. educational leadership students) to give a presentation on Type Theory. All students, after completing the questionnaire, were given a 3-hour seminar on Type Theory and classroom prac- tices. Analyses and Results The MBTI results were analyzed using PASW 18.0 and Quantitative Skills statistical software. The data included the frequency and percentages of responses for the full sample (N = 368) and by each program for each MBTI main type (of 16 possible types), for each sub type function pairs (ST, SF, NF or NT), and for Extraversion or Introversion sub-type. A set of χ² tests of independence generated were examined differences in participants’ main MBTI types by program, mental cognitive sub-types by program, and extraversion/introversion sub-types by program. Seven of the tests of main MBTI type by program were sig- nificant: ISTP (χ² = 18.831, p = .001), ESTJ (χ² = 23.292, p = .000), ISFJ (χ = 19.324, p = .001), ESFJ (χ² = 10.498, p = .033), ENFJ (χ² = 10.861, p = .028), INTJ (χ² = 37.096, p = .000), ENTJ (χ² = 12.343, p = .015). Three of the mental cog- nition type-by-program tests were significant: ST (Sensing/ Thinking (χ² = 24.598, p = .000)1, SF (Sensing/Feeling χ² = 22.912, p = .000), NT (Intuiting/Thinking χ² = 15.627, p = .004) (see Table 1). There were no program differences by extraver- sion/introversion. Over the past 6 years the MBTI was often administered as part of the course content. Specifically, as part of a classroom management course, all students were asked to take the MBTI as part of the course content. In those cases where students were not enrolled in courses taught by the instructors, other faculty would approach us, as in the case with the special education students, or we approached them (i.e., as in the case with the Table 1. Percent of MBTI main types and sub-types by program samples. Program Eled Spec Edld Echd Mat Type N = 137 N = 42 N = 37 N = 33 N = 119 Percentage of full sample ISTJ 4.37 2.38 16.22 0.00 3.36 4.62 ISTP** 0.72 9.53 0.00 9.09 0.84 2.45 ESTP 0.72 0.00 0.00 0.00 1.68 0.82 ESTJ*** 1.46 19.04 16.22 0.00 8.40 7.07 ISFJ** 20.44 4.76 0.00 27.28 10.93 14.13 ISFP 2.92 0.00 0.00 0.00 0.00 1.08 ESFP 4.37 9.53 8.10 9.09 10.93 7.88 ESFJ* 18.97 9.53 0.00 9.09 15.97 14.13 INFJ 6.56 7.14 0.00 9.09 5.04 5.71 INFP 2.92 0.00 0.00 0.00 7.56 3.53 ENFP 13.86 2.38 16.22 9.09 13.45 12.23 ENFJ* 13.13 7.14 13.51 18.18 3.36 9.78 INTJ*** 0.72 21.43 0.00 0.00 5.04 4.35 INTP 2.92 0.00 10.81 0.00 2.52 2.98 ENTP 2.19 4.76 0.00 0.00 1.68 1.90 ENTJ* 3.64 2.38 18.92 9.09 9.24 7.34 Total 100.00 100.00 100.00 100.00 100.00 100.00 E 58.39 54.76 72.97 54.55 64.71 68.14 I 41.61 45.24 27.03 45.45 35.29 38.86 Total 100.00 100.00 100.00 100.00 100.00 100.00 ST** 7.30 30.95 32.43 9.09 14.28 14.94 SF*** 46.72 23.81 8.11 45.46 37.81 37.23 NF 36.49 16.67 29.73 36.36 29.42 31.25 NT** 9.49 28.57 29.73 9.09 18.49 16.58 Total 100.00 100.00 100.00 100.000 100.00 100.00 Note: Eled = Elementary Education. Spec = Special Education. Edld = Educational Leadership. Echd = Early Childhood Education. Mat = Master of Arts in Teaching. ST = Sensing/Thinking. SF = Sensing/Feeling. NF = Intuition/Feeling. NT = Intuition/Thinking. E = Extrovert. I = Introvert. Statistics are percentage of program sample unless otherwise specified. *p < .05, **p < .01, ***p < .001. 1Some researchers may prefer exact tests over chi-square in some of these analyses. Simulation studies show that chi-square performs well regardless of the observed frequency however (Roscoe & Byars, 1971), and our study does not fulfill the assumption of fixed marginal values used by the exact tests. For the reader’s interest however, exact tests did not change the interpretation of the results. df = 4, N = 368.  S. RUSHTON ET AL. Post-Hoc Analyses Where χ² tests were significant, a “stopping procedure” (Mar- kowski & Markowski, 2009) was used to test the relative con- tribution of each program to the χ² statistic for each type. In this method, the independent variables (in this case, program type) are manually removed (i.e., by conducting a new test without that variable) one by one, beginning with the variable with the largest differences between observed and expected counts.2 As each largest-contributing variable is removed, the χ² statistic is re-examined. The procedure is complete when the final itera- tion shows no significant χ² statistic. Remaining variables are therefore not significant contributors to the model. This method is an objective way of identifying cells that are important for further analysis (Markowski & Markowski, 2009). Tables 2 and 3 show iterations for the significant tests. Our interpretation of results utilizes Bonferroni adjustments to control for the risk of Type I error. Discussion The first theoretically interesting finding is that more than twenty-eight percent of participants in the full (N = 368) sample were allocated to either ISFJ (14.13%) or ESFJ (14.13%) main types—a finding that supports conclusions about the prefer- ences of the typical profile of American school teachers (Law- rence, 1979, 2009; Macdaid et al., 1986; and Sears et al., 1997). The post-hoc tests confirmed this trend. Students enrolled in the elementary education program contributed most to the ISFJ type and the ESFJ type (28.26%). We found that when the other group of teachers of younger children (the early childhood education majors) were also removed from the model for ISFJ, it was no longer significant. Another interesting finding, however, is that early childhood education and elementary education majors also contributed most to the ENFJ type preference. No other research was found on Early Childhood pre-service teachers with which to compare these findings. A third interesting finding is what appears to be diversity among special education majors and educational leadership majors for MBTI preferences across personality quadrants. In one case, special education majors grouped with early child- hood majors in contributing to an ISTP chi-square model—or a preference for that type. In another instance, we found special education majors preferring the ESTJ type in a model with educational leadership students. In a third instance, special education majors were the only group to contribute positively, and significantly, to the INTJ preference type (Table 2). This last finding supports a similar finding by Mills (2003) who examined 63 gifted teachers and found the majority of them to have NT as their primary mental functions. In contrast, educa- tional leadership majors are distinguished, along with special education students, by significant contribution to the ESTJ type model in the current sample. Alternately, however, they also had the largest contribution to the ENTJ type (Table 2). Table 2. Chi-square models (main MBTI type X program). ISTP ESTJ ISFJ Type Iteration 1 2 1 2 3 1 2 Eled Eled Eled Eled Eled Eled Spec –1.3 –.08 –2.5 –2.0 –3.7 8.6 –2.4 Spec Edld Spec Edld Echd Spec Edld 2.9 –.08 2.9 2.8 –1.2 –3.9 –3.8 Edld Echd Edld Echd Mat Edld Echd –1.0 3.5 2.1 –1.3 5.1 –5.2 5.6 Echd Mat Echd Mat Echd Mat 2.5 –.08 –1.5 1.3 4.3 0.6 Mat Mat Mat –1.1 0.5 –3.8 df, n 4, 368 3, 326 4, 368 3, 326 2, 289 4, 368 3, 231 χ² 18.831 14.021 23.292 16.268 9.329 19.324 15.585 p .002 .003 .000 .001 .009 .001 .001 ESFJ ENFJ INTJ ENTJ Type Iteration 1 2 1 2 1 2 1 2 Eled Spec Eled Eled Eled Eled Eled Eled 1.5 –.3 1.3 5.7 –2.0 –1.1 –1.6 –1.1 Spec Spec Spec Spec Spec Spec –.08 –2.0 –.05 –.8 5.3 –.9 –1.2 –1.0 Edld Echd Edld Edld Edld Echd Edld Echd –2.3 –.4 .7 1.7 –1.3 –.8 2.6 0.7 Echd Mat Echd Mat Echd Mat Echd Mat –.08 1.5 1.5 –6.7 –1.2 2.2 .4 1.4 Mat Mat Mat Mat .05 –2.2 .4 .8 df, n – 3, 231 4, 368 3, 335 4, 368 3, 326 4, 368 3, 331 χ² 10.498 7.618 10.861 8.620 37.096 7.592 12.343 5.062 p .033 .055 .028 .035 .000 .055 .015 .167 Note: Standardized residuals are below program variables, and indicate the extent to which each program contribute to the model. p is initially significant at .05 level and at .025 and at .016 levels for second and third iterations, respectively. Eled = Elementary Education. Spec = Special Education. Edld = Educational Leadership; Echd = Early Childhood Education. Mat = Master of Arts in Teaching. 2In this case we used standardized residuals. Copyright © 2012 SciRes. 19 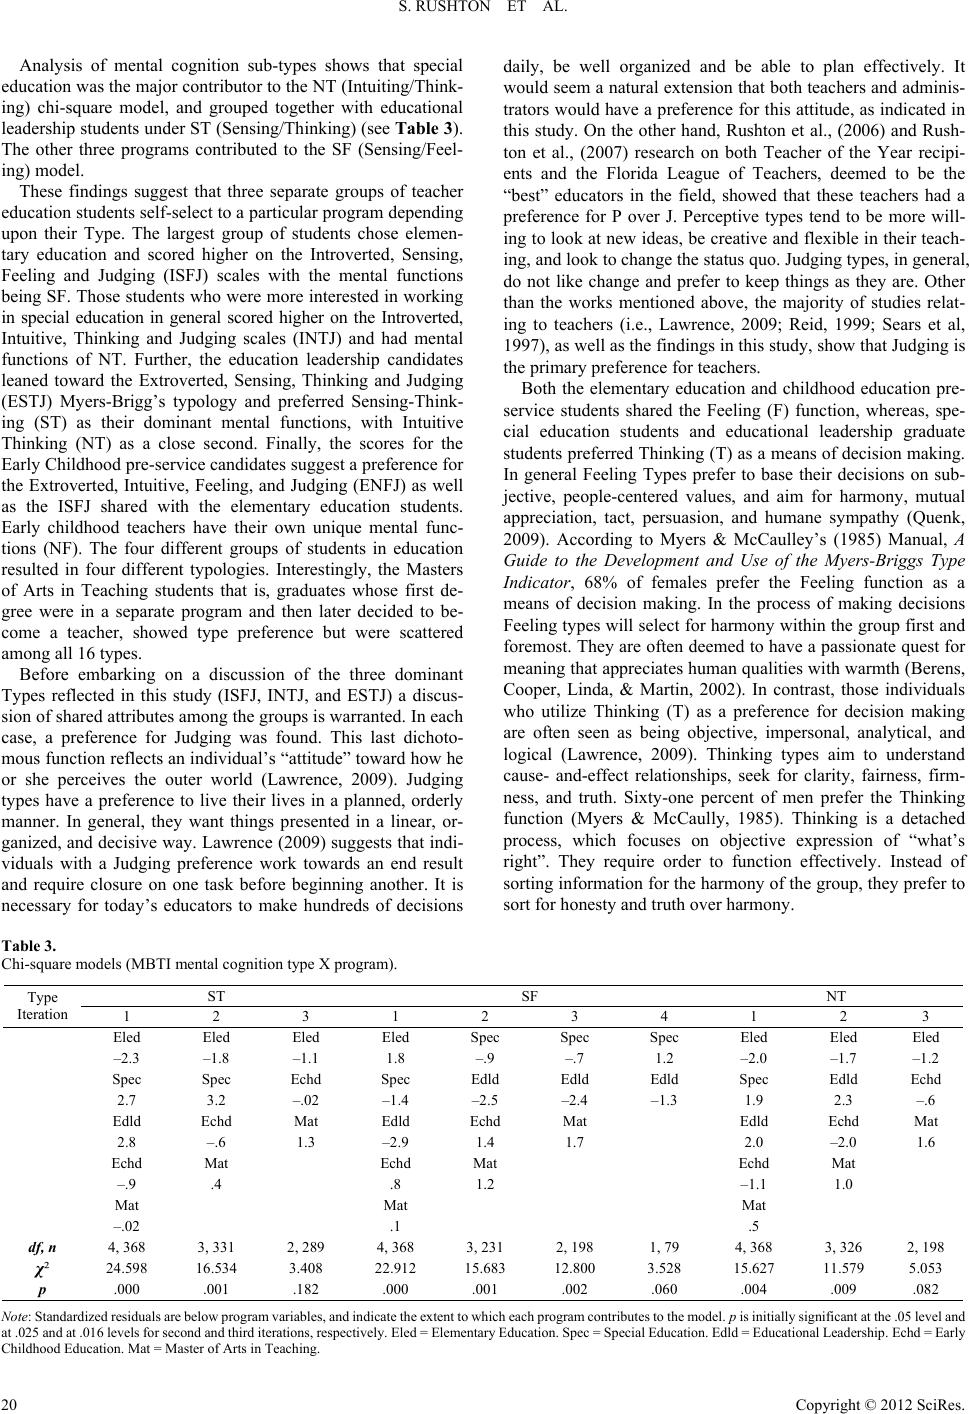 S. RUSHTON ET AL. Analysis of mental cognition sub-types shows that special education was the major contributor to the NT (Intuiting/Think- ing) chi-square model, and grouped together with educational leadership students under ST (Sensing/Thinking) (see Table 3). The other three programs contributed to the SF (Sensing/Feel- ing) model. These findings suggest that three separate groups of teacher education students self-select to a particular program depending upon their Type. The largest group of students chose elemen- tary education and scored higher on the Introverted, Sensing, Feeling and Judging (ISFJ) scales with the mental functions being SF. Those students who were more interested in working in special education in general scored higher on the Introverted, Intuitive, Thinking and Judging scales (INTJ) and had mental functions of NT. Further, the education leadership candidates leaned toward the Extroverted, Sensing, Thinking and Judging (ESTJ) Myers-Brigg’s typology and preferred Sensing-Think- ing (ST) as their dominant mental functions, with Intuitive Thinking (NT) as a close second. Finally, the scores for the Early Childhood pre-service candidates suggest a preference for the Extroverted, Intuitive, Feeling, and Judging (ENFJ) as well as the ISFJ shared with the elementary education students. Early childhood teachers have their own unique mental func- tions (NF). The four different groups of students in education resulted in four different typologies. Interestingly, the Masters of Arts in Teaching students that is, graduates whose first de- gree were in a separate program and then later decided to be- come a teacher, showed type preference but were scattered among all 16 types. Before embarking on a discussion of the three dominant Types reflected in this study (ISFJ, INTJ, and ESTJ) a discus- sion of shared attributes among the groups is warranted. In each case, a preference for Judging was found. This last dichoto- mous function reflects an individual’s “attitude” toward how he or she perceives the outer world (Lawrence, 2009). Judging types have a preference to live their lives in a planned, orderly manner. In general, they want things presented in a linear, or- ganized, and decisive way. Lawrence (2009) suggests that indi- viduals with a Judging preference work towards an end result and require closure on one task before beginning another. It is necessary for today’s educators to make hundreds of decisions daily, be well organized and be able to plan effectively. It would seem a natural extension that both teachers and adminis- trators would have a preference for this attitude, as indicated in this study. On the other hand, Rushton et al., (2006) and Rush- ton et al., (2007) research on both Teacher of the Year recipi- ents and the Florida League of Teachers, deemed to be the “best” educators in the field, showed that these teachers had a preference for P over J. Perceptive types tend to be more will- ing to look at new ideas, be creative and flexible in their teach- ing, and look to change the status quo. Judging types, in general, do not like change and prefer to keep things as they are. Other than the works mentioned above, the majority of studies relat- ing to teachers (i.e., Lawrence, 2009; Reid, 1999; Sears et al, 1997), as well as the findings in this study, show that Judging is the primary preference for teachers. Both the elementary education and childhood education pre- service students shared the Feeling (F) function, whereas, spe- cial education students and educational leadership graduate students preferred Thinking (T) as a means of decision making. In general Feeling Types prefer to base their decisions on sub- jective, people-centered values, and aim for harmony, mutual appreciation, tact, persuasion, and humane sympathy (Quenk, 2009). According to Myers & McCaulley’s (1985) Manual, A Guide to the Development and Use of the Myers-Briggs Type Indicator, 68% of females prefer the Feeling function as a means of decision making. In the process of making decisions Feeling types will select for harmony within the group first and foremost. They are often deemed to have a passionate quest for meaning that appreciates human qualities with warmth (Berens, Cooper, Linda, & Martin, 2002). In contrast, those individuals who utilize Thinking (T) as a preference for decision making are often seen as being objective, impersonal, analytical, and logical (Lawrence, 2009). Thinking types aim to understand cause- and-effect relationships, seek for clarity, fairness, firm- ness, and truth. Sixty-one percent of men prefer the Thinking function (Myers & McCaully, 1985). Thinking is a detached process, which focuses on objective expression of “what’s right”. They require order to function effectively. Instead of sorting information for the harmony of the group, they prefer to sort for honesty and truth over harmony. Table 3. Chi-square models (MBTI mental cognition type X program). ST SF NT Type Iteration 1 2 3 1 2 3 4 1 2 3 Eled Eled Eled Eled Spec Spec Spec Eled Eled Eled –2.3 –1.8 –1.1 1.8 –.9 –.7 1.2 –2.0 –1.7 –1.2 Spec Spec Echd Spec Edld Edld Edld Spec Edld Echd 2.7 3.2 –.02 –1.4 –2.5 –2.4 –1.3 1.9 2.3 –.6 Edld Echd Mat Edld Echd Mat Edld Echd Mat 2.8 –.6 1.3 –2.9 1.4 1.7 2.0 –2.0 1.6 Echd Mat Echd Mat Echd Mat –.9 .4 .8 1.2 –1.1 1.0 Mat Mat Mat –.02 .1 .5 df, n 4, 368 3, 331 2, 289 4, 368 3, 231 2, 198 1, 79 4, 368 3, 326 2, 198 χ² 24.598 16.534 3.408 22.912 15.683 12.800 3.528 15.627 11.579 5.053 p .000 .001 .182 .000 .001 .002 .060 .004 .009 .082 Note: Standardized residuals are below program variables, and indicate the extent to which each program contributes to the model. p is initially significant at the .05 level and at .025 and at .016 levels for second and third iterations, respectively. Eled = Elementary Education. Spec = Special Education. Edld = Educational Leadership. Echd = Early Childhood Education. Mat = Master of Arts in Teaching. Copyright © 2012 SciRes. 20  S. RUSHTON ET AL. It is clear that Feeling and Thinking types have distinct styles in making decisions. Generally, classroom teaching requires being thoughtful of group dynamics and making decisions that involve many individuals. Both the early childhood and ele- mentary education pre-service students had a preference for the Feeling function in their decision making. Principals are often required to make large scale, system-wide decisions that affect the operation of many individuals. When planning schedules for buses, lunch rotations, teacher breaks and class rotations, a clear analytical decision making process may be a better match. The special education pre-service teachers also leaned toward the Thinking function. Perhaps the need to be somewhat de- tached from the particulars of working with special education students requires a more analytical perspective. These findings supported Mills (2003) study which examined 63 gifted teach- ers and discovered that they had preferences for combined NT mental functions. Mills suggest that the combination of mental functions (NT) seek “abstract themes and concepts, are open and flexible, and value logical analysis and objectivity” (p. 285). The remainder of the discussion will look at each of the three distinct types: Pre-service elementary and child-hood education students (ISFJ); pre-service special education students (INTJ); and graduate students in the education leadership and supervi- sion program (ESTJ). The students in the Masters of Arts in Teaching programs showed no significant type preference. The ISFJ Elementary Teacher Twenty-eight percent of the students in this study had a pref- erence for ISFJ and consisted primarily of elementary and early- childhood pre-service students. Our results support findings by Lawrence (2009), who indicates that the SFJ profile represents over 32% of elementary school teachers and 30% of early childhood teachers. Martin (1997) states that the ISFJ teacher personality is someone who has a deep respect for working in harmony with others and desires to complete tasks one at a time. ISFJs are known to have an organized and realistic approach to life. Further, they have a keen respect and command for facts and enjoy focusing on details in order to complete a specific task. Fairhurst and Fairhurst (1995) outline the personality prefer- ences of the ISFJ teacher as being considerate, dedicated and service minded. Further, they suggest that the ISFJ teacher seeks to establish a calm atmosphere at work leaning toward being pragmatic, highly conscientious, and works well when rules are clearly established (p. 97). The ISFJ educator does not lean to- ward a free-flowing, spontaneous classroom. Such educators have a propensity to use workbook assignments via pencil and paper drills, with a “quiet desk work approach” to learning as their main means of teaching (Hirsh & Kummerow, 1997). Fi- nally, the ISTJ educator is known to create a protective learning environment, one that stays constant and where change is kept to a minimum. They have a strong need to keep things in order. The INTJ Special Education Educator According to Lawrence (2009) only 4 percent of elementary education teachers are considered INTJ’s. Lawrence’s study provides no percentages for special education teachers who are of this type. However, over 10 percent of university professors fall into this category. Fairhur stand Fairhurst (1995) suggest that this is due, in part, to the NT’s desire to master specific areas of study. At the college level they prefer to teach one or two subjects in which they are highly competent. They can be single minded and use this strength to understand complex systems. They have an internal desire to understand truth. In many ways this would fit the special education teacher profile. Within the field of special education are separate and unique fields of in- terest (e.g., gifted education, specific learning disabilities). Elementary education teachers are required to learn all content areas whereas the special education student can focus on a unique, often complex discipline. The intuitive-Thinking (NT) educator is considered to be the rational teacher and prefers autonomy and encourages indi- vidualism among their students. The INTJ educator is also thought to be among the “most directive of all types”, is highly self- motivated, often visionary, and is persistent in the desire to refine and improve knowledge. Lawrence (2009, p. A-8) sug- gests that INTJ types in general, who find a career that appeals to them, are highly motivated and can be skeptical, critical, and independent. Special education teachers are often seen as sepa- rate from the main body of teachers within a school and require a certain level of autonomy. They often have complicated stu- dent profiles that may require complex individual educational plans. The ESTJ Education Leadership Educator The ESTJ profile is distinctively different than the previous two Myers-Briggs Types. Hirsh & Kummerow (1997) indicate that some characteristics that define this Type are: industrious, matter-of-fact, responsible, and efficient. Fairhurst and Fair- hurst (1995) suggest that the ESTJ teacher is found more in the middle and high school levels and less in the primary grades where students are dependent upon the teacher and require more nurturing. These types are known for their ability to eco- nomically manage resources well, logistically be able to plan efficiently by setting realistic goals, and, enjoying making deci- sions (Lawrence, 2009). Given their unique strengths, ESTJ’s often become school administrators at all levels (i.e., in ele- mentary and secondary schools, colleges, and technical intui- tions). It is not surprising that 32% of the students in this study who are returning to graduate studies in Administration and Supervision follow the STJ profile. There does not seem to be a preference for either Introversion or Extraversion with this group of graduate students. Limitations of the Study and Future Directions A number of interesting questions arise from this study. The variety of Type preferences within this group warrants further investigation of the characteristics of special education and educational leadership students, for example. Our specific demo- graphic data on the current sample were limited, so further comparison by gender, age, or other demographic variables was not possible. Future research should aim to address this issue. A few other features of the study limit the conclusions that can be drawn. The participants were not randomly selected (they were selected from the particular courses they took), nor were they representative of teachers-in-training in general. Thus the nature of the sample, including its size, affects generaliza- tion of the results. Another limitation is that data on more de- tailed characteristics of the individuals were not collected, such as socio-economic status, prior education, or prior employment Copyright © 2012 SciRes. 21  S. RUSHTON ET AL. experience. For the graduate students in particular, a more ex- tensive knowledge of prior background might provide a deeper understanding of reasons for their program choices. Finally, our measures of personality traits merit more exten- sive measurement and triangulation of data sources to gain a broader picture of these variables. Comparison of findings with use of the McCrae and Costa’s (1989) five factor model, for instance, could yield valuable comparative results on the re- search questions studied. This study addresses two succinct research questions about phenomena that occur along the path- way to teacher effectiveness, but a multitude of individual fac- tors along that pathway that conceive of personality in a broader way merit examination. Conclusion Today’s teachers face some formidable challenges to effec- tive practices. These include adjusting to a change in the demo- graphic characteristics of the students they teach and to height- ened performance goals required by policy makers. A key way in which teachers can respond to these challenges is through the way they interact with students. Learning to understand one’s unique qualities, temperament, and attitudes is an important part of the education process, yet it is one that is not generally part of pre-service training. Because the teachers’ personalities have an impact on how they interact with students, and thus on student achievement, much more attention should be given to them. Knowledge of students’ personality traits is important for teacher-educators. Just as school teachers’ knowledge of their students’ personalities helps them to teach them more effec- tively, teacher educators are well equipped when they under- stand the strengths that their own students (i.e., pre-service teachers) are bringing to the table. Colleges of education will similarly benefit by knowing the types of students who are attracted to their teacher education programs: They can then better design programs in accordance with students’ needs, and consider how to attract a diversity of students to the profession. It would serve those of us working in teacher education pro- grams to better understand our own unique personality traits, because they impact our style of teaching. As with students, different professors of education (i.e., those teaching in Early- childhood, Elementary, MAT, and Educational Leadership programs) are attracted to a particular field, so more diversity may be required in teaching our pre-service students. This may have implications for how we organize our colleges of educa- tion. More research could be conducted looking at professors of education and their Types and the programs they serve. Also, implications regarding such programs could be addressed at the district and school level. Schools are grouping children with similar ranges of abilities and preferences. Knowing one’s type might further aid this learning process. Working with compara- ble Types might be more productive in that, those who interpret the world and process information in the same manner may find working together more stimulating. On the other hand, placing different types together can also be most supportive in teaching for diversity of thinking. In all cases, becoming an outstanding educator does require the ability to reflect on one’s teaching and thinking. How we make decisions, based upon what facts we perceive, can influ- ence how we organize a room, what curriculum we choose, and ultimately, how we teach. Knowing one’s Type helps support educators as a first step toward this goal. REFERENCES Bayne, R. (2005). Ideas and evidence: Critical reflections on MBTI theory and practice. Gainesville, FL: Center for Applications of Psy- chological Type. Berliner, D. C., & Biddle, B. J. (1995). The manufactured crisis: Myth, fraud, and the attack on America’s public school. Reading, MA: Ad- dison-Wesley. Bransford, J., & Darling-Hammond, L. (Eds.). (2006). Preparing tea- chers for a changing world: What teachers should learn and be able to do. San Francisco, CA: Jossey-Bass. Capraro, R. M., & Capraro, M. M. (2002). Myers-Briggs type indicator score reliability across studies: A meta-analytic reliability generali- zation study. Educational and Psychological Measurement, 62, 590- 602. doi:10.1177/0013164402062004004 Copple, C., & Bredekamp S. (Eds.). (2010). Developmentally appro- priate practice in early childhood programs serving children from birth through age 8 (3rd ed.). Washington, DC: NAEYC. Costa, P. T. Jr., & McCrae, R. R. (1992). NEO PI-R professional man- ual. Odessa, FL: Psychological Assessment Resources. Darling-Hammond, L. (1999). Teacher quality and student achievement: A review of state policy evidence. Washington, DC: Center for the Study of Teaching and Policy. Daub, C., Friedman, S. M., Cresci, K., & Keyser, R. (2000). Frequen- cies of MBTI types among nursing assistants providing care to nurs- ing home eligible individuals. Journal of Psychological Type, 54, 12- 16. Decker, L., & Rimm-Kaufman, S. (2003). Personality characteristics and teacher beliefs among pre-service teachers. Teacher Education Quar- terly, 35, 45-63. Devito, A. J. (1985). Review of the Myers-Briggs type indicator. In: J. V. Mitchell (Ed.), The Ninth Mental Measurement Yearbook (Vol. 2, p. 1000). Lincoln, NE: University of Nebraska. Descouzis, D. (1989). Psychological types of tax preparers. Journal of Psychological Type, 17, 36-38. Fairhurst, A. M., & Fairhurst, L. L. (1995). Effective teaching effective learning: Making the personality connection in your classroom. Palo Alto, CA: Davis-Black. Francis, J. & Wulff, K., & Robbins, M. (2008). The relationship be- tween work-related psychological health and psychological type among clergy serving in the Presbyterian Church (USA). Journal of Empirical Theology, 21 , 166-182. doi:10.1163/157092508X349854 Grindler, M. C., & Stratton, B. D. (1990). Type indicator and its rela- tionship to teaching and learning styles. Action in Teacher Education, 11, 31-34. Hanushek, E., Kain, J., & Rivikin, S. (2004). Why public schools lose teachers. Journal of Human Re s o ur c e s, 2, 326-352. doi:10.2307/3559017 Jung, C. G. (1971). Psychological types: The collected works, volume 6. London, UK: Routledge and Kegan Paul. Keirsey, D., & Bates, M. (1978). Please understand me. Del Mar, CA: Prometheus Nemesis. Kent, D., & Fisher, D. (1997). Associations between teacher personal- ity and classroom environment. Chicago, IL: Paper presented at the Annual Meeting of the American Educational Research Association, ERIC Document Reproduction Service No. ED 407395. Lawrence, G. (1979, 2009). People types and tiger stripes: A practical guide to learning styles. Gainseville, FL: Center for Application of Psychological Type. Macdaid, G. P., McCaulley, M. H., & Kainz, R. I. (1986). Myers- Briggs type indicator: Atlas of type tables. Gainesville, FL: Centre for Application of Psychological Type Inc. Meisgeiner, C. H., & Richardson, R. C. (1996). Personality types of interns in alternative teacher certification programmes. Education Forum, 60, 350-360. McCrae, R. R., & Costa, P. T. (1989). Reinterpreting the Myers-Briggs type indicator from the perspective of the Five-Factor model of per- sonality. Journal of Personality, 57, 17-40. Copyright © 2012 SciRes. 22  S. RUSHTON ET AL. Copyright © 2012 SciRes. 23 doi:10.1111/j.1467-6494.1989.tb00759.x Markowski, E. P., & Markowski, C. A. (2009). A systematic method for teaching post hoc analysis of Chi-Square tests. Decision Sciences Journal of Innovative Education, 7, 59-65. doi:10.1111/j.1540-4609.2008.00202.x Martin, C. (1999). Looking at type: The fundamentals. Gainesville, FL: Center for Applications of Psychological Type. Marzano, J., Pickering, D., & Pollock, J. (2001). Classroom instruction that works: Research-based strategies for increasing student achieve- ment. Alexandria, VA: Association for Supervision and Curriculum Development. Mills, C. J. (2007). Psychological types of academically gifted adoles- cents. Gifted Child Quarterly, 51, 285-294 Myers, I. B., & McCaulley, M. H. (1985). Manual: A guide to the de- velopment and use of the Myers-Briggs type indicator. Palo Alto, CA: Consulting Psychologists Press. National Commission on Teaching and America’s Future. (1996). What matters most: Teaching for America s future. Washington, DC: Gov- ernment Printing Office. Oswick, C., & Barber, P. (1998). Personality type and performance in an introductory level accounting course: A research note. Accounting Education, 7, 249-254. doi:10.1080/096392898331171 Quenk, N. (2009). Essentials of Myers-Briggs type indicator assess- ment (2nd ed.). New York: John Wiley & Sons. Reid, J. B. (1999). The relationship among personality type, coping strategies, and burnout in elementary teachers. Journal of Psycho- logical Type, 51, 22-33. Rigden, C. (2009). Careers and occupations: Type as a part of the whole. TypeFace, 20, 28-30. Rivkin, S. G., Hanushek, E. A., & Kain, J. F. (2005). Teachers, schools, and academic achievement. Econometrica, 73, 417-458. doi:10.1111/j.1468-0262.2005.00584.x Rockoff, J. (2004). The impact of individual teachers on student achievement: Evidence from panel data. American Economic Review, 94, 247-252. doi:10.1257/0002828041302244 Roscoe, J. T., & Byars, J. A. (1971). An investigation of the restraints with respect to sample size commonly imposed on the use of the chi-square statistic. Journal of the American Statistical Association, 66, 755-759. doi:10.2307/2284224 Rushton, S., Jackson, M., & Richard, M. (2007). Teacher’s Myers- Briggs personality profiles: Identifying effective teacher personality traits. Teaching and Teacher Education, 23, 432-441. Rushton, S., Knopp, T. Y., & Smith, R. L. (2006). Teacher of the Year award recipients. Myers-Briggs personality profiles: Identifying tea- cher effectiveness. Journal of Psychological Type, 4, 23-34. Sanders, W. L., & Horn, S. P. (1995). The Tennessee value-added assessment system (TVAAS): Mixed-model methodology in educa- tional assessment. Journal of Personnel Evaluation in Education, 8, 299-311. doi:10.1007/BF00973726 Sanders, W. L., & Rivers, J. C. (1996). Cumulative and residual effects of teachers on future student academic achievement. Knoxville, YN: University of Tennessee Value-Added Research and Assessment Cen- ter. Sears, S., Kennedy, J., Kaye, J., & Gail, L. (1997). Myers-Briggs per- sonality profiles of prospective educators. The Journal of Educa- tional Research, 90, 195-202. Sprague, M. (1997). Personality Type matching and student teaching evaluation. Contemporary Education, 69, 54-57. Thompson, B., & Borrello, G. M. (1986). Construct validity of the Myers-Briggs type indicator. Educational and Psychological Meas- urement, 46, 745-752. doi:10.1177/0013164486463032
|