 Vol.3, No.1, 58-71 (2012) Journal of Biophysical Chemistry http://dx.doi.org/10.4236/jbpc.2012.31008 Exploring MIA-QSARs for farnesyltransferase inhibitory effect of antimalarial compounds refined by docking simulations Omar Deeb1*, Sherin Alfalah1, Matheus P. Freitas2, Elaine F. F. da Cunha2, Teodorico C. Ramalho2 1Faculty of Pharmacy, Al-Quds University, Jerusalem, Palestine; *Corresponding Author: deeb2000il@yahoo.com 2Chemistry Department, Federal University of Lavras, Lavras, Brazil Received 17 November 2011; revised 29 December 2011; accepted 15 January 2012 ABSTRACT Two series of farnesyltransferase (FTase) inhibi- tors were grouped and their antimalarial activi- ties modeled by means of multivariate image analysis applied to quantitative structure-activ- ity relationship (MIA-QSAR). A reliable model was achieved, with r2 for calibration, external prediction and leave-one-out cross-validation of 0.96, 0.87 and 0.83, respectively. Therefore, bio- logical activities of congeners can be estimated using the QSAR model. The bioactivities of new compounds based on the miscellany of sub- structures of the two classes of FTase inhibitors were predicted using the MIA-QSAR model and the most promising ones were submitted to ADME (absorption, distribution, metabolism and excretion) and docking evaluation. Despite the smaller interaction energy of the two most pro- mising, predicted compounds in comparison to the two most active compounds of the data set, one of the proposed structures did not violate any Lipinski’s rule of five. Therefore, it is either a potential drug or may drive synthesis of similar, improved compounds. Keywords: ADMET; Docking; Farnesyltransferase Inhibitors; Malaria; Multivariate Image Analysis-QSAR 1. INTRODUCTION Malaria is a disease caused by parasites that are trans- mitted to humans via mosquito bites. Symptoms of ill- ness may include fever, headache, muscle pain, nausea, and vomiting. Malaria is still one of the most deadly dis- eases affecting third-world countries; it is estimated to cause around 300 million clinical cases and over one million deaths each year [1]. It is associated with the high morbidity and mortality, therefore, the control of malaria is globally a high priority task. Despite the discovery of artemisinin which has shown high antimalarial activity [2,3], there has been a con- tinuous interest for the search of new drugs [4] which are effective against the resistant Plasmodium falciparum. Few groups of potentially antimalarial drugs are used as chemotherapeutics such as quinoline derivatives [5], and simple sulfonamides [6]. Researchers are successively looking for new entities that have high potency against the malaria activity. Such ligands can be properly developed using QSAR (quanti- tative structure-activity relationship) methods. There have been some studies of 3D QSAR analysis of farne- syltransferase (FTase) inhibitors [7-9], which are also involved as promising compounds for the treatment of broad spectrum of cancers. Recently, Doerksen et al. [10] studied a highly diverse series of 192 Abbott-initiated imidazole-containing compounds and their FTase inhibi- tory activities using 3D-QSAR (CoMFA/CoMSIA) and docking. Naik et al. [11] have performed quantitative structure-activity relationship (QSAR) analysis on a data set of 194 artemisinin analogs for antimalarial activity. Prabhakar et al. [12] have performed QSAR of antima- larial activity of two distinct series of N1-(7-chloro-4- quinolyl)-1,4-bis(3-aminopropyl) piperazine analogues with DRAGON descriptors in order to rationalize their activity using CP-MLR (combinatorial protocol multiple linear regression) method. In this work, we used MIA-QSAR (multivariate image analysis applied to QSAR) method [13-18], a two di- mensional (2D) image-based approach which uses pixels of 2D chemical structures as descriptors (binaries). Such simple approach has shown to be a highly predictive tool. Also, the MIA-QSAR method presents the advantage of working well when equally simple, classical analysis fails. Moreover, the present QSAR analysis based on 2D Copyright © 2012 SciRes. OPEN ACCESS 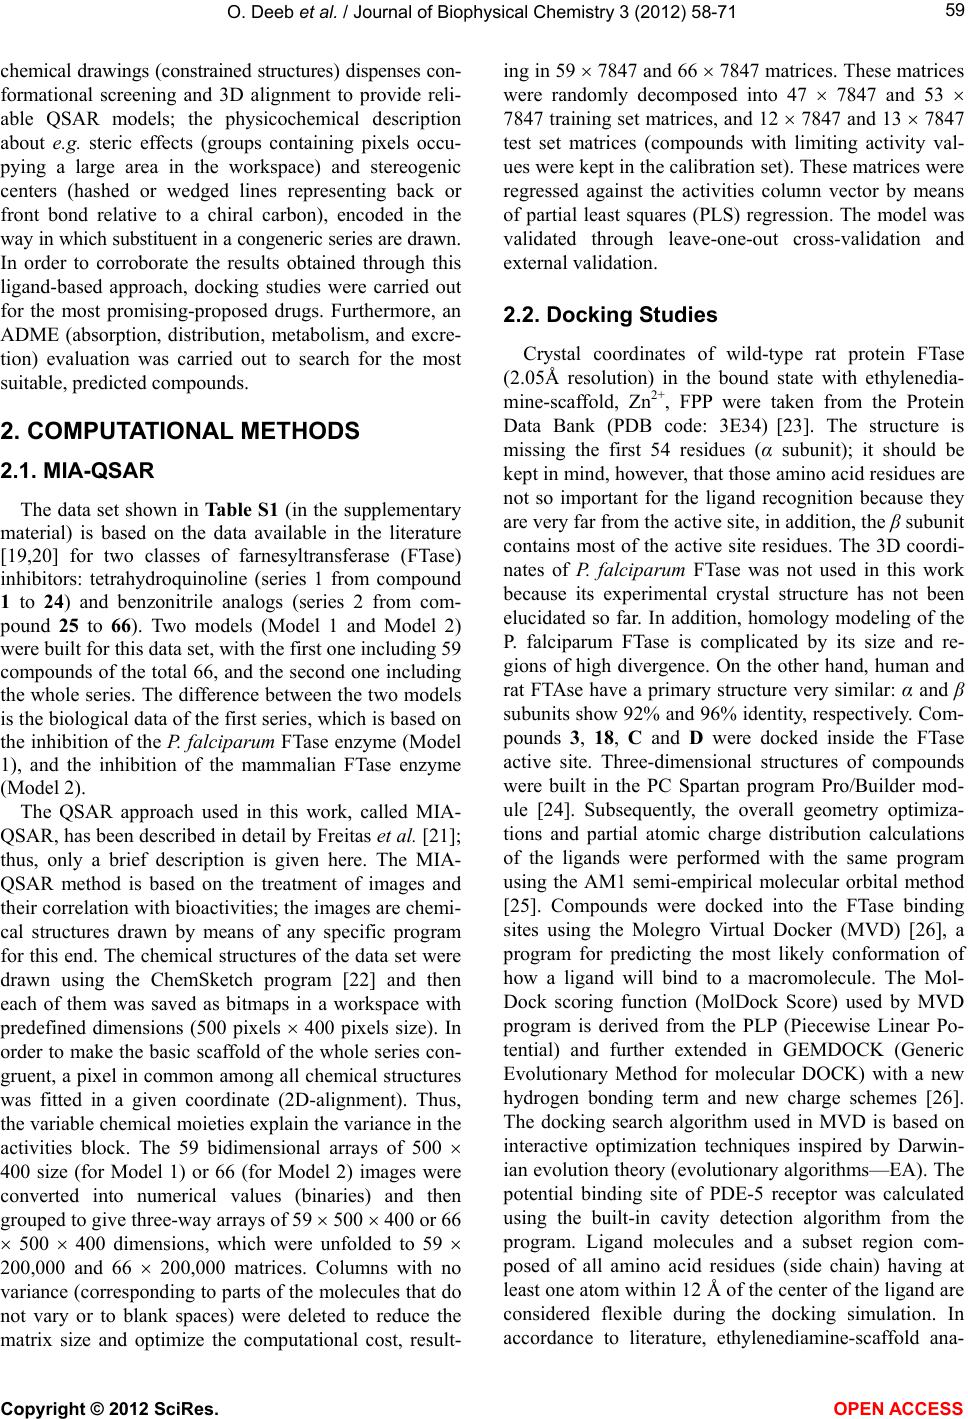 O. Deeb et al. / Journal of Biophysical Chemistry 3 (2012) 58-71 59 chemical drawings (constrained structures) dispenses con- formational screening and 3D alignment to provide reli- able QSAR models; the physicochemical description about e.g. steric effects (groups containing pixels occu- pying a large area in the workspace) and stereogenic centers (hashed or wedged lines representing back or front bond relative to a chiral carbon), encoded in the way in which substituent in a congeneric series are drawn. In order to corroborate the results obtained through this ligand-based approach, docking studies were carried out for the most promising-proposed drugs. Furthermore, an ADME (absorption, distribution, metabolism, and excre- tion) evaluation was carried out to search for the most suitable, predicted compounds. 2. COMPUTATIONAL METHODS 2.1. MIA-QSAR The data set shown in Table S1 (in the supplementary material) is based on the data available in the literature [19,20] for two classes of farnesyltransferase (FTase) inhibitors: tetrahydroquinoline (series 1 from compound 1 to 24) and benzonitrile analogs (series 2 from com- pound 25 to 66). Two models (Model 1 and Model 2) were built for this data set, with the first one including 59 compounds of the total 66, and the second one including the whole series. The difference between the two models is the biological data of the first series, which is based on the inhibition of the P. falciparum FTase enzyme (Model 1), and the inhibition of the mammalian FTase enzyme (Model 2). The QSAR approach used in this work, called MIA- QSAR, has been described in detail by Freitas et al. [21]; thus, only a brief description is given here. The MIA- QSAR method is based on the treatment of images and their correlation with bioactivities; the images are chemi- cal structures drawn by means of any specific program for this end. The chemical structures of the data set were drawn using the ChemSketch program [22] and then each of them was saved as bitmaps in a workspace with predefined dimensions (500 pixels 400 pixels size). In order to make the basic scaffold of the whole series con- gruent, a pixel in common among all chemical structures was fitted in a given coordinate (2D-alignment). Thus, the variable chemical moieties explain the variance in the activities block. The 59 bidimensional arrays of 500 400 size (for Model 1) or 66 (for Model 2) images were converted into numerical values (binaries) and then grouped to give three-way arrays of 59 500 400 or 66 500 400 dimensions, which were unfolded to 59 200,000 and 66 200,000 matrices. Columns with no variance (corresponding to parts of the molecules that do not vary or to blank spaces) were deleted to reduce the matrix size and optimize the computational cost, result- ing in 59 7847 and 66 7847 matrices. These matrices were randomly decomposed into 47 7847 and 53 7847 training set matrices, and 12 7847 and 13 7847 test set matrices (compounds with limiting activity val- ues were kept in the calibration set). These matrices were regressed against the activities column vector by means of partial least squares (PLS) regression. The model was validated through leave-one-out cross-validation and external validation. 2.2. Docking Studies Crystal coordinates of wild-type rat protein FTase (2.05Å resolution) in the bound state with ethylenedia- mine-scaffold, Zn2+, FPP were taken from the Protein Data Bank (PDB code: 3E34) [23]. The structure is missing the first 54 residues (α subunit); it should be kept in mind, however, that those amino acid residues are not so important for the ligand recognition because they are very far from the active site, in addition, the β subunit contains most of the active site residues. The 3D coordi- nates of P. falciparum FTase was not used in this work because its experimental crystal structure has not been elucidated so far. In addition, homology modeling of the P. falciparum FTase is complicated by its size and re- gions of high divergence. On the other hand, human and rat FTAse have a primary structure very similar: α and β subunits show 92% and 96% identity, respectively. Com- pounds 3, 18, C and D were docked inside the FTase active site. Three-dimensional structures of compounds were built in the PC Spartan program Pro/Builder mod- ule [24]. Subsequently, the overall geometry optimiza- tions and partial atomic charge distribution calculations of the ligands were performed with the same program using the AM1 semi-empirical molecular orbital method [25]. Compounds were docked into the FTase binding sites using the Molegro Virtual Docker (MVD) [26], a program for predicting the most likely conformation of how a ligand will bind to a macromolecule. The Mol- Dock scoring function (MolDock Score) used by MVD program is derived from the PLP (Piecewise Linear Po- tential) and further extended in GEMDOCK (Generic Evolutionary Method for molecular DOCK) with a new hydrogen bonding term and new charge schemes [26]. The docking search algorithm used in MVD is based on interactive optimization techniques inspired by Darwin- ian evolution theory (evolutionary algorithms—EA). The potential binding site of PDE-5 receptor was calculated using the built-in cavity detection algorithm from the program. Ligand molecules and a subset region com- posed of all amino acid residues (side chain) having at least one atom within 12 Å of the center of the ligand are considered flexible during the docking simulation. In accordance to literature, ethylenediamine-scaffold ana- Copyright © 2012 SciRes. OPEN ACCESS 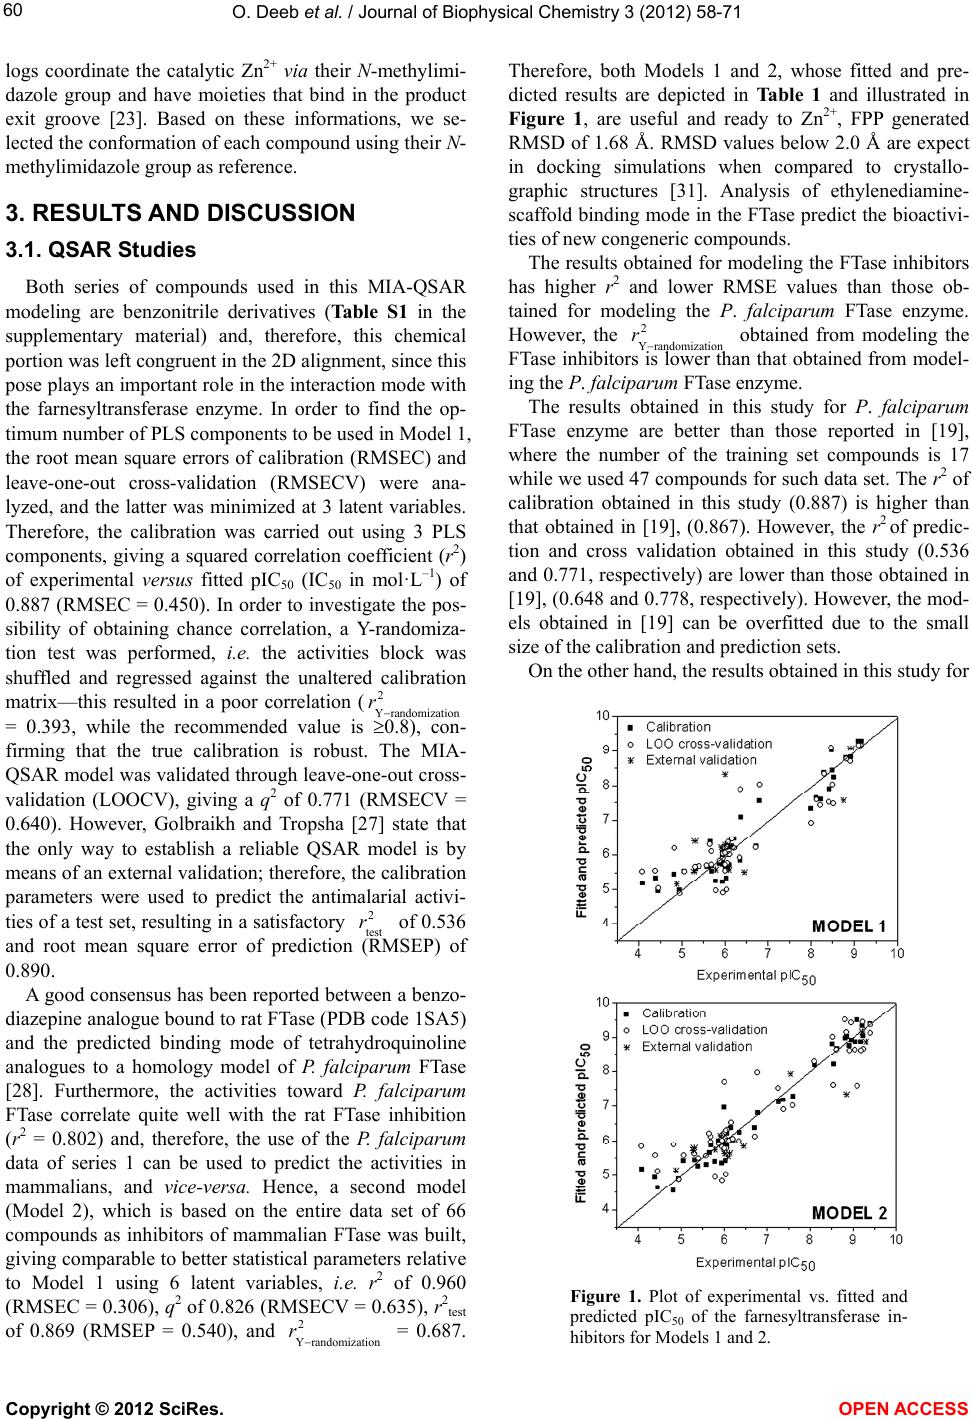 O. Deeb et al. / Journal of Biophysical Chemistry 3 (2012) 58-71 60 logs coordinate the catalytic Zn2+ via their N-methylimi- dazole group and have moieties that bind in the product exit groove [23]. Based on these informations, we se- lected the conformation of each compound using their N- methylimidazole group as reference. 3. RESULTS AND DISCUSSION 3.1. QSAR Studies Both series of compounds used in this MIA-QSAR modeling are benzonitrile derivatives (Table S1 in the supplementary material) and, therefore, this chemical portion was left congruent in the 2D alignment, since this pose plays an important role in the interaction mode with the farnesyltransferase enzyme. In order to find the op- timum number of PLS components to be used in Model 1, the root mean square errors of calibration (RMSEC) and leave-one-out cross-validation (RMSECV) were ana- lyzed, and the latter was minimized at 3 latent variables. Therefore, the calibration was carried out using 3 PLS components, giving a squared correlation coefficient (r2) of experimental versus fitted pIC50 (IC50 in mol·L–1) of 0.887 (RMSEC = 0.450). In order to investigate the pos- sibility of obtaining chance correlation, a Y-randomiza- tion test was performed, i.e. the activities block was shuffled and regressed against the unaltered calibration matrix—this resulted in a poor correlation (Yrandomization = 0.393, while the recommended value is 0.8), con- firming that the true calibration is robust. The MIA- QSAR model was validated through leave-one-out cross- validation (LOOCV), giving a q2 of 0.771 (RMSECV = 0.640). However, Golbraikh and Tropsha [27] state that the only way to establish a reliable QSAR model is by means of an external validation; therefore, the calibration parameters were used to predict the antimalarial activi- ties of a test set, resulting in a satisfactory test of 0.536 and root mean square error of prediction (RMSEP) of 0.890. 2 r 2 r A good consensus has been reported between a benzo- diazepine analogue bound to rat FTase (PDB code 1SA5) and the predicted binding mode of tetrahydroquinoline analogues to a homology model of P. falciparum FTase [28]. Furthermore, the activities toward P. falciparum FTase correlate quite well with the rat FTase inhibition (r2 = 0.802) and, therefore, the use of the P. falciparum data of series 1 can be used to predict the activities in mammalians, and vice-versa. Hence, a second model (Model 2), which is based on the entire data set of 66 compounds as inhibitors of mammalian FTase was built, giving comparable to better statistical parameters relative to Model 1 using 6 latent variables, i.e. r2 of 0.960 (RMSEC = 0.306), q2 of 0.826 (RMSECV = 0.635), r2test of 0.869 (RMSEP = 0.540), and = 0.687. Therefore, both Models 1 and 2, whose fitted and pre- dicted results are depicted in Table 1 and illustrated in Figure 1, are useful and ready to Zn2+, FPP generated RMSD of 1.68 Å. RMSD values below 2.0 Å are expect in docking simulations when compared to crystallo- graphic structures [31]. Analysis of ethylenediamine- scaffold binding mode in the FTase predict the bioactivi- ties of new congeneric compounds. 2 Y randomization r The results obtained for modeling the FTase inhibitors has higher r2 and lower RMSE values than those ob- tained for modeling the P. falciparum FTase enzyme. However, the Yrandomization obtained from modeling the FTase inhibitors is lower than that obtained from model- ing the P. falciparum FTase enzyme. 2 r The results obtained in this study for P. falciparum FTase enzyme are better than those reported in [19], where the number of the training set compounds is 17 while we used 47 compounds for such data set. The r2 of calibration obtained in this study (0.887) is higher than that obtained in [19], (0.867). However, the r2 of predic- tion and cross validation obtained in this study (0.536 and 0.771, respectively) are lower than those obtained in [19], (0.648 and 0.778, respectively). However, the mod- els obtained in [19] can be overfitted due to the small size of the calibration and prediction sets. On the other hand, the results obtained in this study for Figure 1. Plot of experimental vs. fitted and predicted pIC50 of the farnesyltransferase in- hibitors for Models 1 and 2. Copyright © 2012 SciRes. OPEN ACCESS  O. Deeb et al. / Journal of Biophysical Chemistry 3 (2012) 58-71 Copyright © 2012 SciRes. OPEN ACCESS 61 Table 1. Experimental, calibrated and predicted antimalarial activities (pIC50, IC50 in mol·L−1) for Models 1 and 2a. Cpd Model 1 Model 2 Exp. Fitted LOOCV Pred. Exp. Fitted LOOCV Pred. 1 8.92 8.81 8.68 9.05 8.86 8.62 2 9.16 9.27 9.15 9.22 9.32 9.45 3 9.10 9.27 9.16 9.40 9.38 9.36 4 8.82 8.79 8.76 8.92 8.74 8.61 5 8.92 9.07 9.22 9.15 6 8.47 9.01 9.10 8.82 8.97 9.51 7 8.50 8.44 8.02 8.96 8.91 9.42 8 6.00 8.32 7.55 7.92 9 8.42 7.91 7.52 8.55 8.19 7.61 10 8.52 8.24 7.48 9.10 9.49 7.58 11 6.36 7.09 7.89 6.78 6.79 7.97 12 8.00 7.33 6.92 7.26 7.12 7.53 13 8.75 7.57 8.85 7.35 14 8.22 7.59 7.43 7.60 7.29 7.01 15 6.80 7.56 8.03 6.00 6.95 7.69 16 8.12 7.64 7.57 7.38 7.18 6.90 17 8.30 8.36 8.33 8.10 8.18 8.27 18 9.40 9.40 9.11 19 8.62 8.66 8.63 20 8.52 8.79 9.00 21 9.24 9.03 8.65 22 9.30 8.86 23 8.85 9.01 9.13 24 9.19 8.86 8.61 25 5.05 5.54 5.52 5.05 5.40 5.57 26 6.09 5.57 6.09 5.53 27 5.95 6.07 5.90 5.95 5.91 5.82 28 5.88 5.77 5.84 5.88 6.00 5.91 29 6.02 6.20 6.22 6.02 6.03 6.09 30 6.06 5.74 6.01 6.06 5.96 6.01 31 6.45 5.50 6.45 5.85 32 6.06 5.62 5.76 6.06 5.85 5.77 33 5.95 5.93 6.02 5.95 5.98 6.01 34 6.16 6.25 6.44 6.16 6.37 6.52 35 6.01 5.66 5.72 6.01 5.89 5.71 36 5.92 6.21 5.92 6.15 37 6.07 6.21 6.37 6.07 6.22 6.32 38 5.95 5.73 6.04 5.95 6.02 6.15 39 6.00 5.72 6.06 6.00 6.11 6.24 40 5.95 5.22 4.91 5.95 5.35 4.85 41 4.45 4.95 5.04 4.45 4.63 5.10 42 4.95 4.98 4.88 4.95 4.91 4.88 43 4.88 5.16 4.88 5.13 44 5.79 5.25 4.98 5.79 5.38 4.96 45 5.69 5.55 5.72 5.69 5.94 5.97 46 6.01 5.58 5.54 6.01 6.03 5.78 47 6.35 5.85 5.92 6.35 6.25 5.99 48 6.11 5.72 6.01 6.11 5.98 6.02 49 5.95 5.85 6.20 5.95 5.97 6.17 50 5.69 5.70 6.10 5.69 5.86 6.13 51 5.79 5.58 5.79 5.74 52 5.39 5.67 5.67 5.39 5.26 5.49 53 4.82 5.45 6.18 4.82 4.54 5.89 54 6.00 6.28 6.00 5.63 55 5.58 5.67 5.70 5.58 5.31 5.55 56 6.21 6.46 6.20 6.21 6.02 6.07 57 5.65 6.38 6.31 5.65 5.65 6.22 58 6.12 6.22 6.12 5.65 59 5.31 5.60 5.66 5.31 5.43 5.62 60 6.04 5.33 4.99 6.04 5.41 5.02 61 5.28 5.52 5.28 5.72 62 6.72 6.25 6.20 6.72 6.38 6.12 63 4.39 5.33 5.55 4.39 4.94 5.56 64 4.08 5.19 5.53 4.08 5.17 5.85 65 6.05 6.32 6.23 6.05 6.00 6.31 66 5.30 6.39 5.30 5.80 aFitted and LOOCV refer to calibrated and cross-validated data for the training set, and the Pred. values are referred to the external validation compounds. There is no available experimental data (inhibition of P. falciparum FTase) in Model 1 for compounds 18 - 24. 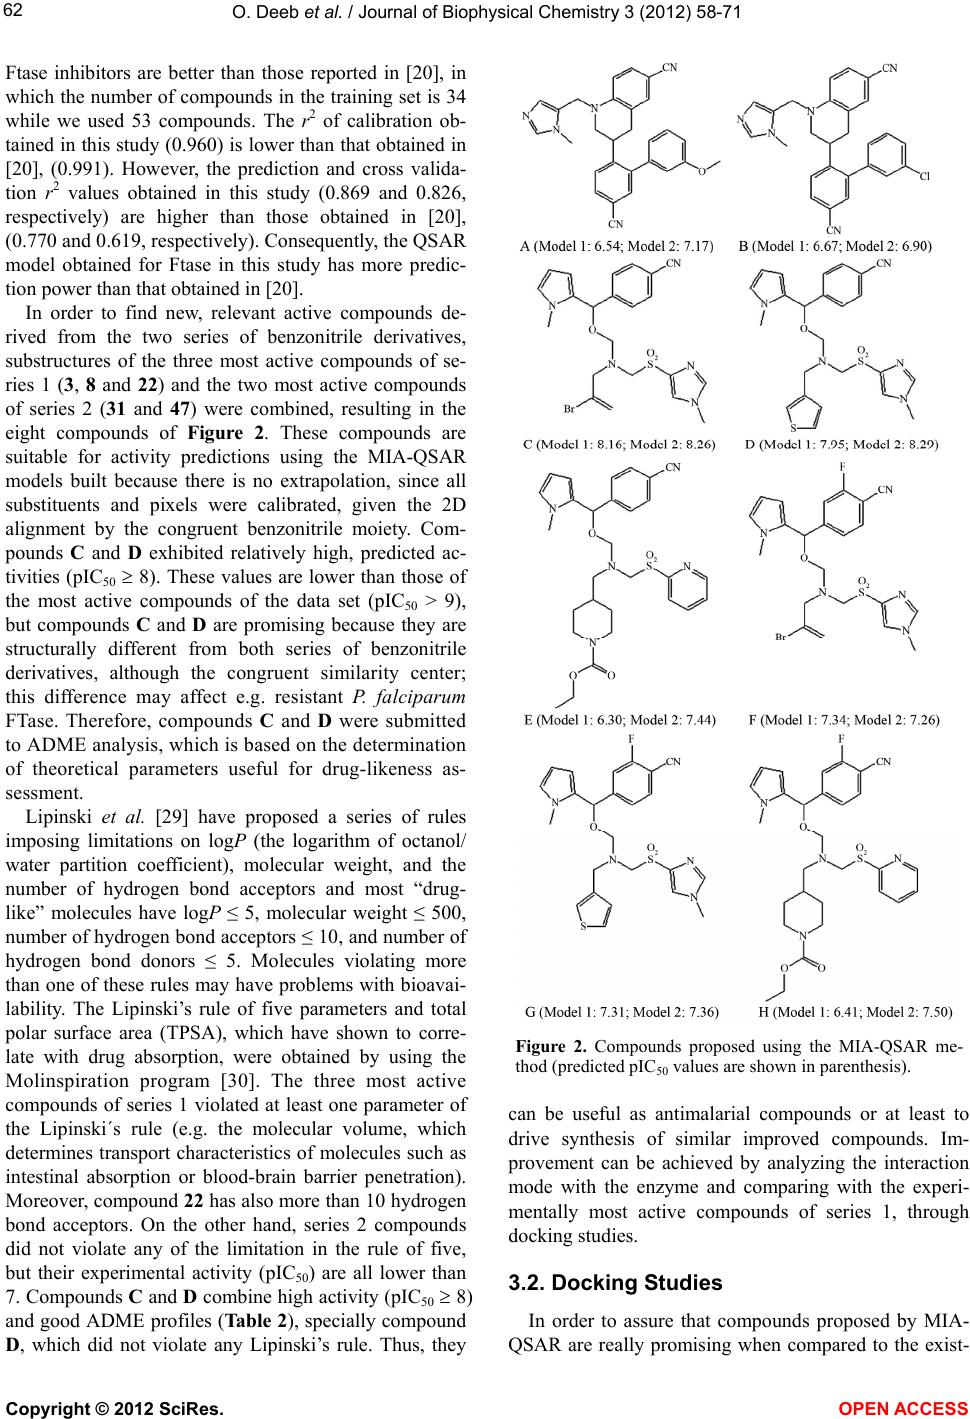 O. Deeb et al. / Journal of Biophysical Chemistry 3 (2012) 58-71 62 Ftase inhibitors are better than those reported in [20], in which the number of compounds in the training set is 34 while we used 53 compounds. The r2 of calibration ob- tained in this study (0.960) is lower than that obtained in [20], (0.991). However, the prediction and cross valida- tion r2 values obtained in this study (0.869 and 0.826, respectively) are higher than those obtained in [20], (0.770 and 0.619, respectively). Consequently, the QSAR model obtained for Ftase in this study has more predic- tion power than that obtained in [20]. In order to find new, relevant active compounds de- rived from the two series of benzonitrile derivatives, substructures of the three most active compounds of se- ries 1 (3, 8 and 22) and the two most active compounds of series 2 (31 and 47) were combined, resulting in the eight compounds of Figure 2. These compounds are suitable for activity predictions using the MIA-QSAR models built because there is no extrapolation, since all substituents and pixels were calibrated, given the 2D alignment by the congruent benzonitrile moiety. Com- pounds C and D exhibited relatively high, predicted ac- tivities (pIC50 8). These values are lower than those of the most active compounds of the data set (pIC50 > 9), but compounds C and D are promising because they are structurally different from both series of benzonitrile derivatives, although the congruent similarity center; this difference may affect e.g. resistant P. falciparum FTase. Therefore, compounds C and D were submitted to ADME analysis, which is based on the determination of theoretical parameters useful for drug-likeness as- sessment. Lipinski et al. [29] have proposed a series of rules imposing limitations on logP (the logarithm of octanol/ water partition coefficient), molecular weight, and the number of hydrogen bond acceptors and most “drug- like” molecules have logP ≤ 5, molecular weight ≤ 500, number of hydrogen bond acceptors ≤ 10, and number of hydrogen bond donors ≤ 5. Molecules violating more than one of these rules may have problems with bioavai- lability. The Lipinski’s rule of five parameters and total polar surface area (TPSA), which have shown to corre- late with drug absorption, were obtained by using the Molinspiration program [30]. The three most active compounds of series 1 violated at least one parameter of the Lipinski´s rule (e.g. the molecular volume, which determines transport characteristics of molecules such as intestinal absorption or blood-brain barrier penetration). Moreover, compound 22 has also more than 10 hydrogen bond acceptors. On the other hand, series 2 compounds did not violate any of the limitation in the rule of five, but their experimental activity (pIC50) are all lower than 7. Compounds C and D combine high activity (pIC50 8) and good ADME profiles (Table 2), specially compound D, which did not violate any Lipinski’s rule. Thus, they Figure 2. Compounds proposed using the MIA-QSAR me- thod (predicted pIC50 values are shown in parenthesis). can be useful as antimalarial compounds or at least to drive synthesis of similar improved compounds. Im- provement can be achieved by analyzing the interaction mode with the enzyme and comparing with the experi- mentally most active compounds of series 1, through docking studies. 3.2. Docking Studies In order to assure that compounds proposed by MIA- SAR are really promising when compared to the exist- Q Copyright © 2012 SciRes. OPEN ACCESS  O. Deeb et al. / Journal of Biophysical Chemistry 3 (2012) 58-71 63 Table 2. Lipinski’s rule of five and other parameters useful for ADME analysisb, for the most promising proposed compounds (C and D) and most active derivatives of series 1 and 2. Cpd pIC50 logP TPSA natomsMW nON nOHNHnrotb MV Nviolations 3 9.40 (exp.) 1.01 100.06 34 544.48 9 0 8 431.87 1 18 9.40 (exp.) 0.88 100.06 36 521.67 9 0 8 448.38 1 22 9.30 (exp.) 2.07 124.67 42 591.74 11 0 10 531.64 2 31 6.45 (exp.) 3.79 83.88 33 434.50 6 0 7 397.92 0 47 6.35 (exp.) 4.50 74.64 33 456.91 5 0 6 390.84 0 C 8.26 (pred.) 1.07 106.06 32 519.43 9 0 10 405.31 1 D 8.29 (pred.) 0.95 106.06 34 496.62 9 0 10 421.82 0 blogP = logarithm of the octanol/water partition coefficient; TPSA = topological polar surface area; natoms = number of atoms; MW = molecular weight; nON = number of hydrogen bond acceptors; nOHNH = number of hydrogen bond donors; nrotb = number of rotatable bonds; MV = molecular volume; nviolations = number of violations of the Lipinski’s rule of five. ing prototypes (compounds 3 and 8), as well as to under- stand their mode of interaction with FTase, docking studies for 3, 18, C and D were carried out. The potential binding sites of FTase were calculated and a cavity of 969.0 A3 (surface = 1993.0 A2) was observed close to Tyr365B, His362B, Tyr361β, Phe360β, Asp359β, Trp303β, Tyr300β, Cys299β, Asp297β, Tyr251β, His258β, Arg202β, Tyr154β, Trp102β, Leu96β, Cys95β, Tyr93β, Ala92β, His201α, Tyr166α, Asn165α and Lys154α. The β subunit contains most of the substrate-binding residues and is partially enveloped by the crescent shaped α subunit. After docking calculations, the binding orientations of compounds 3, 18, C and D into the active site were pre- dicted and the following parameters (see Table 3) were then calculated: a) energy score values used during docking; b) total interaction energy between ligand and FTase enzyme; and c) internal energy values of the ligands. The structures of the four compounds are shown in Figure 3. Hydrogen bonding was observed between the FTase and the four compounds: compound C inter- acted with Tyr365β and Tyr361β; compound D interacted with Tyr361β, Cys299β and Arg202β compounds 3 and 18 interacted with Tyr300β. There is a residue, namely Tyr361β, potentially capable of providing specific cation- interaction, therefore stabilizing the complex between FTase and the four compounds. In addition, all Table 3. Estimated energy score values used for the evaluation of docking poses; total interaction energy values between the pose and the target molecule; and internal energy of the ligand (energies in kcal·mol−1). Cpd pIC50 Escore Einteraction Einternal 3 9.40 (exp.) −161.8 −148.9 −12.9 18 9.40 (exp.) −164.1 −155.4 −8.7 C 8.26 (pred.) −155.1 −148.2 −6.9 D 8.29 (pred.) −144.6 −142.4 −2.2 four compounds presented a methylimidazole ring close to the zinc cation (electrostatic interactions). However, the methylimidazole ring of compounds 3 and 18 also interacted with Tyr300B in contrast to compounds C and D. This fact can, in principle, justify the high experi- mental potencies of the two available compounds, which are congruent with the QSAR results. However, the best results in the ADME evaluation for compound D and the necessity of new drugs against resistant strains make the proposed compounds as interesting targets for synthesis and future biological tests. The assessment of docking accuracy often called “re- docking” is essentially a validation procedure to check whether the molecular docking algorithm is able to re- cover the crystallographic position of ligand using com- puter simulation. In this work, re-docking simulation of the crystal structure of ethylenediamine-scaffold in the FTase active site in complex with, Zn2+, FPP generated RMSD of 1.68 Å. RMSD values below 2.0 Å are expect in docking simulations when compared to crystallo- graphic structures [31]. Analysis of ethylenediamine- scaffold binding mode in the FTase active site has been reported [31] and the binding pocket consists of residues Asp359β, Phe360β, Try93β, Leu96β, and W106β. Fur- thermore, the N-methylimidazole moieties coordinates the catalytic Zn2+ similarly to compounds 3, 18, C and D as previously discussed. 4. CONCLUSION MIA-QSAR was capable of providing predictive models which are useful to predict bioactivities of novel drug-like compounds against malaria. The proposed compounds have substructures contemplated in calibra- tion and, therefore, the modeling of their activities is reliable. Hydrogen bond between a couple of proposed substrates, namely C and D, in addition to interactions nvolving the zinc cation present in the active site, ex- i Copyright © 2012 SciRes. OPEN ACCESS  O. Deeb et al. / Journal of Biophysical Chemistry 3 (2012) 58-71 64 Figure 3. Docking poses for the four compounds analyzed (3, 18, C and D). plain the high affinity of these ligands to the FTase en- zyme. After exploratory ADME evaluation, compound D is suggested as improved drug-like compound. 5. ACKNOWLEDGEMENTS FAPEMIG is gratefully acknowledged for the financial support of this research, as is CNPq for the fellowships (to M.P.F., E.F.F.C. and T.C.R.). REFERENCES [1] US Global Health Policy. http://www.globalhealthfacts.org [2] Li, Y., Zhu, Y.-M., Jiang, H.-J., Pan, J.-P., Wu, G.-S., Wu, J.-M., Shi, Y.-L., Yang, Y.-L. and Wu, B.A. (2000) Syn- thesis and antimalarial activity of artemisinin derivatives containing an amino group. Journal of Medicinal Chem- istry, 43, 1635-1640. doi:10.1021/jm990552w [3] Mekonnen, B., Weiss, E., Katz, E., Ma, J., Ziffer, H. and Kyle, D.E. (2000) Synthesis and antimalarial activities of base-catalyzed adducts of 11-azaartemisinin. Bioorganic & Medicinal Chemistry, 8, 1111-1116. doi:10.1016/S0968-0896(00)00049-3 [4] Winstanley, P.A. (2000) Chemotherapy for falciparum malaria: The armoury, the problems and the prospects. Parasitology Today, 16, 146-153. doi:10.1016/S0169-4758(99)01622-1 [5] Coy, D.F. (2004) Ferriprotoporphyrin IX, phospholipids, and the antimalarial actions of quinoline drugs. Life Sci- ences, 74, 1957-1972. doi:10.1016/j.lfs.2003.10.003 [6] Agarwal, A., Srivastava, K., Puri, S. and Chauhan, P. (2005) Antimalarial activity of 2,4,6-trisubstituted pyri- midines. Bioorganic & Medicinal Chemistry Letters, 15, 1881-1883. [7] Equbal, T., Silakari, O. and Ravikumar, M. (2008) Ex- ploring three-dimensional quantitative structural activity relationship (3D-QSAR) analysis of SCH 66336 (Sarasar) analogues of farnesyltransferase inhibitors. European Jour- nal of Medicinal Chemistry, 43, 204-209. doi:10.1016/j.ejmech.2007.02.013 [8] Puntambekar, D.S., Giridhar, R. and Yadav, M.R. (2008) Insights into the structural requirements of farnesyltrans- ferase inhibitors as potential anti-tumor agents based on 3D-QSAR CoMFA and CoMSIA models. European Jour- nal of Medicinal Chemistry, 43, 142-154. doi:10.1016/j.ejmech.2007.02.003 [9] Xie, A., Sivaprakasam, P. and Doerksen, R.J. (2006) 3D- QSAR analysis of antimalarial farnesyltransferase inhibi- tors based on a 2,5-diaminobenzophenone scaffold. Bio- organic & Medicinal Chemistry, 14, 7311-7323. doi:10.1016/j.bmc.2006.06.041 [10] Xie, A., Odde S. and Prasanna, R.J. (2009) Doerksen, Imidazole-containing farnesyltransferase inhibitors: 3D quantitative structure-activity relationships and molecular docking. Journal of Computer-Aided Molecular Design, 23, 431-448. doi:10.1007/s10822-009-9278-z [11] Srivastava, M., Singh, H. and Naik, P.K. (2009) Quantita- tive structure-activity relationship (QSAR) of the ar- Copyright © 2012 SciRes. OPEN ACCESS  O. Deeb et al. / Journal of Biophysical Chemistry 3 (2012) 58-71 65 temisinin: The development of predictive in vitro antima- larial activity model. Journal of Chemometrics, 23, 618- 635. [12] Deshpande, S., Solomon, V.R., Katti, S.B. and Prabhakar, Y.S. (2009) Topological descriptors in modelling antima- larial activity: N(1)-(7-chloro-4-quinolyl)-1,4-bis(3-amino- propyl) piperazine as prototype. Journal of Enzyme Inhi- bition and Medicinal Chemistry, 24, 94-104. doi:10.1080/14756360801915377 [13] Freitas, M.P., Brown, S.D. and Martins, J.A. (2005) MIA- QSAR: A simple 2D image-based approach for quantita- tive structure-activity relationship analysis. Journal of Mo- lecular Structure, 738, 149-154. doi:10.1016/j.molstruc.2004.11.065 [14] Freitas, M.P. (2006) MIA-QSAR modelling of anti-HIV-1 activities of some 2-amino-6-arylsulfonylbenzonitriles and their thio and sulfinyl congeners. Organic & Biomolecular Chemistry, 4, 1154-1159. doi:10.1039/b516396j [15] Freitas, M.P. (2007) Multivariate QSAR: From classical descriptors to new perspectives. Current Computer-Aided Drug Design, 3, 235-239. [16] Freitas, M.P. (2008) Multivariate image analysis applied to QSAR: Evaluation to a series of potential anxiolytic agents. Chemometrics and Intelligent Laboratory Systems, 91, 173-176. doi:10.1016/j.chemolab.2007.11.002 [17] Pinheiro, J.R., Bitencourt, M., da Cunha, E.F.F., Ramalho, T.C. and Freitas, M.P. (2008) Novel anti-HIV cyclotri- azadisulfonamide derivatives as modeled by ligand- and receptor-based approaches. Bioorganic & Medicinal Che- mistry, 16, 1683-1690. doi:10.1016/j.bmc.2007.11.020 [18] Goodarzi, M. and Freitas, M.P. (2010) MIA-QSAR mod- elling of activities of a series of AZT analogues: Bi- and multilinear PLS regression. Molecular Simulation, 36, 267-272. doi:10.1080/08927020903278001 [19] Gupta, M.K. and Prabhakar, Y.S. (2008) QSAR study on tetrahydroquinoline analogues as plasmodium protein far- nesyltransferase inhibitors: A comparison of rationales of malarial and mammalian enzyme inhibitory activities for selectivity. European Journal of Medicinal Chemistry, 43, 2751-2767. doi:10.1016/j.ejmech.2008.01.025 [20] Puntambekar, D., Giridhar, R. and Yadav, M.R. (2006) 3D-QSAR studies of farnesyl transferase Inhibitors: A comparative molecular field analysis approach. Bioorganic & Medicinal Chemistry Letters, 16, 1821-1827. doi:10.1016/j.bmcl.2006.01.019 [21] Freitas, M.P., Da Cunha, E.F.F., Ramalho, T.C. and Good- arzi, M. (2008) Multimode methods applied on MIA de- scriptors in QSAR. Current Computer-Aided Drug De- sign, 4, 273-282. [22] ACD/ChemSketch (2009) Version 12.01, Advanced Che- mistry Development, Inc., Toronto. [23] Hast, M.A., Fletcher, S., Cummings, C.G., Pusateri, E.E., Blaskovich, M.A., Rivas, K., Gelb, M.H., Van Voorhis, W.C., Sebti, S.M., Hamilton, A.D. and Beese, L.S. (2009) Structural basis for binding and selectivity of antimalarial and anticancer ethylenediamine inhibitors to protein far- nesyltransferase. Chemistry & Biology, 16, 181-192. doi:10.1016/j.chembiol.2009.01.014 [24] SpartanPro 1.0.1 Wavefunction, (Irvine, 2001). [25] Dewar, M.J.S., Zoebisch, E.G., Healy, E.F. and Stewart, J.J.P. (1985) Development and use of quantum mechani- cal molecular models. 76. AM1: A new general purpose quantum mechanical molecular model. Journal of the American Chemical Society, 107, 3902-3909. doi:10.1021/ja00299a024 [26] Thomsen, R. and Christensen, M.H. (2006) MolDock: A new technique for highaccuracy molecular docking. Jour- nal of Medicinal Chemistry, 49, 3315-3321. doi:10.1021/jm051197e [27] Golbraikh, A. and Tropsha, A. (2002) Beware of q2! Journal of Molecular Graphics and Modelling, 20, 269- 276. doi:10.1016/S1093-3263(01)00123-1 [28] Eastman, R.T., White, J., Hucke, O., Bauer, K., Yoko- yama, K., Nallan, L., Chakrabarti, D., Verlinde, C.L., Gelb, M.H., Rathod, P.K. and Van Voorhis, W.C. (2005) Resistance to a protein farnesyltransferase inhibitor in Plasmodium falciparum. Journal of Biological Chemistry, 280, 13554-13559. doi:10.1074/jbc.M413556200 [29] Lipinski, C.A., Lombardo, F., Dominy, B.W. and Feeney, P.J. (1997) Experimental and computational approaches to estimate solubility and permeability in drug discovery and development settings. Advanced Drug Delivery Re- views, 23, 3-25. doi:10.1016/S0169-409X(96)00423-1 [30] Molinspiration Cheminformatics, Bratislava, Slovak Re- public. http://www.molinspiration.com [31] Friesner, R.A., Banks, J.L., Murphy, R.B., Halgren, T.A., Klicic, J.J., Mainz, D.T., Repasky, M.P., Knoll, E.H., Shaw, D.E., Shelley, M., Perry, J.K., Francis, P. and Shen- kin, P.S.A. (2004) New approach for rapid, accurate do- cking and scoring. 1. Method and assessment of docking accuracy. Journal of Medicinal Chemistry, 47, 1739- 1749. doi:10.1021/jm0306430 Copyright © 2012 SciRes. OPEN ACCESS 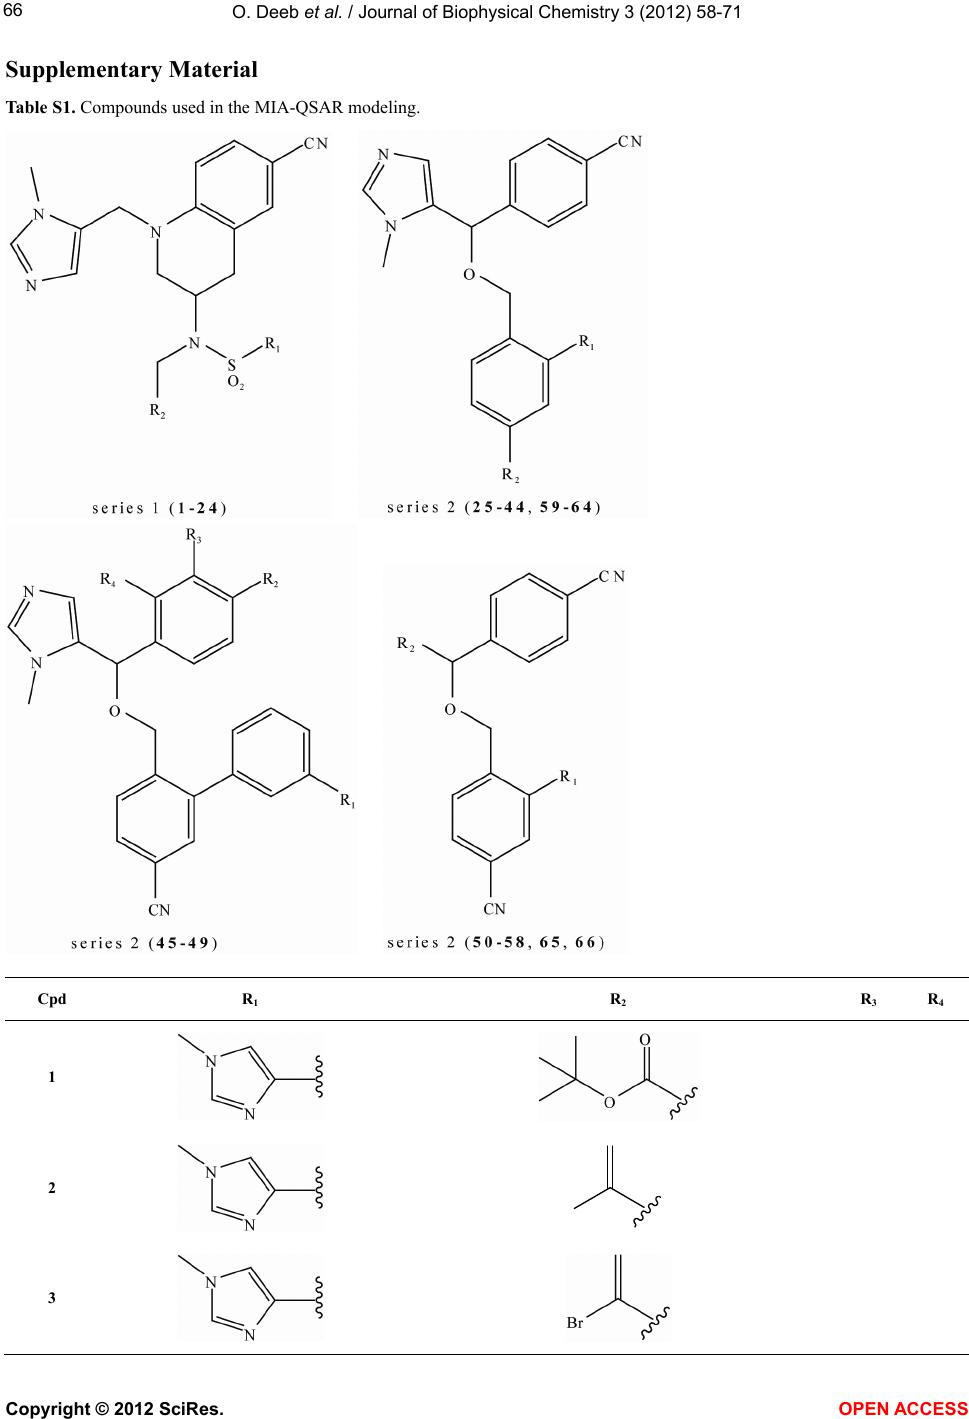 O. Deeb et al. / Journal of Biophysical Chemistry 3 (2012) 58-71 66 Supplementary Material Table S1. Compounds used in the MIA-QSAR modeling. Cpd R1 R 2 R 3 R 4 1 2 3 Copyright © 2012 SciRes. OPEN ACCESS 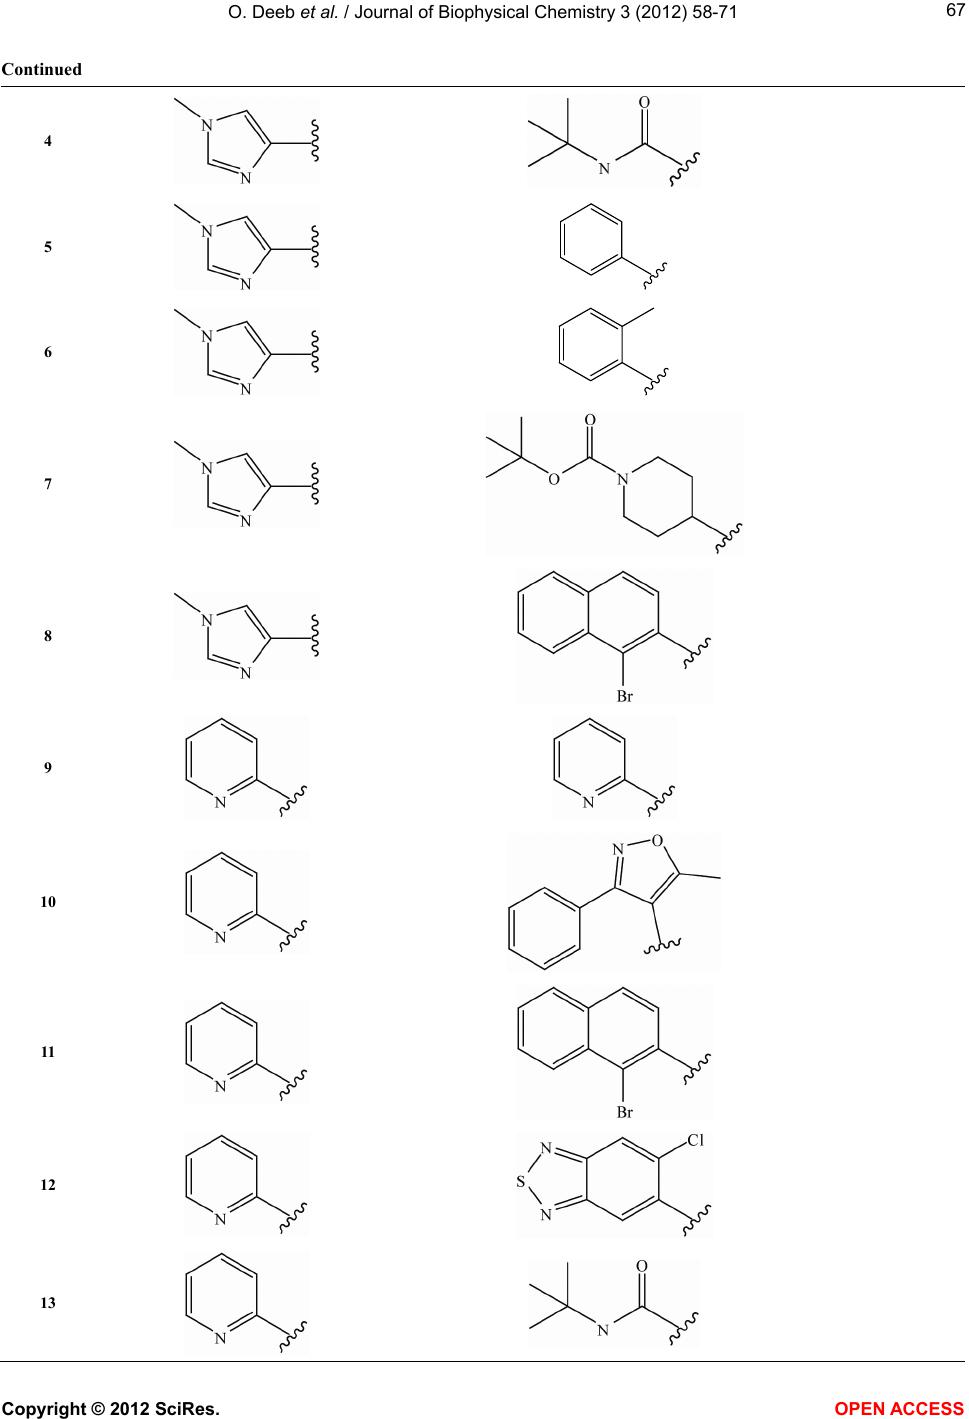 O. Deeb et al. / Journal of Biophysical Chemistry 3 (2012) 58-71 67 Continued 4 5 6 7 8 9 10 11 12 13 Copyright © 2012 SciRes. OPEN ACCESS 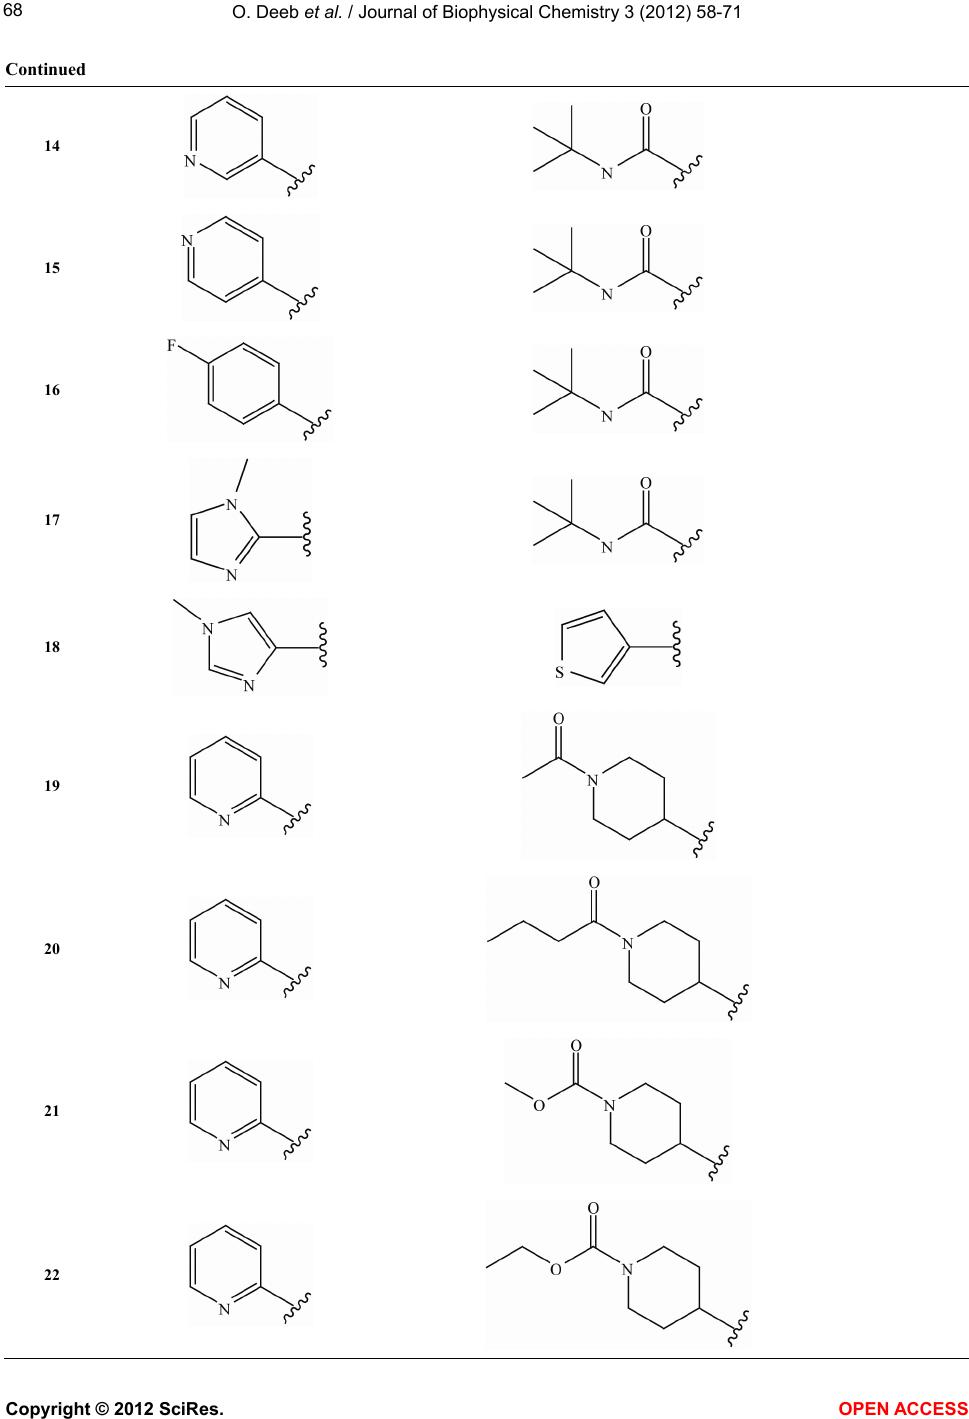 O. Deeb et al. / Journal of Biophysical Chemistry 3 (2012) 58-71 68 Continued 14 15 16 17 18 19 20 21 22 Copyright © 2012 SciRes. OPEN ACCESS 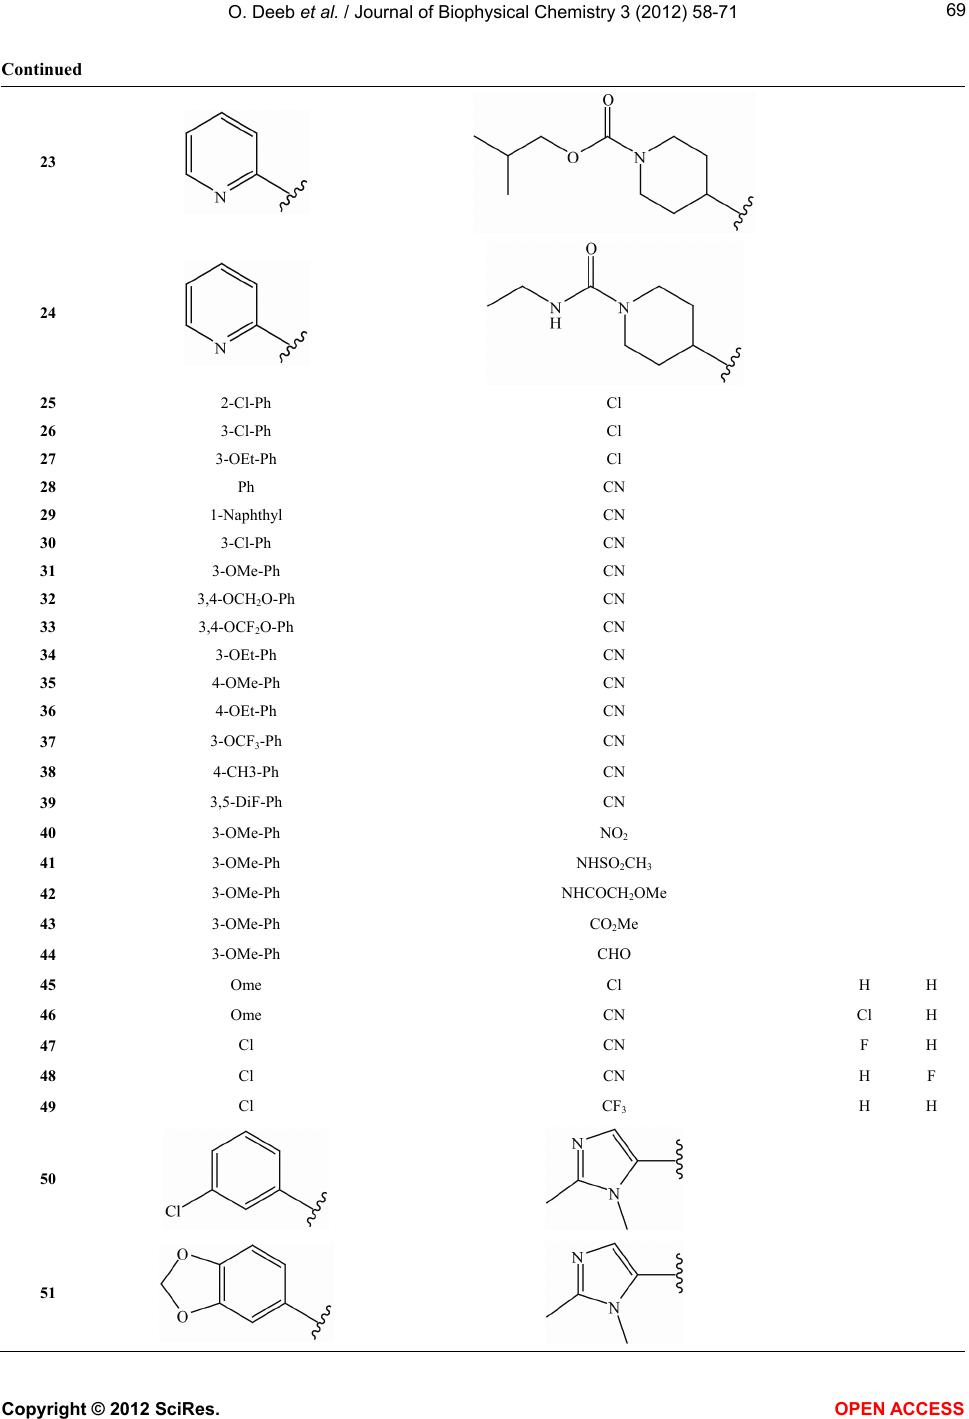 O. Deeb et al. / Journal of Biophysical Chemistry 3 (2012) 58-71 69 Continued 23 24 25 2-Cl-Ph Cl 26 3-Cl-Ph Cl 27 3-OEt-Ph Cl 28 Ph CN 29 1-Naphthyl CN 30 3-Cl-Ph CN 31 3-OMe-Ph CN 32 3,4-OCH2O-Ph CN 33 3,4-OCF2O-Ph CN 34 3-OEt-Ph CN 35 4-OMe-Ph CN 36 4-OEt-Ph CN 37 3-OCF3-Ph CN 38 4-CH3-Ph CN 39 3,5-DiF-Ph CN 40 3-OMe-Ph NO2 41 3-OMe-Ph NHSO2CH3 42 3-OMe-Ph NHCOCH2OMe 43 3-OMe-Ph CO2Me 44 3-OMe-Ph CHO 45 Ome Cl H H 46 Ome CN Cl H 47 Cl CN F H 48 Cl CN H F 49 Cl CF3 H H 50 51 Copyright © 2012 SciRes. OPEN ACCESS 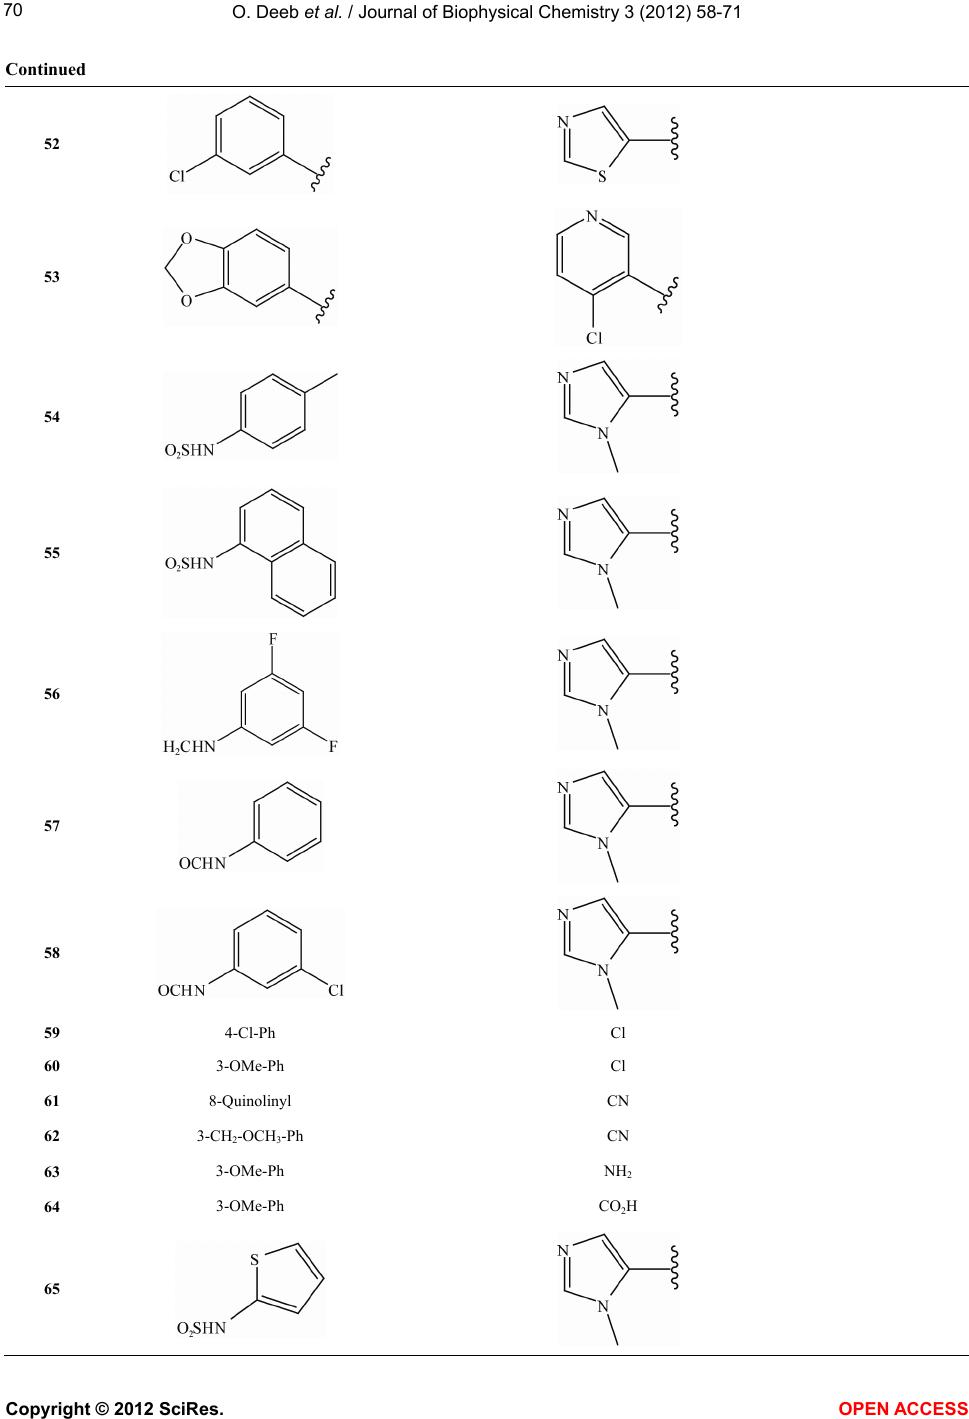 O. Deeb et al. / Journal of Biophysical Chemistry 3 (2012) 58-71 70 Continued 52 53 54 55 56 57 58 59 4-Cl-Ph Cl 60 3-OMe-Ph Cl 61 8-Quinolinyl CN 62 3-CH2-OCH3-Ph CN 63 3-OMe-Ph NH2 64 3-OMe-Ph CO2H 65 Copyright © 2012 SciRes. OPEN ACCESS 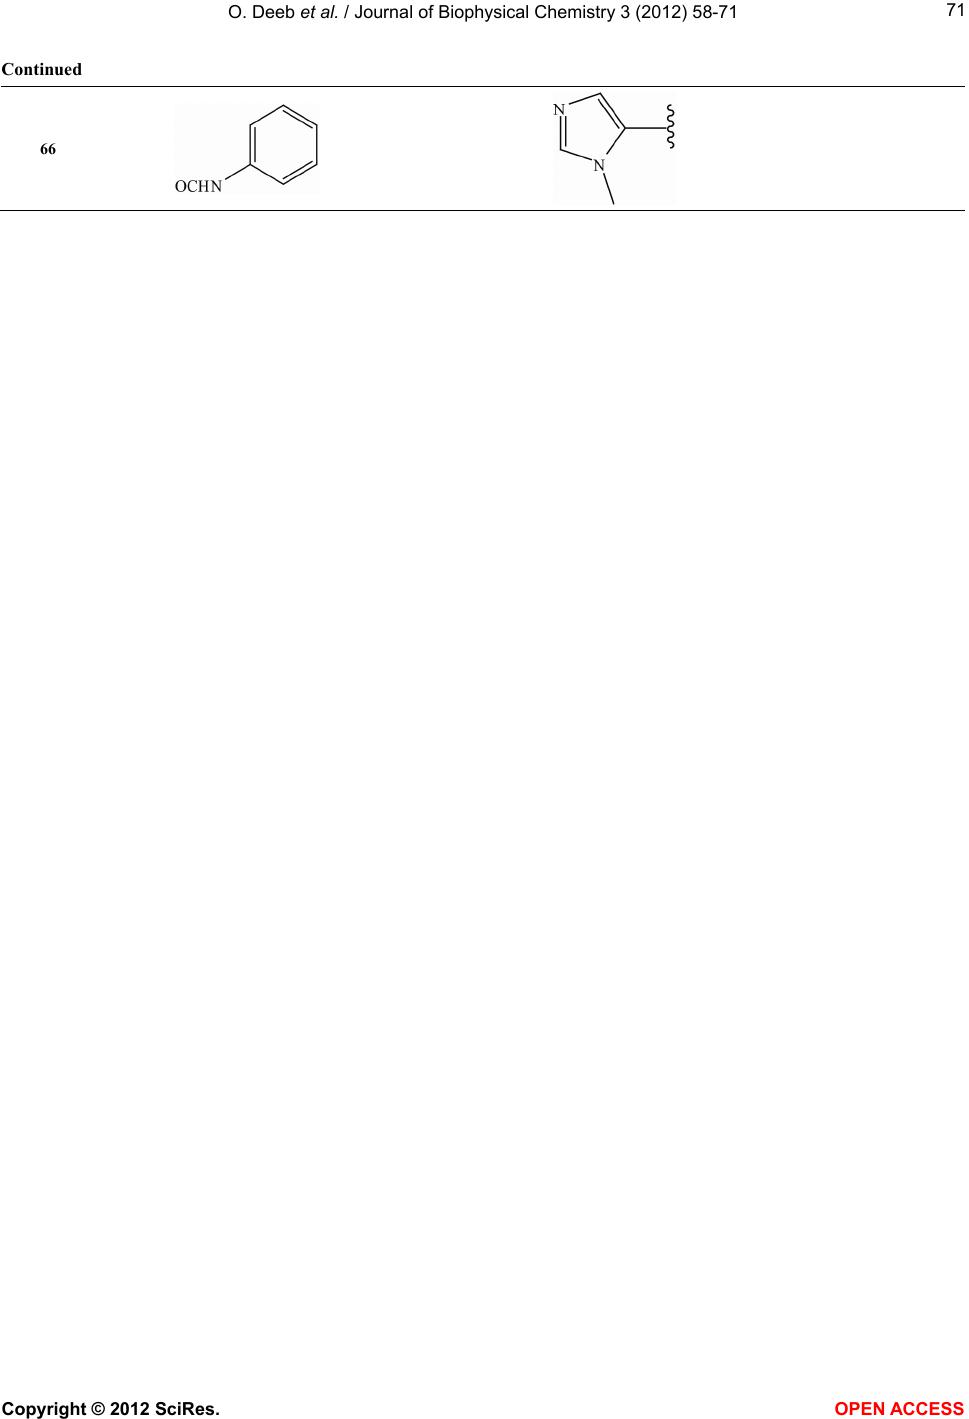 O. Deeb et al. / Journal of Biophysical Chemistry 3 (2012) 58-71 Copyright © 2012 SciRes. 71 Continued 66 OPEN ACCESS
|