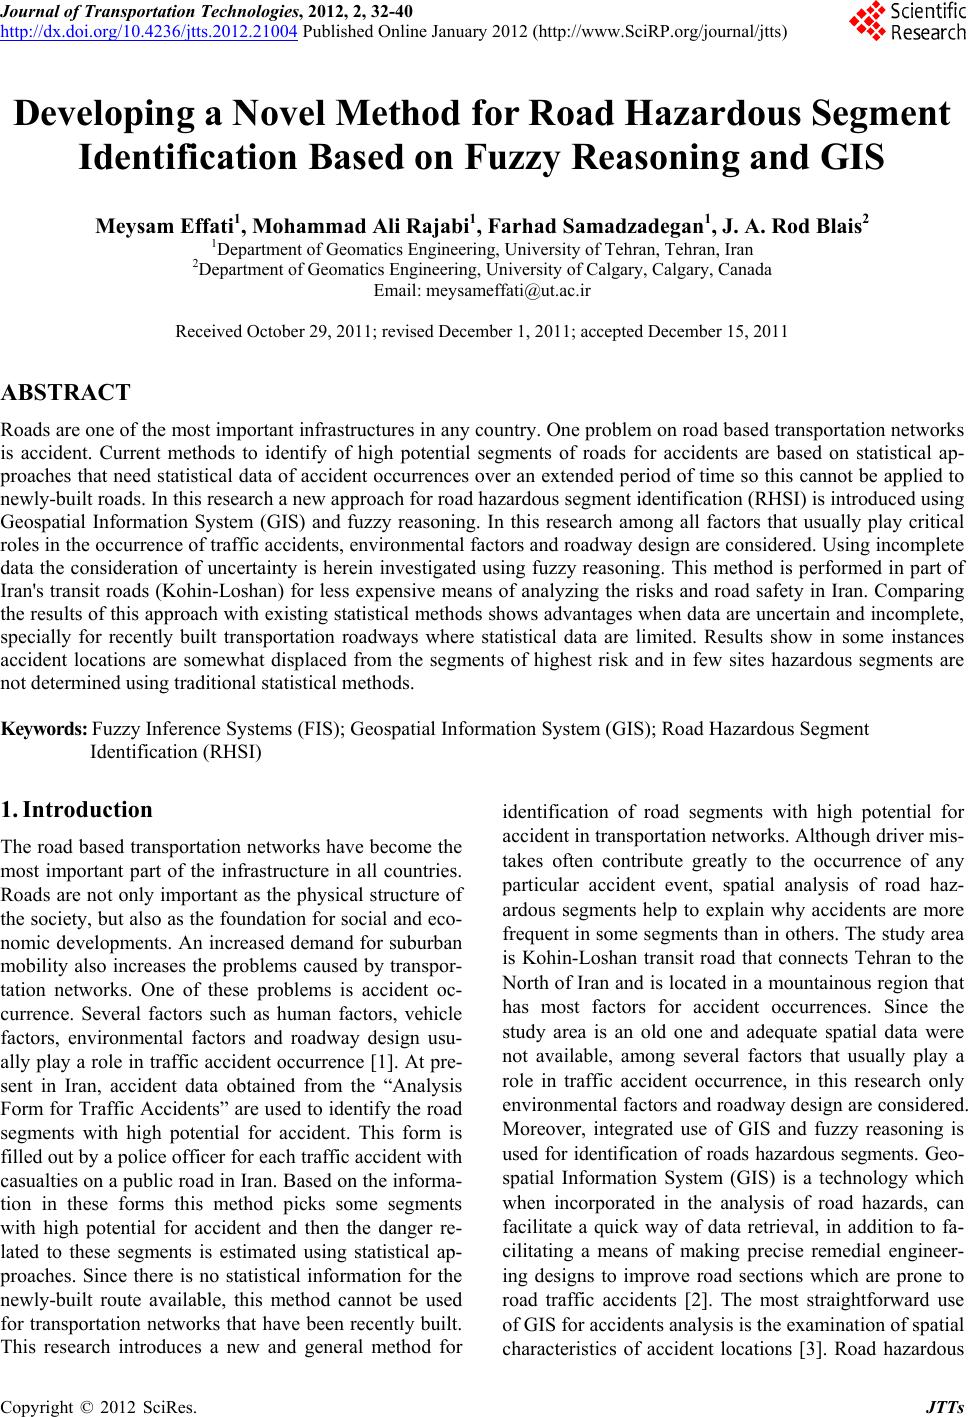
 Journal of Transportation Technologies, 2012, 2, 32-40 http://dx.doi.org/10.4236/jtts.2012.21004 Published Online January 2012 (http://www.SciRP.org/journal/jtts) Developing a Novel Method for Road Hazardous Segment Identification Based on Fuzzy Reasoning and GIS Meysam Effati1, Mohammad Ali Rajabi1, Farhad Samadzadegan1, J. A. Rod Blais2 1Department of Geomatics Engin eer ing, University of Tehran, Tehran, Iran 2Department of Geomatics Engineering, University of Calgary, Calgary, Canada Email: meysameffati@ut.ac.ir Received October 29, 2011; revised December 1, 2011; accepted December 15, 2011 ABSTRACT Roads are one of the most important infrastructures in an y countr y. One prob lem on road based transportation networks is accident. Current methods to identify of high potential segments of roads for accidents are based on statistical ap- proaches that need statistical data of accident occurrences over an extended period of time so this cannot be applied to newly-built roads. In this research a new approach for road hazardous segment iden tification (RHSI) is introdu ced using Geospatial Information System (GIS) and fuzzy reasoning. In this research among all factors that usually play critical roles in the occurrence of traffic accidents, environmental factors and roadway design are considered. Using incomplete data the consideration of uncertainty is herein investigated using fuzzy reasoning. This method is performed in part of Iran's transit roads (Kohin-Loshan) for less expensive means of analyzing the risks and road safety in Iran. Comparing the results of this approach with existing statistical metho ds shows advantages when data are uncertain and incomplete, specially for recently built transportation roadways where statistical data are limited. Results show in some instances accident locations are somewhat displaced from the segments of highest risk and in few sites hazardous segments are not determined using traditional statistical methods. Keywords: Fuzzy Inference Systems (FIS); Geospatial Information System (GIS); Road Hazardous Segment Identification (RHSI) 1. Introduction The road based transportation networks have become the most important part of the infrastructure in all countries. Roads are not only important as the physical structure of the society, but also as the foundation for social and eco- nomic developments. An increased demand for suburban mobility also increases the problems caused by transpor- tation networks. One of these problems is accident oc- currence. Several factors such as human factors, vehicle factors, environmental factors and roadway design usu- ally play a role in traffic accident occurrence [1]. At pre- sent in Iran, accident data obtained from the “Analysis Form for Traffic Accidents” are used to identify the road segments with high potential for accident. This form is filled out by a police officer for each traffic accident with casualties on a public road in Iran. Based on the informa- tion in these forms this method picks some segments with high potential for accident and then the danger re- lated to these segments is estimated using statistical ap- proaches. Since there is no statistical information for the newly-built route available, this method cannot be used for transportation networks that have been recently built. This research introduces a new and general method for identification of road segments with high potential for accident in transportation networks. Although driver mis- takes often contribute greatly to the occurrence of any particular accident event, spatial analysis of road haz- ardous segments help to explain why accidents are more frequent in some segments than in others. The study area is Kohin-Loshan transit road that connects Tehran to the North of Iran and is located in a mountainous region that has most factors for accident occurrences. Since the study area is an old one and adequate spatial data were not available, among several factors that usually play a role in traffic accident occurrence, in this research only environmental factors and roadway design are considered. Moreover, integrated use of GIS and fuzzy reasoning is used for identification of roads hazardous segments. Geo- spatial Information System (GIS) is a technology which when incorporated in the analysis of road hazards, can facilitate a quick way of data retrieval, in addition to fa- cilitating a means of making precise remedial engineer- ing designs to improve road sections which are prone to road traffic accidents [2]. The most straightforward use of GIS for accidents analysis is the examination of spatial characteristics of accident locations [3]. Road hazardous C opyright © 2012 SciRes. JTTs  M. EFFATI ET AL. 33 segment identification can benefit from the data man- agement, representation and spatial analytical functions offered by a GIS. This research shows how integrated use of GIS and fuzzy reasoning can be properly applied in modeling uncertainty of road hazardous segment iden- tification. The terminology of fuzzy logic for spatial in- formation management and modeling localities is intro- duced in Section 2.1. In the following related researches and proposed method is introduced. Section 3 presents implementation process and the first successful applica- tion of this new approach. Evalu ating of result points out in Section 4. Background In [4], Jha and McCall explored the applications of GIS based computer visualization techniques in highway pro- jects. In this project they found that GIS serves as a re- pository of geographic information and enables spatial manipulations and database management. Implementa- tion of this project in a real highway project from Mary- land indicated that integration of GIS and computer visu- alization greatly enhances the highway development process. Another research project conducted by Carreker and Bachman demonstrated that by applying GIS, the accuracy and efficiency of locating crashes could be im- proved [5]. In [6], Fu ller et al. used GIS and remote sen- sing data and analyzed several geometric road risk fac- tors in the U.S. Southwest. This research used four road geometry factors and geology-based criteria and did not consider weather condition and road proximity land use effect on road hazardous location identification. They also did not use expert knowledge for determination of fuzzy membership functions. In 2003, a so-called novel adaptive neuro-fuzzy logic model was developed by Adeli and Jiang to estimate freeway work zone capacity. The model combined fuzzy logic with neuro-computing concepts and was used for the nonlinear mapping of 17 different factors impacting the freeway work zone capac- ity. This method provides two advantages over the exist- ing methods. First, it incorporates a large number of fac- tors impacting the work zone capacity. Second, unlike the empirical equations, this model does not requ ire sele- ction of various adjustment factors or values by the work zone engineers based on prior experience [7]. In [3], Steenberghen et al. found the usefulness of GIS and point pattern techniques for defining road-accident black zones within urban agglomerations. This research showed the usefulness of GIS and point pattern techniques for defining road-accident black zones within urban agglo- merations. In their research one-dimensional (line) and two dimensional (area) clustering techniques for road accidents were compared. Their method needs previous accident data in the study area for spatial clustering, so cannot be used in newly-built roads. In [8], Cheng and Washington by using experimentally derived simulated data evaluated three hotspot identification methods ob- served in practice: simple ranking, confidence interval, and Empirical Bayes. The results showed that the Em- pirical Bayes technique significantly outperforms ranking and confidence interval techniques. Erdogan et al. used GIS as a management system for accident analysis and determined the hotspots in the highways with two dif- ferent methods of kernel density analysis and repeatabil- ity analysis in 2008. They realized that the hotspots de- termined with two methods reflect really problematic places such as cross roads, junction points etc. [9]. The performance of various methods in hotspot identification was compared in [10] by Montella. In this research, se ven commonly applied hotspot identification methods (crash frequency, equivalent property, damage only crash fre- quency, crash rate, proportion method, empi rical Bayes es- timate of total-crash frequency, empirical Bayes estimate of severe-crash frequency, and potential for improvement) were compared against for robust and informative quan- titative evaluation criteria. In [11] Polat and Durduran used four classifier algorithms comprising ANN, ANFIS, SVM, and C4.5 decision tree to classify the traffic acci- dent cases with the help of GIS after a data preprocessing method called SCAW applied to traffic accidents data- base. Since there is no statistical information for the newly-built route available, these methods cannot be used for transportation networks that are recently built. These methods have used GIS only as a visualization tool to show their results. The proposed method of this research uses GIS functions to analysis and extracts useful infor- mation from raw data and integrates GIS and fuzzy rea- soning through expertise knowledge to assist road de- partments in suburban jurisdictions improve the safety of the roads under their management. 2. The Proposed Method Research methodology is based on integration of GIS and fuzzy reasoning which helps decision makers to de- termine which risks are the most important ones, and ultimately decide where hazard mitigation strategies should be employed. Figure 1 shows different steps of research methodology for creating composite risk map for identi- fication of road hazardous se gments. 2.1. Fuzzy Logic in Spatial Information Fuzzy set theory, introdu ced by Zadeh in the 1960 s, rese- mbles human reasoning in its use of approximate infor- mation and uncertainty to generate decisions [12]. Fuzzy logic allows objects to take partial membership in vague concepts. The main idea of fuzzy logic is that items in the real world are better described by having partial Copyright © 2012 SciRes. JTTs  M. EFFATI ET AL. Copyright © 2012 SciRes. JTTs 34 Figure 1. Research methodology for identification of road hazardous segments. membership in complementary sets than by having com- plete membership in exclusive sets [12]. In classic logic the membership of an element to a set is represented by 0 if it does not belong and 1 if it does, hav ing the set {0, 1}. On the other hand, in fuzzy logic this set extends to the interval [0, 1]. Therefore, it could be said that fuzzy logic is an extension of the classic systems [13]. A fuzzy set A over a universe of discourse X (a finite or infinite inter- val within which the fuzzy set can take a value) is a set of pairs (Equati on (1)): /: ,0,1 AA AxxxXx (1) In Equation (1), A is called the membership de- gree of the element x to the fuzzy set A. This degree ranges between the extremes 0 and 1 of the dominion of the real numbers. Depending on the type of membership function, different types of fuzzy sets will be obtained. Zadeh proposed a series of membership functions that could be classified into two groups: those made up of straight lines being “linear” ones, and to the contrary the Gaussian forms, or “curved” ones. A linguistic label is the word, in natural language, that expresses or identifies a fuzzy set that may or may not be formally defined. Thus, the membership function A of a fuzzy set A expresses the degree in which x verifies the category specified by A. Membership functions are at the core of fuzzy logic, so proper use of fuzzy reasoning depends on proper construction of membership functions. A number of methods are available to construct membership func- tions using expert kno wledge. As such as in this research expert knowledge is used to construct membership func- tions and fuzzy rules, proper selection of experts must ensure the use of appropriate expert knowledge. Selected experts should be familiar with an analysis of the public concern in terms of multiple issues and be able to judge measurements of corresponding indicators in linguistic terms. As such as in this research road geometry and en- vironmental factors for road hazardous segment identifi- cation have been considered, a heterogeneous group of experts (both scientific and practical) from Ministry of Road and Urban Development Transportation Research Institute and Meteorological Organization was selected. Another issue that should be considered is the method of expert knowledge elicitation. Different methods (point estimation, interval estimation, direct rating, and transi- tion interval estimation) are available to elicit expert knowledge for the construction of membership functions. Since research variables are in different type and point estimation method can be applied to nominal, discrete and continuous variables, a point estimation based me- thod has been used in this research. The main advantage of this method is the simple processing of elicited expert  M. EFFATI ET AL. 35 knowledge. In point estimation, an expert j (j = 1,, J) determines unambiguously whether each x does or does not have propertyi . An overall assessment is computed as Equation (2): 1 ii J AA jj xJ (2) In this method to obtain a proper membership function more than one expert is needed [14]. Fuzzy logic based methodology in spatial information can provide a conservative representation tool for indi- vidual differences in the perception. A basic difference between perceptions and measurements is that, in general, measurements are crisp whereas perceptions are fuzzy. In a fundamental way, this is the reason why to deal with perceptions it is necessary to employ a logical system that is fuzzy rather than crisp [15]. From this simple con- cept, a complete mathematical and computing theory has been developed that facilitates the solution of certain problems in spatial information. The types of uncertainty that appear in geospatial information systems are not just simple randomness of observation (as in weather data that is used as a environmental factor in this research) but are manifested in many other forms including impreci- sion, incompleteness and granularization. The multiplic- ity of uncertainty appearing in GIS data and analysis re- quires a variety of formalisms to model these uncertain- ties. In light of this it is natural that fuzzy set theory has become a topic of intensive interest in many areas of geospatial research and applications [16]. 2.2. Road Hazardous Segment Identification Based on Fuzzy Inference System This research shows how fuzzy reasoning can be prop- erly applied in modeling localities. Identification of road hazardous locations by fuzzy reasoning has a definite advantage over a crisp set. A fuzzy logic based method- ology is used in this research for the following reasons: It makes best possible use of sparse information to reconstitute details. Fuzzy logic is well suited for modeling continuous, real world systems. Fuzzy logic based methodology for modeling locali- ties provides a conservative representation tool for individual differences in the perception and consti- tutes a closer depiction of reality. Research variables are continuous, imprecise, or am- biguous. Fuzzy set modeling over the reference data can mini- mize the problems caused by the imperfection of source data Fuzzy sets are an extension of crisp (two valued) sets to handle the concept of partial truth, which enables the modeling of uncertainties of natural language [17] in this research. Traffic crashes are caused due to interaction of vehicle, driver, roadway and environmental factors. All these factors interact with each other and influence the occur- rence and severity of crashes simultaneously. Although driver error often contributes greatly to the occurrence of any particular crash event, analysis of roadway and en- vironmental factors help to explain why crashes are more frequent in some locations than in others. In this research considering accessibility to data several roads hazard criteria have been taken into consideration. Table 1 il- lustrates these criteria and their descriptions. This re- search is an attempt to implement the road and environ- mental related factors for road hazardous segment identi- fication and thus help in identifying the required reme- dial measures. According to Table 2 these factors can be divided into two classes: Road geometry design factors; Environmental factors. Each of these variables is treated as a risk factor in analysis of risks associated with the roads. Fuzzy proc- essing of the hazard descriptors requires a specification of the linguistic labels which represent fuzzy sets. The linguistic variables and linguistic labels used for investi- gations of each geometry and environmental factors are listed in Table 2. The type of fuzzy membership functions for each risk factor is very important so in this research various func- tions are tested and appropriate function for each risk factor is determined. Widely applied membership func- tions are bell-shaped and trapezoidal functions with Table 1. Description of roads hazard criteria. Factor Description Radius The shorter the radius the higher the hazard potential Slope Sections with higher slope have higher potential for hazard Visibility Sections with less visibility have higher potential for hazard Distance from Intersection Sections closer to intersections have higher hazard potential Road Width Whatever the narrower the road width is, the higher the hazard potential is Distance from the Starting Point of Roads (cities) Sections closer to cities have higher hazard potential Distance from Population Centers Sections closer to the population centers have higher hazard potential Rain Value The higher the rain value is, the higher the hazard potential is Copyright © 2012 SciRes. JTTs 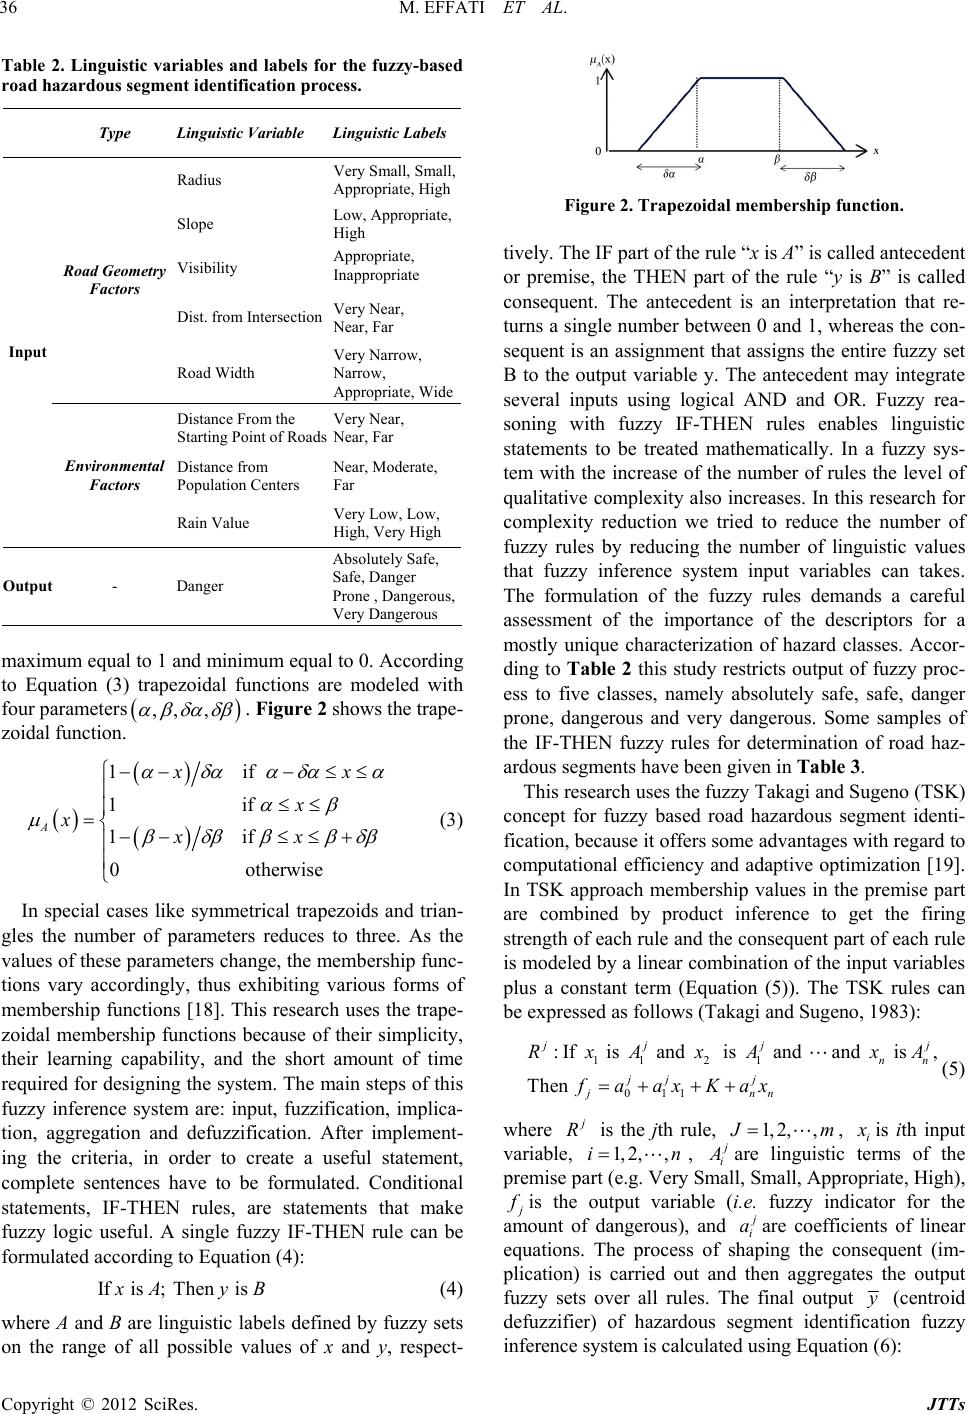 M. EFFATI ET AL. 36 Table 2. Linguistic variables and labels for the fuzzy-based road hazardous segment identification process. Type Linguistic Variable Linguistic Labels Radius Very Small, Small, Appropriate, High Slope Low, Appropriate, High Visibility Appropriate, Inappropriate Dist. from Intersection Very Near, Near, Far Road Geometry Factors Road Width Very Narrow, Narrow, Appropriate, Wide Distance From the Starting Point of Roads Very Near, Near, Far Distance from Population Centers Near, Moderate, Far Input Environmental Factors Rain Value Very Low, Low, High, Very High Output - Danger Absolutely Safe, Safe, Danger Prone , Dangerous, Very Dangerous maximum equal to 1 and minimum equal to 0. According to Equation (3) trapezoidal functions are modeled with four parameters ,, , . Figure 2 shows the trape- zoidal function. 1if 1if 1if 0otherwise A x x xxx x (3) In special cases like symmetrical trapezoids and trian- gles the number of parameters reduces to three. As the values of these parameters change, the membership func- tions vary accordingly, thus exhibiting various forms of membership functions [18]. This research uses the trape- zoidal membership functions because of their simplicity, their learning capability, and the short amount of time required for designing the system. The main steps of this fuzzy inference system are: input, fuzzification, implica- tion, aggregation and defuzzification. After implement- ing the criteria, in order to create a useful statement, complete sentences have to be formulated. Conditional statements, IF-THEN rules, are statements that make fuzzy logic useful. A single fuzzy IF-THEN rule can be formulated according to Equation (4): If is ; Then is AyB on the range of all possible values of x and y, respect- (4) where A and B are linguistic labels defined by fuzzy sets Figure 2. Trapezoidal membership function. tively. cedent r premise, the THEN part of the rule “y is B” is called ent identi- fic The IF part of the rule “x is A” is called ante o consequent. The antecedent is an interpretation that re- turns a single number between 0 and 1, whereas the con- sequent is an assignment that assigns the entire fuzzy set B to the output variable y. The antecedent may integrate several inputs using logical AND and OR. Fuzzy rea- soning with fuzzy IF-THEN rules enables linguistic statements to be treated mathematically. In a fuzzy sys- tem with the increase of the number of rules the level of qualitative complexity also increases. In this research for complexity reduction we tried to reduce the number of fuzzy rules by reducing the number of linguistic values that fuzzy inference system input variables can takes. The formulation of the fuzzy rules demands a careful assessment of the importance of the descriptors for a mostly unique characterization of hazard classes. Accor- ding to Table 2 this study restricts output of fuzzy proc- ess to five classes, namely absolutely safe, safe, danger prone, dangerous and very dangerous. Some samples of the IF-THEN fuzzy rules for determination of road haz- ardous segments have been given in Table 3. This research uses the fuzzy Takagi and Sugeno (TSK) concept for fuzzy based road hazardous segm ation, because it offers some advantages with regard to computational efficiency and adaptive optimization [19]. In TSK approach membership values in the premise part are combined by product inference to get the firing strength of each rule and the consequent part of each rule is modeled by a linear combination of the input variables plus a constant term (Equation (5)). The TSK rules can be expressed as follows (Takagi and Sugeno, 1983): 112 1 :If is and is and and is , 01 1 Then jj j nn RxA xAxA jj j jnn faaxKax (5) where R is the jth rule, 1, 2,, m, i is ith in variab put le, 1, 2,,in , i are linguistic ter Small, Appms of the premise part (e.g. Very Small,roiate, High), pr is the i.e. fuzzy indicator for the amount of dangerous), and output variable ( i aare coefficients of linear ations. The process of shaping the consequent (im- plication) is carried out anden aggregates the output fuzzy sets over all rules. The final output equ th (centroid defuzzifier) of hazardous segment identification fuzzy inference system is calculated using Equation 6): ( Copyright © 2012 SciRes. JTTs 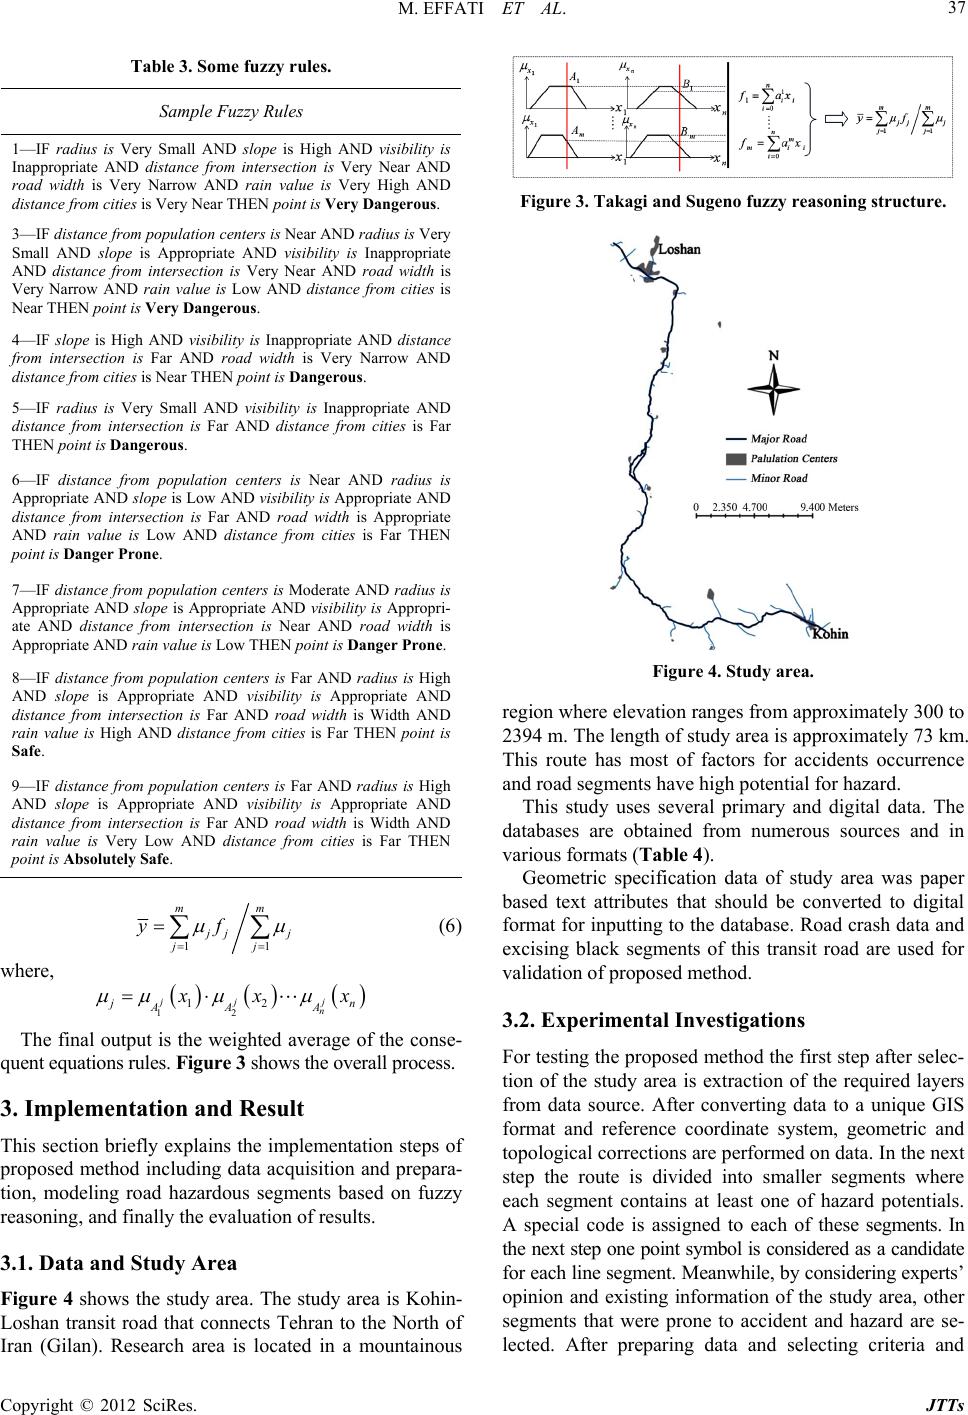 M. EFFATI ET AL. 37 Table 3. Some fuzzy rules. Sample Fuzzy Rules 1—IF radius is Very igh AND visibility is Inappropriate AND d is Very Near AND Small AND slope is H istance from intersection road width is Very Narrow AND rain value is Very High AND distance from cities is Very Near THEN point is Very Dangerous. 3—IF distance from population centers is Near AND radius is Very Small AND slope is Appropriate AND visibility is Inappropriate idth is Very Narrow AND ities is Far ow AND visibility is Appropriate AND opriate AND visibility is Appropri- slope is Appropriate AND visibility is Appropriate AND AND distance from intersection is Very Near AND road width is Very Narrow AND rain value is Low AND distance from cities is Near THEN point is Very Dangerous. 4—IF slope is High AND visibility is Inappropriate AND distance from intersection is Far AND road w distance from cities is Near THEN point is Dangerous. 5—IF radius is Very Small AND visibility is Inappropriate AND distance from intersection is Far AND distance from c THEN point is Dangerous. 6—IF distance from population centers is Near AND radius is Appropriate AND slope is L distance from intersection is Far AND road width is Appropriate AND rain value is Low AND distance from cities is Far THEN point is Danger Prone. 7—IF distance from population centers is Moderate AND radius is Appropriate AND slope is Appr ate AND distance from intersection is Near AND road width is Appropriate AND rain value is Low THEN point is Danger Prone. 8—IF distance from population centers is Far AND radius is High AND slope is Appropriate AND visibility is Appropriate AND distance from intersection is Far AND road width is Width AND rain value is High AND distance from cities is Far THEN point is Safe. 9—IF distance from population centers is Far AND radius is High AND distance from intersection is Far AND road width is Width AND rain value is Very Low AND distance from cities is Far THEN point is Absolutely Safe. 11 mm jj jj yf (6) where, 12 12 jj j n n A AA xx The final output is the weighted average othe conse- quent equations rules. Figure 3 shows the overall process. mentation steps of ition and prepara- . The study area is Kohin- cts Tehran to the North of f 3. Implementation and Result This section briefly explains the imple proposed method including data acquis tion, modeling road hazardous segments based on fuzzy reasoning, and finally the evaluation of results. 3.1. Data and Study Area Figure 4 shows the study area Loshan transit road that conne Iran (Gilan). Research area is located in a mountainous Figure 3. Takagi and Sugeno fuzzy reasoning structure. Figure 4. Study area. region where elevation ranges from approxiately 300 to 2394 m. The lengtoximately 73 km. his route has most of factors for accidents occurrence atabase. Road crash data and ex the first step after selec- he required layers a to a unique GIS m h of study area is appr T and road segments have high potential for hazard. This study uses several primary and digital data. The databases are obtained from numerous sources and in various formats (Table 4). Geometric specification data of study area was paper based text attributes that should be converted to digital format for inputting to the d cising black segments of this transit road are used for validation of proposed method. 3.2. Experimental Investigations For testing the proposed method tion of the study area is extraction of t from data source. After converting dat format and reference coordinate system, geometric and topological corrections are performed on data. In the next step the route is divided into smaller segments where each segment contains at least one of hazard potentials. A special code is assigned to each of these segments. In the next step one point symbol is considered as a candidate for each line segment. Meanwhile, by considering experts’ opinion and existing information of the study area, other segments that were prone to accident and hazard are se- lected. After preparing data and selecting criteria and Copyright © 2012 SciRes. JTTs 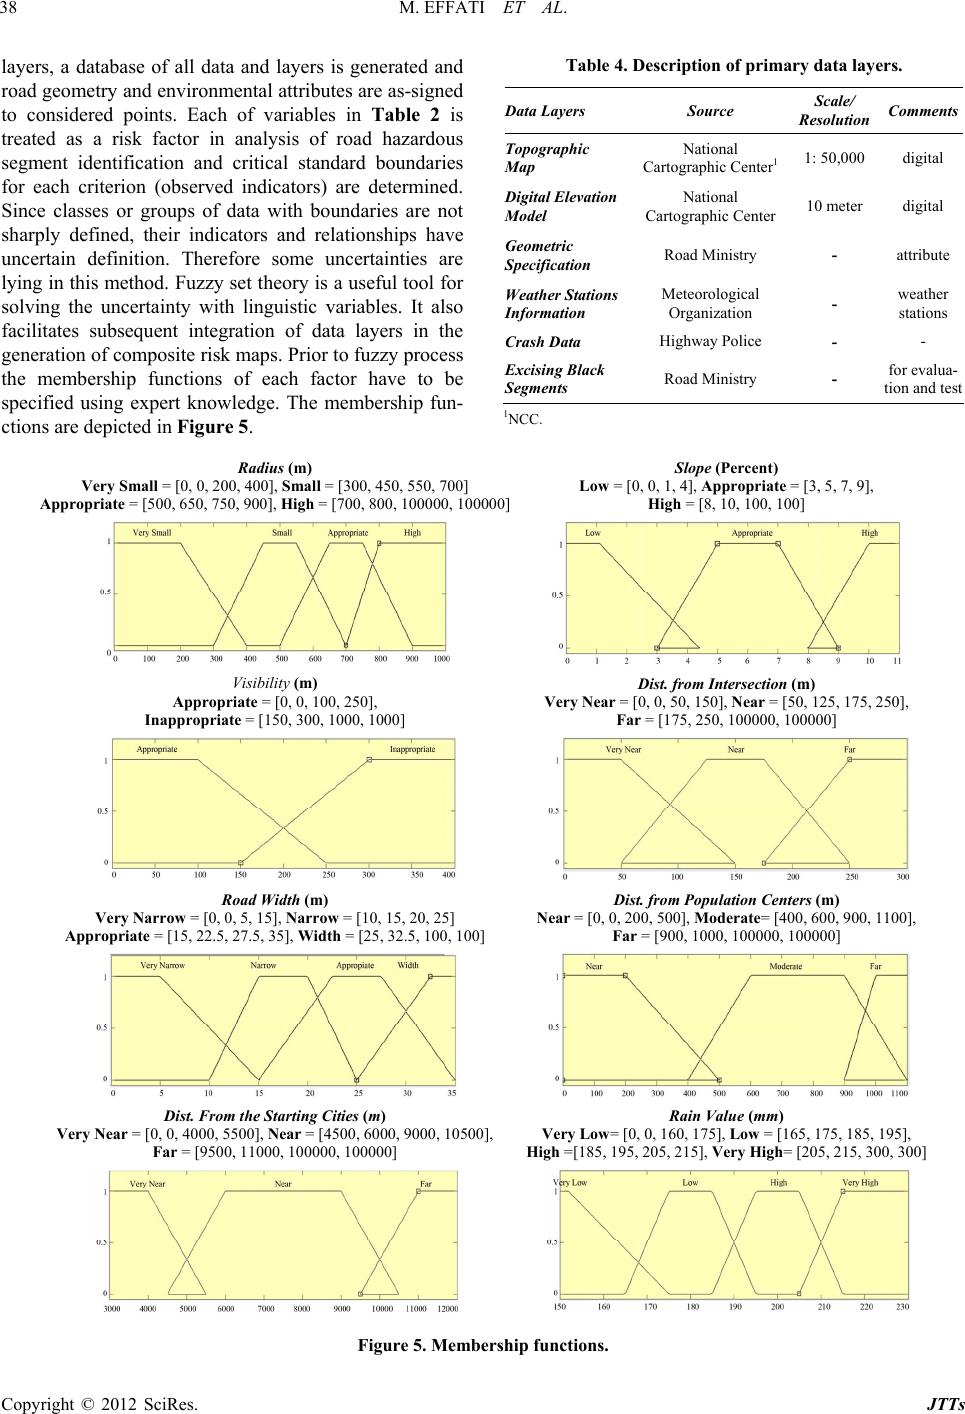 M. EFFATI ET AL. Copyright © 2012 SciRes. JTTs 38 Table 4. Description of primary data layers. Data Layers Source Resolution Comments layers, a database of all data and layers is generated and road geometry and environmental attributes are as-signed to considered points. Each of variables in Table 2 is treated as a risk factor in analysis of road hazardous segment identification and critical standard boundaries for each criterion (observed indicators) are determined. Since classes or groups of data with boundaries are not sharply defined, their indicators and relationships have uncertain definition. Therefore some uncertainties are lying in this method. Fuzzy set theory is a useful tool for solving the uncertainty with linguistic variables. It also facilitates subsequent integration of data layers in the generation of composite risk maps. Prior to fuzzy process the membership functions of each factor have to be specified using expert knowledge. The membership fun- ctions are depicted in Figure 5. Scale/ Topographic National Carto nter1 1: 50,000 digital Map graphic Ce Digital Elevation Carto ter 10 meter digital ric Road Ministry - attribute ns Meteorological - weather Highway Police - ck Road Ministry - for evalua- Model Geomet National graphic Cen Specification Weather Statio Information Crash Data Organization stations - Excising Bla Segments tion and test 1NCC. Slope (Percent) Low = [0, 0, 1, 4], Appropriate = [3, 5, 7, 9], High = [8, 10, 100, 100] Radius (m) Very Small = [0, 0, 200, 400], Small = [300, 450, 550, 700] Appropriate = [500, 650, 750, 900 ], = [700,High 800, 100000, 100000] Visibility (m) Appropriate = [0, 0, 100, 250], Inappropriate 1000, 10 00] = [150, 300, Dist. from Intersection (m) Very Near = [0, 0, 50, 150], Near = [50, 125, 175, 250 Far ], = [175, 250, 100000, 100000] Dist. from Population Centers (m) Near = [0, 0, 200, 500], Moderate= [400, 600, 900, 1100 Far ], = [900, 1000, 100000, 100000] Road Width (m) Very Narrow = [0, 0, 5, 15], Narrow = [10, 15, 20, 25] Appropriate = [15, 22.5,Width = [25, 32.5, 100, 100] 27.5, 35], Rain Value (mm) Very Low= [0, 0, 160, 175], Low = [165, 175, 185, 195 High =[185, 195, 205, 215], Very High= [205, 215, 300, 300] ], Dist. From the Starting Cities (m) Very Near = [0, 0, 4000, 5500], Near = [4500, 6000, 9000, 10500 ], Far = [9500, 11000, 100000, 100000] Figure 5. Membership functions. 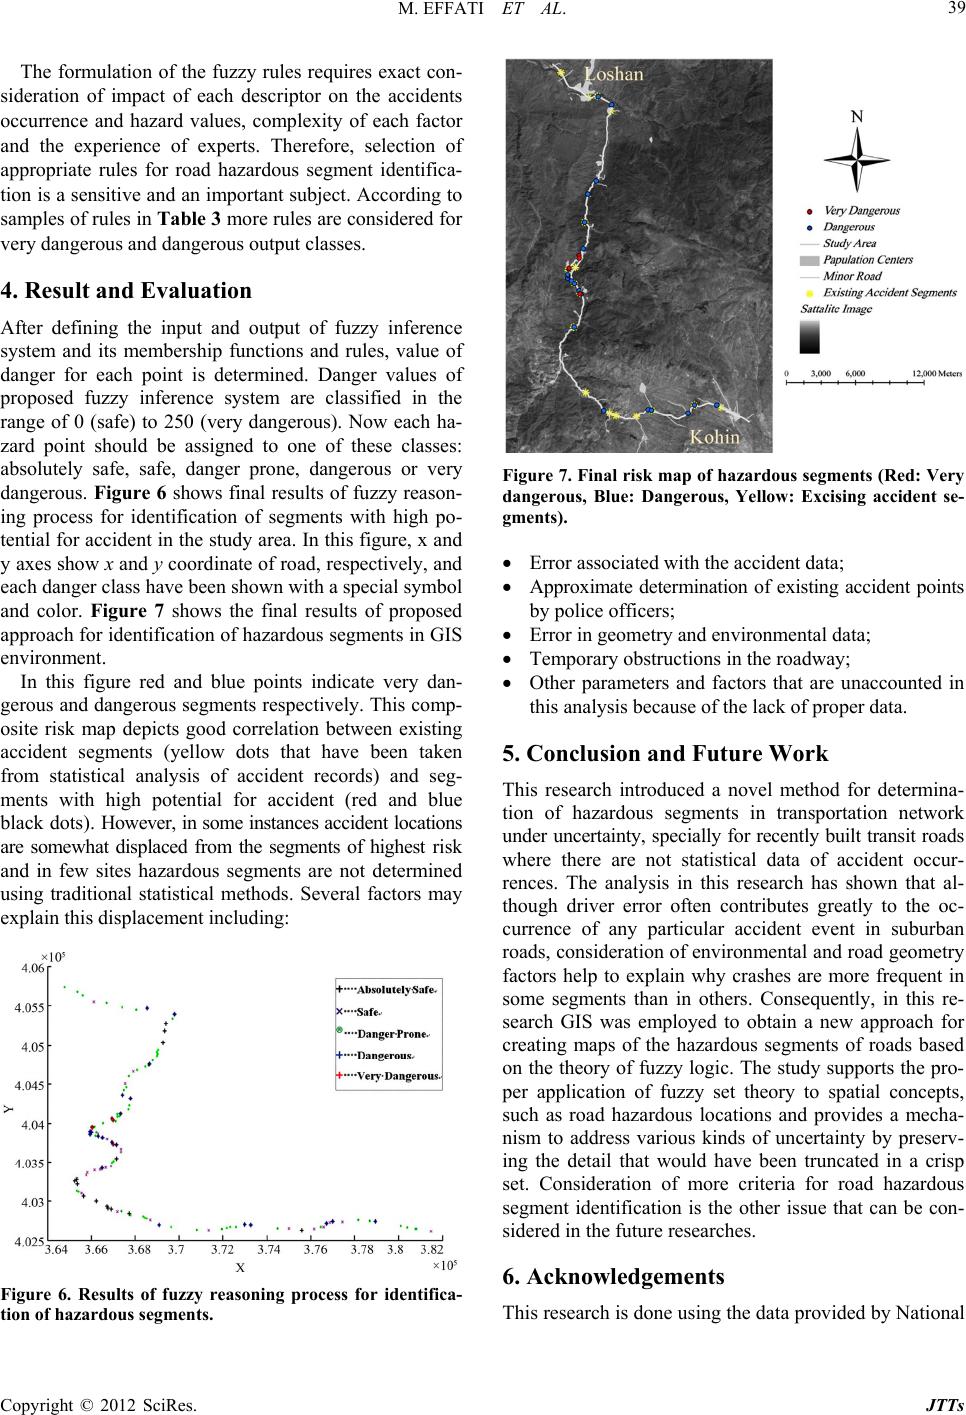 M. EFFATI ET AL. 39 The form sideration occurrence and hazard values, complexity of each factor and the experience of experts. Therefore, selection of appropriate rules for road hazardous segment identifica- tion is a sensitive and an important subject. According to samples of rules in Table 3 more ru les are con sider ed for very dangerous and dangerous output classes. A gh po- rea. In this figure, x and ad, respectively, and placement including: ulation act con- of impacidents of the fuzzy rules requires ex ct of each descriptor on the ac 4. Result and Evaluation fter defining the input and output of fuzzy inference system and its membership functions and rules, value of danger for each point is determined. Danger values of proposed fuzzy inference system are classified in the range of 0 (safe) to 250 (very dangerous). Now each ha- zard point should be assigned to one of these classes: absolutely safe, safe, danger prone, dangerous or very dangerous. Figure 6 shows final results of fuzzy reason- ing process for identification of segments with hi tential for accident in the study a y axes show x and y coordinate of ro each danger class have been shown with a special symbol and color. Figure 7 shows the final results of proposed approach for identification of hazardous segments in GIS environment. In this figure red and blue points indicate very dan- gerous and dangerous segments respectively. This comp- osite risk map depicts good correlation between existing accident segments (yellow dots that have been taken from statistical analysis of accident records) and seg- ments with high potential for accident (red and blue b la ck do t s) . However, in some instan ces accident location s are somewhat displaced from the segments of highest risk and in few sites hazardous segments are not determined using traditional statistical methods. Several factors may explain this dis Figure 6. Results of fuzzy reasoning process for iden tion of hazardous segments. tifica- Figure 7. Final risk map of hazardous segments (Red: Very dangerous, Blue: Dangerous, Yellow: Excising accident se- gments). Error associated with the accident data; Approximate determination of existing accident points by police officers; Error in geometry and environmental data; ctors that are unaccounted in this analysis because of the lack of proper data. 5. Conclusion and Future Work This research introduced a novel method for determina- tion of hazardous segments in transportation network under uncertainty, specially f or recently built transit roads where there are not statistical data of accident occur- rences. The analysis in this research has shown that al- though driver error often contributes greatly to the oc- currence of any particular accident event in suburban roads, consideration of environmental and road geometry factors help to explain why crashes are more frequent in some segments than in others. Consequently, in this re- search GIS was employed to obtain a new approach for creating maps of the hazardous segments of roads based on the theory of fuzzy logic. The study supports the pro ould have been truncated in a crisp ad hazardous Temporary obstructions in the roadway; Other parameters and fa - per application of fuzzy set theory to spatial concepts, such as road hazardous locations and provides a mecha- nism to address various kinds of uncertainty by preserv- g the detail that win set. Consideration of more criteria for ro segment identification is the other issue that can be con- sidered in the future researches. 6. Acknowledgements This research is done using the data provided by National Copyright © 2012 SciRes. JTTs  M. EFFATI ET AL. 40 Cartographic Center (NCC), National Geographic Or- ganization and Iran Ministry of Road and Urban Devel- opment Transportation Research Institute. REFERENCES [1] M. Effati, F. Samadzadegan and M. A. Rajabi, “Risk Analysis of Transportation Networks Using a Fuzzy Based Multi-Criteria Decision Making System,” 1st An- nual International Conference on Transportation and Lo- gistics, Chiangmai, 17-19 December 2009. [2] J. K. Z. Mwatelha, “Application of Geographical Infor- mation Systems (GIS) to Analyze Causes of Road Traffic Accidents (RTAs) Case Study of Kenya,” International Conference on Spatial Information for Sustainable De- velopment, Nairobi, 2-5 October 2001. [3] T. Steenberghen, T. Dufays and I. B. Flahaut, “Intra-Urban Location and Clustering of Road Accidents Using GIS: A Belgian Example,” International Journal of Geographi- cal Information Science, Vol. 18, No. 2, 2004, pp. 169- 181. doi:10.1080/13658810310001629619 [4] M. Jha, C. McCall and P. Schonfeld, “Using GIS, Genetic Algorithms and Visualization in Highway Development,” Journal of Computer—Aided Civil and Infrastructure En- gineering, Vol. 16, No. 6, 2001, pp. 399-414. chman, “Geographic Informa- Improve Speed and Accuracy D. James, “ and Risk Analysis alongRoads,” grating Remot, Regional and Lo- [5] L. E. Carreker and W. Ba tion System Procedures to in Locating Crashes,” Transportation Research Record 1719, TRB, National Research Council, Washington DC, 2000, pp. 215-218. [6] D. Fuller, M. Jeffe, R. A. Williamson and ellite Remote Sensing and Transportation Lifelines: Safety Sat- Rural Southwest e Sensing at the Global Inte- cal Scale. Pecora 15/Land Satellite Information IV Con- ference, Denver, 11-15 November 2002, p. 8. [7] H. Adeli and X. Jiang, “Ne uro-Fuzzy Logic Model for Free- way Work Zone Capacity Estimation,” Journal of Trans- portation Engineering, Vol. 129, No. 5, 2003, pp. 484- 493. doi:10.1061/(ASCE)0733-947X(2003)129:5(484) [8] W. Cheng and S. P. Washington, “Experimental Evalua- tion of Hotspot Identification Methods,” Elsevier Journal of Accident Analysis and Prevention, Vol. 37, No. 5, 2005, pp. 870-881. doi:10.1016/j.aap.2005.04.015 [9] S. Erdogan, I. Yilmaz, T. Baybura and M. Gullu “Geo- graphical Information Systems Aided Traffic Accident Analysis System Case Study: City of Afyonkarahisar,” Elsevier Journal of Accident Analysis and Prevention, Vol. 40, No. 1, 2008, pp. 174-181. doi:10.1016/j.aap.2007.05.004 [10] A. Montella, “A Comparative Analysis of Hotspot Identi- fication Methods,” Elsevier Journal of Accident Analysis and Prevention, Vol. 42, No. 2, 2009, pp. 571-581. doi:10.1016/j.aap.2009.09.025 [11] K. Polat and S. S. Durduran, “Subtractive Clustering At- tribute Weighting (SCAW) to Discriminate the Traffic Accidents on Konya-Afyonkarahisar Highway in Turkey with the Help of GIS: A Case Study,” Elsevier Advances in Engineering Software Jou rnal, Vol. 42, No. 7, 2011, pp . 491-500. doi:10.1016/j.advengsoft.2011.04.001 rnational Series in Engi- Vol. 165, 1992, pp. 1-25. [12] L. A. Zadeh, “Fuzzy Sets,” Information and Control, Vol. 8, No. 3, 1965, pp. 338-353. [13] L. A. Zadeh, “Knowledge Representation In Fuzzy Logic. In an Introduction to Fuzzy Logic Applications in Intelli- gent Systems,” The Kluwer Inte neering and Computer Science, doi:10.1007/978-1-4615-3640-6_1 [14] G. J. Klir and B. Yuan. “Fuzzy Sets and Fuzzy Logic: Theory and Applications,” Prentice Hall, Upper Sa River, 1995. ddle [15] L. A. Zadeh, “From Computing with Words to Comput- ing with Perceptions, Fundamental Theory and Applica- tions, Perceptions,” IEEE Journal of Transactions on Cir- cuits and Systems, Vol. 45, No. 1, 1999, pp. 105-119. doi.org/10.1109/81.739259 [16] F. E. Petry, V. B. Robinson and M. Cobb, “Fuzzy Mod- eling with Spatial Information for Geographic Problems,” Springer, New York, 2005. doi:10.1007/b138243 16/j.isprsjprs.2005.02.010 [17] A. P. Engelbrecht, “Computational Intelligence: An In- troduction,” 2nd Edition, John Wiley & Sons, Ltd., Ho- boken, 2007 [18] F. Samadzadegan, A. Azizi, M. Hahn and C. Lucas, “Au- tomatic 3D Object Recognition and Reconstruction Based on Neuro-Fuzzy Modeli ng,” ISPRS Journal of Pho to gr am - metry & Remote Sensing, Vol. 59, No. 5, 2005, pp. 255- 277. doi:10.10 r- 5-60. [19] T. Takagi and M. Sugeno, “Derivation of Fuzzy Control Rules from Human Operator’S Control Actions,” Pro- ceeding of the IFAC Symposium on Fuzzy Information, Knowledge Representation and Decision Analysis, Ma seille, 19-21 July 1983, pp. 5 Copyright © 2012 SciRes. JTTs
|