 Journal of Transportation Technologies, 2012, 2, 1-12 http://dx.doi.org/10.4236/jtts.2012.21001 Published Online January 2012 (http://www.SciRP.org/journal/jtts) Campus Mobility for the Future: The Electric Bicycle Ian Vince McLoughlin, I. Komang Narendra, Leong Hai Koh, Quang Huy Nguyen, Bharath Seshadri, Wei Zeng, Chang Yao School of Computer Engineering & Energy Research Institute, Nanyang Technological University, Singapore Email: mcloughlin@ntu.edu.sg Received September 19, 2011; revised October 16, 2011; accepted November 6, 2011 ABSTRACT Sustainable and practical personal mobility solutions for campus environments have traditionally revolved around the use of bicycles, or provision of pedestrian facilities. However many campus environments also experience traffic con- gestion, parking difficulties and pollution from fossil-fuelled vehicles. It appears that pedal power alone has not been sufficient to supplant the use of petrol and diesel vehicles to date, and therefore it is opportune to investigate both the reasons behind the continual use of environmentally unfriendly transport, and consider potential solutions. This paper presents the results from a year-long study into electric bicycle effectiveness for a large tropical campus, identifying barriers to bicycle use that can be overcome through the availability of public use electric bicycles. Keywords: Electric Bicycle; E-Bike; Campus Transport; Personal Mobility 1. Introduction The campus environment, especially that of the more established universities, has entered the public consci- ousness as being a haven for bicycle use [1]: not neces- sarily for reasons of their environmental credentials, but because their low cost suits the student budget. However many university campuses are notorious for parking pro- blems [2], and it may also be asserted that the fossil-fuel- led vehicles affordable to students are likely to be among the most polluting of their kind. Much research world- wide has been conducted on electro-mobility solutions, especially during recent years of increased awareness of CO2 emissions and the environmental consequences of profligate consumption of fossil fuels. However, the co- mmon term “electric vehicles” has become almost syn- onymous with “electric cars,” apart from some prominent niche examples which will be explored. In fact, cars are only one example of practical electric transportation. Unfortunately electric cars tend to be expensive, mai- nly due to the cost of the battery assembly. A four seater electric car being used to transport a single person is also wasteful of energy, although perhaps less so than with a petrol engined vehicle. Electric cars require parking spaces just like existing vehicles, and thus will not solve campus parking problems. These vehicles are also costly in terms of insurance (especially for younger drivers), require road tax payments (or equivalent in different countries), and usually require drivers to posses a valid license. By contrast, bicycles do not require insurance, attract no road tax and typically do not require a license to ride in most countries. Furthermore, they are efficient, environmentally friendly, and far more dense, when par- ked and driven, than the equivalent rows of cars. From experience, we know that at current oil prices, fossil fuelled vehicles are more attractive than bicycles for most users, but that bicycles are significantly cheaper. Thus barriers must exist to the use of bicycles for many potential riders. The premise of this paper is that many of these barriers can be overcome by technological means, at minimal cost, to create a usable form of transport for campus use. It should be noted that the emphasis here is on short journeys taken around a campus area, and per- haps short commutes from home to campus. Longer dis- tance travel presents a different problem: petrol and die- sel vehicles tend to become more efficient and less pol- luting per kilometre as distance increases [3], and a dif- ferent set of alternative transport solutions should be considered. Short journeys by petrol-engined cars are especially polluting (particularly until the catalytic con- verter reaches full operating temperature), and are a good target for replacement by bicycle. Apart from usage barriers, Section 2 presents other studies related to campus bicycle use and electrical-po- wer assist bicycles. Section 3 analyses the specifics of the typical campus environment, as this relates to trans- portation options, while Section 4 surveys international transport legislation and proposes an electric bicycle so- lution for campus use. Since the authors have been oper- ating such vehicles in a restricted-public lending scheme for more than a year, Section 5 reveals an analysis of system effectiveness and identifies particular usage chal- lenges, before Sect i on 6 c o ncludes the paper . C opyright © 2012 SciRes. JTTs 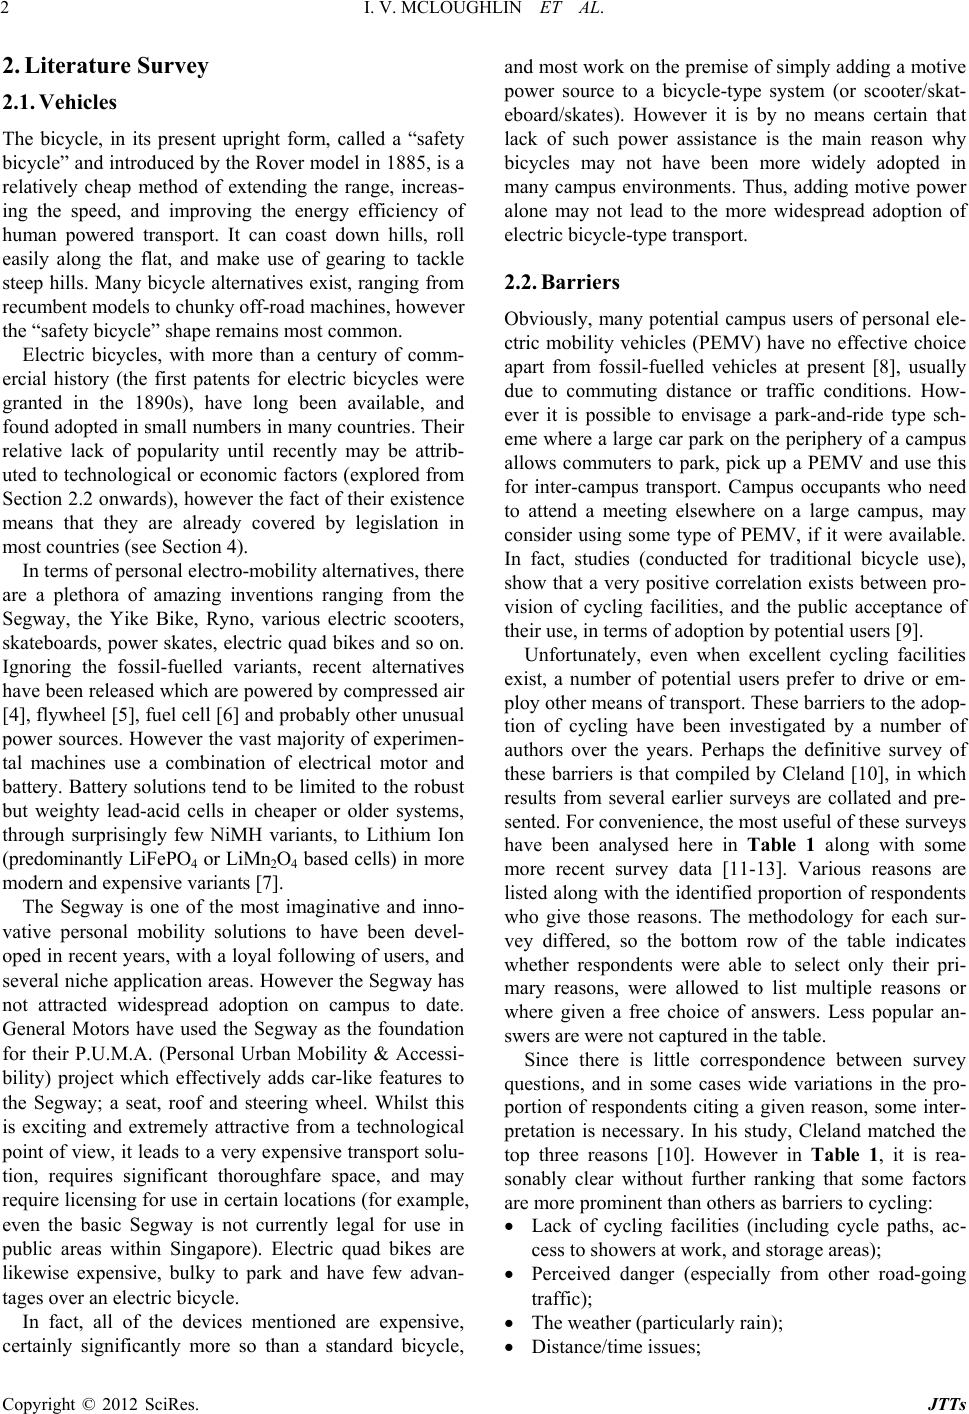 I. V. MCLOUGHLIN ET AL. 2 2. Literature Survey 2.1. Vehicles The bicycle, in its present upright form, called a “safety bicycle” and introduced by the Rover model in 1885, is a relatively cheap method of extending the range, increas- ing the speed, and improving the energy efficiency of human powered transport. It can coast down hills, roll easily along the flat, and make use of gearing to tackle steep hills. Many bicycle alternativ es exist, ranging from recumbent models to chunky off-road machines, however the “safety bicycle” shape remains most common. Electric bicycles, with more than a century of comm- ercial history (the first patents for electric bicycles were granted in the 1890s), have long been available, and found adopted in small numbers in many countries. Their relative lack of popularity until recently may be attrib- uted to technological or economic factors (explored from Section 2.2 onwards), ho wever the fact of their existen ce means that they are already covered by legislation in most countries (see Section 4). In terms of personal electro-mobility alternatives, there are a plethora of amazing inventions ranging from the Segway, the Yike Bike, Ryno, various electric scooters, skateboards, power skates, electric quad bikes and so on. Ignoring the fossil-fuelled variants, recent alternatives have been released which are powered by compressed air [4], flywheel [5], fuel cell [6] and probably other unusual power sources. However the vast majority of experimen- tal machines use a combination of electrical motor and battery. Battery solutions tend to be limited to the robust but weighty lead-acid cells in cheaper or older systems, through surprisingly few NiMH variants, to Lithium Ion (predominantly LiFePO4 or LiMn2O4 based cells) in more modern and expensive variants [7]. The Segway is one of the most imaginative and inno- vative personal mobility solutions to have been devel- oped in recent years, with a loyal following of users, and several niche application areas. However the Segway has not attracted widespread adoption on campus to date. General Motors have used the Segway as the foundation for their P.U.M.A. (Personal Urban Mobility & Accessi- bility) project which effectively adds car-like features to the Segway; a seat, roof and steering wheel. Whilst this is exciting and extremely attractive from a technological point of view, it leads to a very expensive transport solu- tion, requires significant thoroughfare space, and may require licensing for use in certain locations (for example, even the basic Segway is not currently legal for use in public areas within Singapore). Electric quad bikes are likewise expensive, bulky to park and have few advan- tages over an electric bicycle. In fact, all of the devices mentioned are expensive, certainly significantly more so than a standard bicycle, and most work on the premise of simply adding a motive power source to a bicycle-type system (or scooter/skat- eboard/skates). However it is by no means certain that lack of such power assistance is the main reason why bicycles may not have been more widely adopted in many campus environments. Thus, adding motive power alone may not lead to the more widespread adoption of electric bicycle-type transport. 2.2. Barriers Obviously, many potential campus users of personal ele- ctric mobility vehicles (PEMV) have no effective choice apart from fossil-fuelled vehicles at present [8], usually due to commuting distance or traffic conditions. How- ever it is possible to envisage a park-and-ride type sch- eme where a large car park on the periphery of a campus allows commuters to park, pick up a PEMV and use this for inter-campus transport. Campus occupants who need to attend a meeting elsewhere on a large campus, may consider using some type of PEMV, if it were available. In fact, studies (conducted for traditional bicycle use), show that a very positive correlation exists between pro- vision of cycling facilities, and the public acceptance of their use, in terms of adoption by potential users [9]. Unfortunately, even when excellent cycling facilities exist, a number of potential users prefer to drive or em- ploy other means of transport. These barriers to the adop- tion of cycling have been investigated by a number of authors over the years. Perhaps the definitive survey of these barriers is that compiled by Cleland [10], in which results from several earlier surveys are collated and pre- sented. For convenience, the most useful of these surveys have been analysed here in Table 1 along with some more recent survey data [11-13]. Various reasons are listed along with the identified proportio n of respondents who give those reasons. The methodology for each sur- vey differed, so the bottom row of the table indicates whether respondents were able to select only their pri- mary reasons, were allowed to list multiple reasons or where given a free choice of answers. Less popular an- swers are were not captured in the table. Since there is little correspondence between survey questions, and in some cases wide variations in the pro- portion of respondents citing a given reason, some inter- pretation is necessary. In his study, Cleland matched the top three reasons [10]. However in Table 1, it is rea- sonably clear without further ranking that some factors are more prominent than others as barriers to cycling: Lack of cycling facilities (including cycle paths, ac- cess to showers at work, and storage areas); Perceived danger (especially from other road-going traffic); The weather (particularly rain); Distance/time issues; Copyright © 2012 SciRes. JTTs 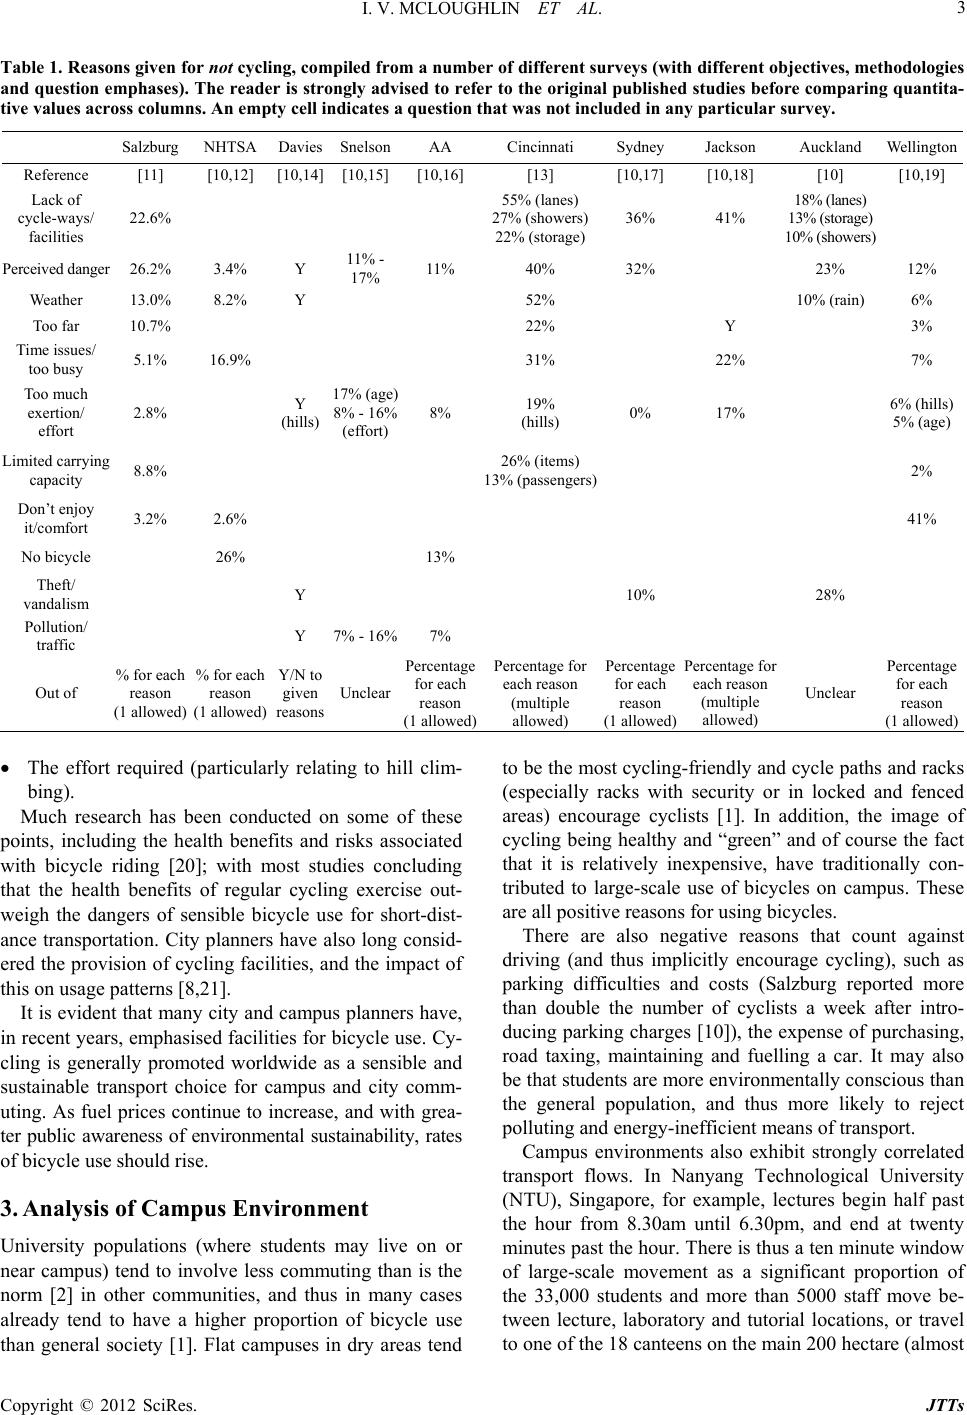 I. V. MCLOUGHLIN ET AL. Copyright © 2012 SciRes. JTTs 3 Table 1. Reasons given for not cycling, compiled from a number of different surveys (with different objectives, methodologies and question emphases). The reade r is strongly advised to refer to the original published studies before comparing quantita- tive values across columns. An empty cell indicates a question that was not included in any particular survey. Salzburg NHTSA Davies SnelsonAA Cincinnati Sydney Jackson Auckland Wellington Reference [11] [10,12] [10,14] [10,15][10,16] [13] [10,17] [10,18] [10] [10,19] Lack of cycle-ways/ facilities 22.6% 55% (lanes) 27% (showers) 22% (storage)36% 41% 18% (lanes) 13% (storage) 10% (shower s) Per c e i ved d a n g er 26.2% 3.4% Y 11% - 17% 11% 40% 32% 23% 12% Weather 13.0% 8.2% Y 52% 10% (rain) 6% Too far 10.7% 22% Y 3% Time issues/ too busy 5.1% 16.9% 31% 22% 7% Too much exertion/ effort 2.8% Y (hills) 17% (age) 8% - 16% (effort) 8% 19% (hills) 0% 17% 6% (hills) 5% (age) Limited carrying capacity 8.8% 26% (items) 13% (passengers) 2% Don’t enjoy it/comfort 3.2% 2.6% 41% No bicycle 26% 13% Theft/ vandalism Y 10% 28% Pollution/ traffic Y 7% - 16%7% Out of % for each reason (1 allowed) % for each reason (1 allowed) Y/N to given reasons Unclear Percentage for each reason (1 allowed) Percentage for each reason (multiple allowed) Percentage for each reason (1 allowed) Percentage for each reason (multiple allowed) Unclear Percentage for each reason (1 allowed) The effort required (particularly relating to hill clim- bing). Much research has been conducted on some of these points, including the health benefits and risks associated with bicycle riding [20]; with most studies concluding that the health benefits of regular cycling exercise out- weigh the dangers of sensible bicycle use for short-dist- ance transportation. City planners have also long consid- ered the provision of cycling facilities, and the impact of this on usage patterns [8,21]. It is evident that many city and campus planners have, in recent years, emphasised facilities for bicycle use. Cy- cling is generally promoted worldwide as a sensible and sustainable transport choice for campus and city comm- uting. As fuel prices co ntinue to increase, and with grea- ter public awareness of environmental sustainability, rates of bicycle use should rise. 3. Analysis of Campus Environment University populations (where students may live on or near campus) tend to involve less commuting than is the norm [2] in other communities, and thus in many cases already tend to have a higher proportion of bicycle use than general society [1]. Flat campuses in dry areas tend to be the most cycling-friendly and cycle paths and racks (especially racks with security or in locked and fenced areas) encourage cyclists [1]. In addition, the image of cycling being healthy and “green” and of course the fact that it is relatively inexpensive, have traditionally con- tributed to large-scale use of bicycles on campus. These are all positive reasons for using bicycles. There are also negative reasons that count against driving (and thus implicitly encourage cycling), such as parking difficulties and costs (Salzburg reported more than double the number of cyclists a week after intro- ducing parking charges [10]), the expense of purchasing, road taxing, maintaining and fuelling a car. It may also be that students are more environmentally conscious than the general population, and thus more likely to reject polluting and energy-inefficient means of transport. Campus environments also exhibit strongly correlated transport flows. In Nanyang Technological University (NTU), Singapore, for example, lectures begin half past the hour from 8.30am until 6.30pm, and end at twenty minutes past the hour. There is thus a ten minute window of large-scale movement as a significant proportion of the 33,000 students and more than 5000 staff move be- tween lecture, laboratory and tutorial locations, or travel to one of the 18 canteens on the main 200 hectare (almost 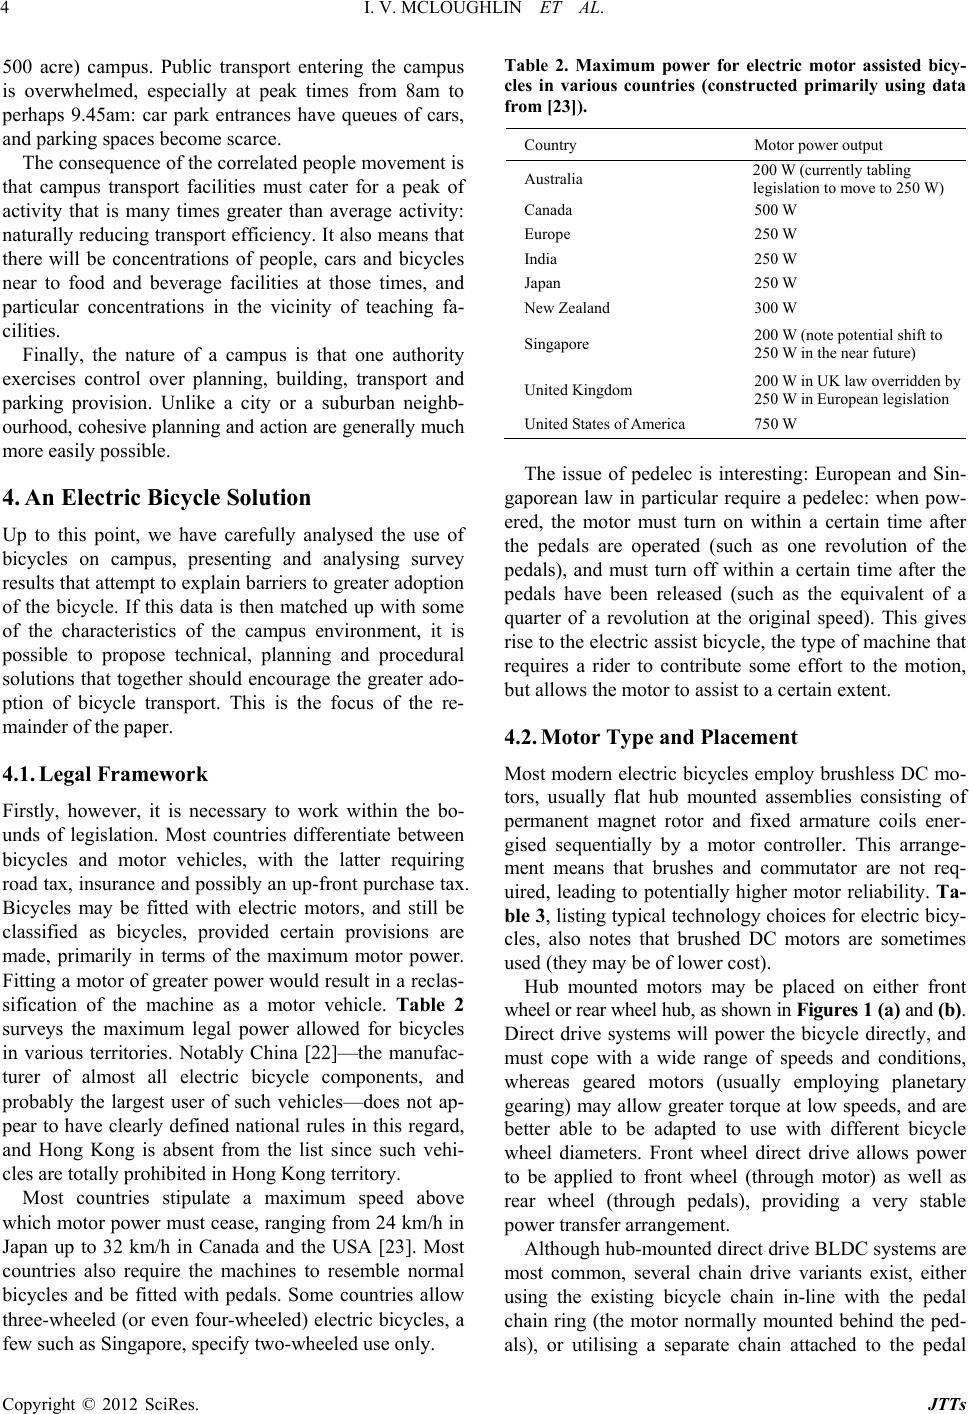 I. V. MCLOUGHLIN ET AL. 4 500 acre) campus. Public transport entering the campus is overwhelmed, especially at peak times from 8am to perhaps 9.45am: car park entrances have queues of cars, and parking spaces become scarce. The consequence of the correlated people movement is that campus transport facilities must cater for a peak of activity that is many times greater than average activity: naturally reducing tran sport efficiency. It also means that there will be concentrations of people, cars and bicycles near to food and beverage facilities at those times, and particular concentrations in the vicinity of teaching fa- cilities. Finally, the nature of a campus is that one authority exercises control over planning, building, transport and parking provision. Unlike a city or a suburban neighb- ourhood, cohesive planning and action are generally much more easily possible. 4. An Electric Bicycle Solution Up to this point, we have carefully analysed the use of bicycles on campus, presenting and analysing survey results that attempt to explain barriers to greater adop tion of the bicycle. If this data is then matched up with some of the characteristics of the campus environment, it is possible to propose technical, planning and procedural solutions that together should encourage the greater ado- ption of bicycle transport. This is the focus of the re- mainder of the paper. 4.1. Legal Framework Firstly, however, it is necessary to work within the bo- unds of legislation. Most countries differentiate between bicycles and motor vehicles, with the latter requiring road tax, insurance and possibly an up-front purchase tax. Bicycles may be fitted with electric motors, and still be classified as bicycles, provided certain provisions are made, primarily in terms of the maximum motor power. Fitting a motor of greater power would result in a reclas- sification of the machine as a motor vehicle. Table 2 surveys the maximum legal power allowed for bicycles in various territories. Notably China [22]—the manufac- turer of almost all electric bicycle components, and probably the largest user of such vehicles—does not ap- pear to have clearly defined national rules in this regard, and Hong Kong is absent from the list since such vehi- cles are totally prohibited in Hong Kong territory. Most countries stipulate a maximum speed above which motor power must cease, ranging from 24 km/h in Japan up to 32 km/h in Canada and the USA [23]. Most countries also require the machines to resemble normal bicycles and be fitted with pedals. Some countries allow three-wheeled (or even four-wheeled) electric bicycles, a few such as Singapore, specify two-wheeled use only. Table 2. Maximum power for electric motor assisted bicy- cles in various countries (constructed primarily using data from [23]). Country Motor power output Australia 200 W (currently t abling legislation to move to 250 W) Canada 500 W Europe 250 W India 250 W Japan 250 W New Zealand 300 W Singapore 200 W (note potential shift to 250 W in the near future) United Kingdom 200 W in UK law overridden by 250 W in European legislation United States of America 750 W The issue of pedelec is interesting: European and Sin- gaporean law in particular require a pedelec: when pow- ered, the motor must turn on within a certain time after the pedals are operated (such as one revolution of the pedals), and must turn off within a certain time after the pedals have been released (such as the equivalent of a quarter of a revolution at the original speed). This gives rise to the electric assist bicycle, the type of machine that requires a rider to contribute some effort to the motion, but allows the motor to assist to a certain extent. 4.2. Motor Type and Placement Most modern electric bicycles employ brushless DC mo- tors, usually flat hub mounted assemblies consisting of permanent magnet rotor and fixed armature coils ener- gised sequentially by a motor controller. This arrange- ment means that brushes and commutator are not req- uired, leading to potentially higher motor reliability. Ta- ble 3, listing typical technology choices for electric bicy- cles, also notes that brushed DC motors are sometimes used (they may be of lower cost). Hub mounted motors may be placed on either front wheel or rear wheel hub, as shown in Figures 1 (a) and (b). Direct drive systems will power the bicycle directly, and must cope with a wide range of speeds and conditions, whereas geared motors (usually employing planetary gearing) may allow greater torque at low speeds, and are better able to be adapted to use with different bicycle wheel diameters. Front wheel direct drive allows power to be applied to front wheel (through motor) as well as rear wheel (through pedals), providing a very stable power transfer arrangement. Although hub-mounted direct drive BLDC systems are most common, several chain drive variants exist, either using the existing bicycle chain in-line with the pedal chain ring (the motor normally mounted behind the ped- als), or utilising a separate chain attached to the pedal Copyright © 2012 SciRes. JTTs 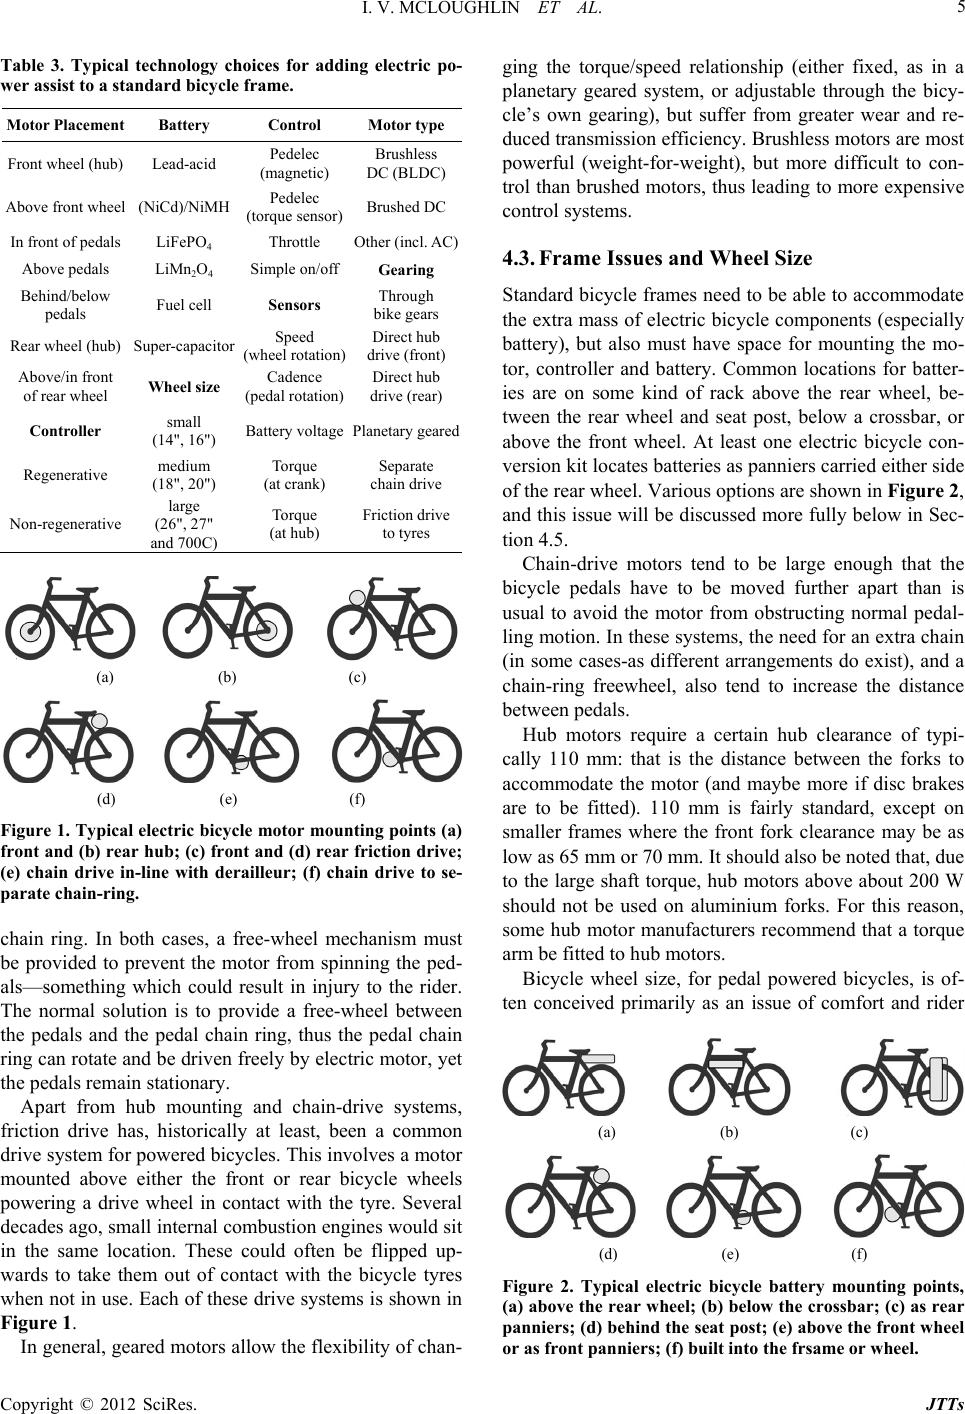 I. V. MCLOUGHLIN ET AL. 5 Table 3. Typical technology choices for adding electric po- wer assist to a standard bic ycle frame. Motor Placement Battery Control Motor type Front wheel (hub) Lead-acid Pedelec (magnetic) Brushless DC (BLDC) Above front wheel (NiCd)/NiMH Pedelec (torque sensor) Brushed DC In front of pedals LiFePO4 Throttle Other (incl. AC) Above pedals LiMn2O4 Simple on/off Gearing Behind/below pedals Fuel cell Sensors Through bike gears Rear wheel (hub) Super-capacitor Speed (wheel rotation) Direct hub drive (front) Above/in front of rear wheel Wheel size Cadence (pedal rotation) Direct hub drive (rear) Controller small (14", 16") Battery voltage Planetary ge ar e d Regenerative medium (18", 20") Torque (at crank) Separate chain drive Non-regenerative large (26", 27" and 700C) Torque (at hub) Friction drive to tyres (a) (b) (c) (d) (e) (f) Figure 1. Typical electric bicycle motor mounting points (a) front and (b) rear hub; (c) front and (d) rear friction drive; (e) chain drive in-line with derailleur; (f) chain drive to se- parate chain-ring. chain ring. In both cases, a free-wheel mechanism must be provided to prevent the motor from spinning the ped- als—something which could result in injury to the rider. The normal solution is to provide a free-wheel between the pedals and the pedal chain ring, thus the pedal chain ring can rotate and b e driven freely by electric motor, yet the pedals remain stationary. Apart from hub mounting and chain-drive systems, friction drive has, historically at least, been a common drive system for powered bicycles. This involves a motor mounted above either the front or rear bicycle wheels powering a drive wheel in contact with the tyre. Several decades ago, small internal combustion engines would sit in the same location. These could often be flipped up- wards to take them out of contact with the bicycle tyres when not in use. Each of these drive systems is shown in Figure 1. In general, geared motors allow the flexibility of chan- ging the torque/speed relationship (either fixed, as in a planetary geared system, or adjustable through the bicy- cle’s own gearing), but suffer from greater wear and re- duced transmission efficiency. Brushless motors are most powerful (weight-for-weight), but more difficult to con- trol than brushed motors, thus leading to more expensive control systems. 4.3. Frame Issues and Wheel Size Standard bicycle frames need to be able to accommodate the extra mass of electric bicycle components (especially battery), but also must have space for mounting the mo- tor, controller and battery. Common locations for batter- ies are on some kind of rack above the rear wheel, be- tween the rear wheel and seat post, below a crossbar, or above the front wheel. At least one electric bicycle con- version kit locates batteries as panniers carried either side of the re ar wheel. V ar iou s op tio n s ar e sh own in Figure 2, and this issue will be discussed more fully below in Sec- tion 4.5. Chain-drive motors tend to be large enough that the bicycle pedals have to be moved further apart than is usual to avoid the motor from obstructing normal pedal- ling motion. In these systems, the need for an extra chain (in some cases-as different arrangements do exist), and a chain-ring freewheel, also tend to increase the distance between pedals. Hub motors require a certain hub clearance of typi- cally 110 mm: that is the distance between the forks to accommodate the motor (and maybe more if disc brakes are to be fitted). 110 mm is fairly standard, except on smaller frames where the front fork clearance may be as low as 65 mm or 70 mm. It should also be noted that, due to the large shaft torque, hub motors above about 200 W should not be used on aluminium forks. For this reason, some hub motor manufacturers recommend that a torque arm be fitted to hub motors. Bicycle wheel size, for pedal powered bicycles, is of- ten conceived primarily as an issue of comfort and rider (a) (b) (c) (d) (e) (f) Figure 2. Typical electric bicycle battery mounting points, (a) above the rear wheel; (b) below the crossbar; (c) as rear panniers; (d) behind the seat post; (e) above the front wheel or as front panniers; (f) built into the frsame or wheel. Copyright © 2012 SciRes. JTTs 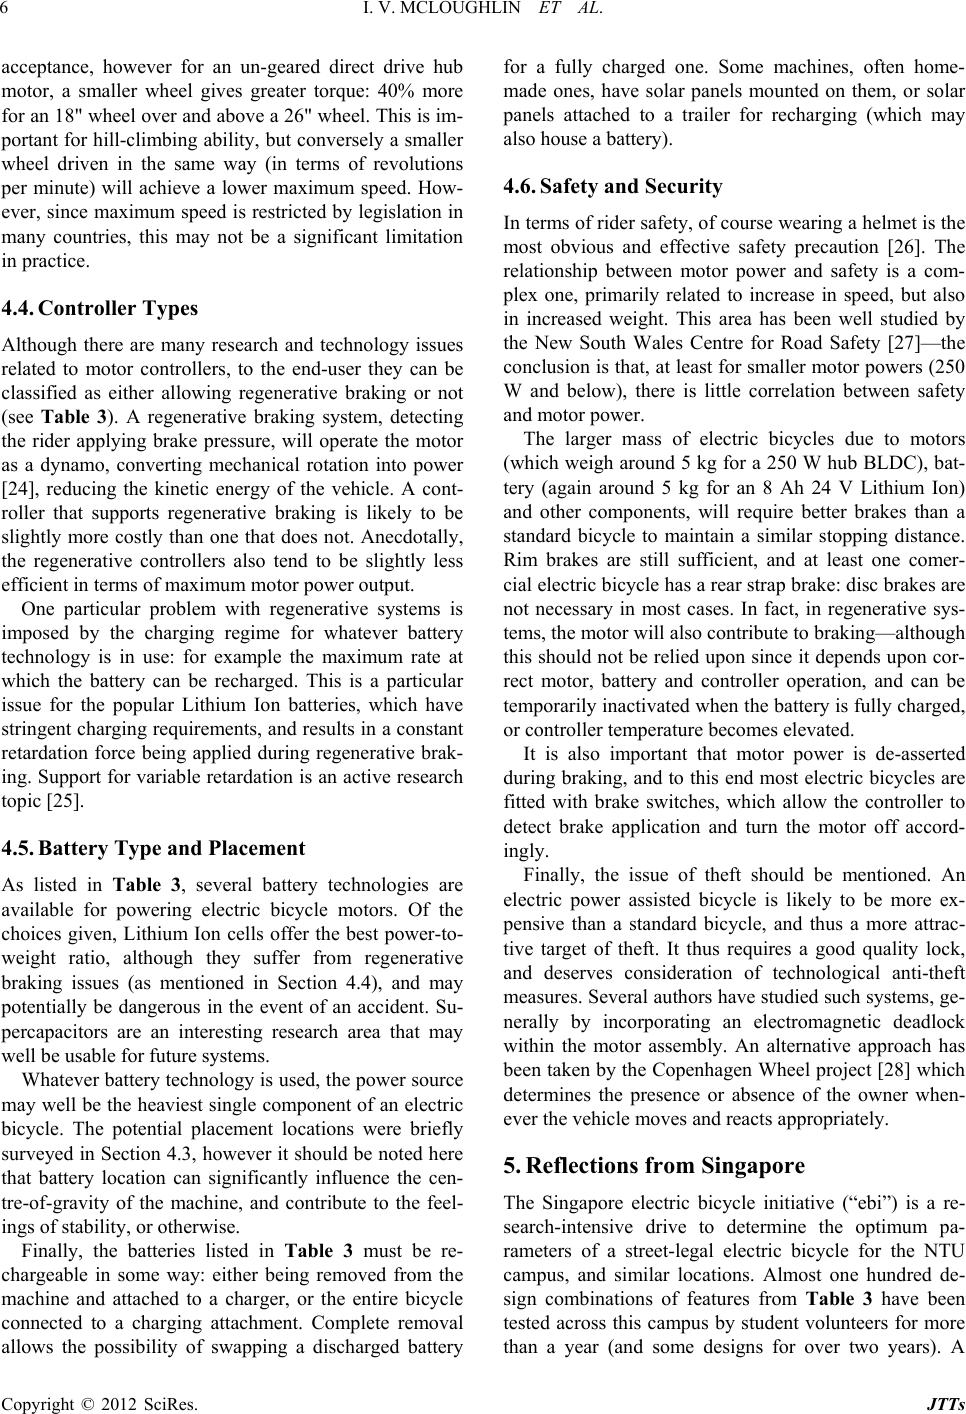 I. V. MCLOUGHLIN ET AL. 6 acceptance, however for an un-geared direct drive hub motor, a smaller wheel gives greater torque: 40% more for an 18 " wheel over an d above a 26 " wheel. Th is is im- portant for hill-climbing ability, but co nversely a smaller wheel driven in the same way (in terms of revolutions per minute) will achieve a lower maximum speed. How- ever, since maximum speed is restricted by legislation in many countries, this may not be a significant limitation in practice. 4.4. Controller Types Although there are many research and technology issues related to motor controllers, to the end-user they can be classified as either allowing regenerative braking or not (see Table 3). A regenerative braking system, detecting the rider applying brake pressure, will operate the motor as a dynamo, converting mechanical rotation into power [24], reducing the kinetic energy of the vehicle. A cont- roller that supports regenerative braking is likely to be slightly more costly than one that does not. Anecdotally, the regenerative controllers also tend to be slightly less efficient in terms of maximum motor power output. One particular problem with regenerative systems is imposed by the charging regime for whatever battery technology is in use: for example the maximum rate at which the battery can be recharged. This is a particular issue for the popular Lithium Ion batteries, which have stringent charging requirements, and results in a constant retardation force being applied during regenerative brak- ing. Support for variable retardatio n is an active research topic [25]. 4.5. Battery Type and Placement As listed in Table 3, several battery technologies are available for powering electric bicycle motors. Of the choices given, Lithium Ion cells offer the best power-to- weight ratio, although they suffer from regenerative braking issues (as mentioned in Section 4.4), and may potentially be dangerous in the event of an accident. Su- percapacitors are an interesting research area that may well be usable for fut ure sy st ems. Whatever battery technology is used, the power source may well be the heaviest single component of an electric bicycle. The potential placement locations were briefly surveyed in Section 4.3, however it should be noted here that battery location can significantly influence the cen- tre-of-gravity of the machine, and contribute to the feel- ings of stability, or otherwise. Finally, the batteries listed in Table 3 must be re- chargeable in some way: either being removed from the machine and attached to a charger, or the entire bicycle connected to a charging attachment. Complete removal allows the possibility of swapping a discharged battery for a fully charged one. Some machines, often home- made ones, have solar panels mounted on them, or solar panels attached to a trailer for recharging (which may also house a battery). 4.6. Safety and Security In terms of rider safety, of course wearing a helmet is the most obvious and effective safety precaution [26]. The relationship between motor power and safety is a com- plex one, primarily related to increase in speed, but also in increased weight. This area has been well studied by the New South Wales Centre for Road Safety [27]—the conclusion is that, at least for smaller motor powers (250 W and below), there is little correlation between safety and motor power. The larger mass of electric bicycles due to motors (which weigh around 5 kg for a 250 W hub BLDC), bat- tery (again around 5 kg for an 8 Ah 24 V Lithium Ion) and other components, will require better brakes than a standard bicycle to maintain a similar stopping distance. Rim brakes are still sufficient, and at least one comer- cial electric bicycle has a rear strap brake: disc brakes are not necessary in most cases. In fact, in regenerative sys- tems, the motor will also contribute to braking—althoug h this should not be relied upon since it depends upon cor- rect motor, battery and controller operation, and can be temporarily inactivated when th e battery is fully charged, or controller temperature becomes elevated. It is also important that motor power is de-asserted during braking, and to this end most electric bicycles are fitted with brake switches, which allow the controller to detect brake application and turn the motor off accord- ingly. Finally, the issue of theft should be mentioned. An electric power assisted bicycle is likely to be more ex- pensive than a standard bicycle, and thus a more attrac- tive target of theft. It thus requires a good quality lock, and deserves consideration of technological anti-theft measures. Several authors have studied such systems, ge- nerally by incorporating an electromagnetic deadlock within the motor assembly. An alternative approach has been taken by the Copenhagen Wheel project [28] which determines the presence or absence of the owner when- ever the vehicle moves and reacts appropriately. 5. Reflections from Singapore The Singapore electric bicycle initiative (“ebi”) is a re- search-intensive drive to determine the optimum pa- rameters of a street-legal electric bicycle for the NTU campus, and similar locations. Almost one hundred de- sign combinations of features from Table 3 have been tested across this campus by student volunteers for more than a year (and some designs for over two years). A Copyright © 2012 SciRes. JTTs 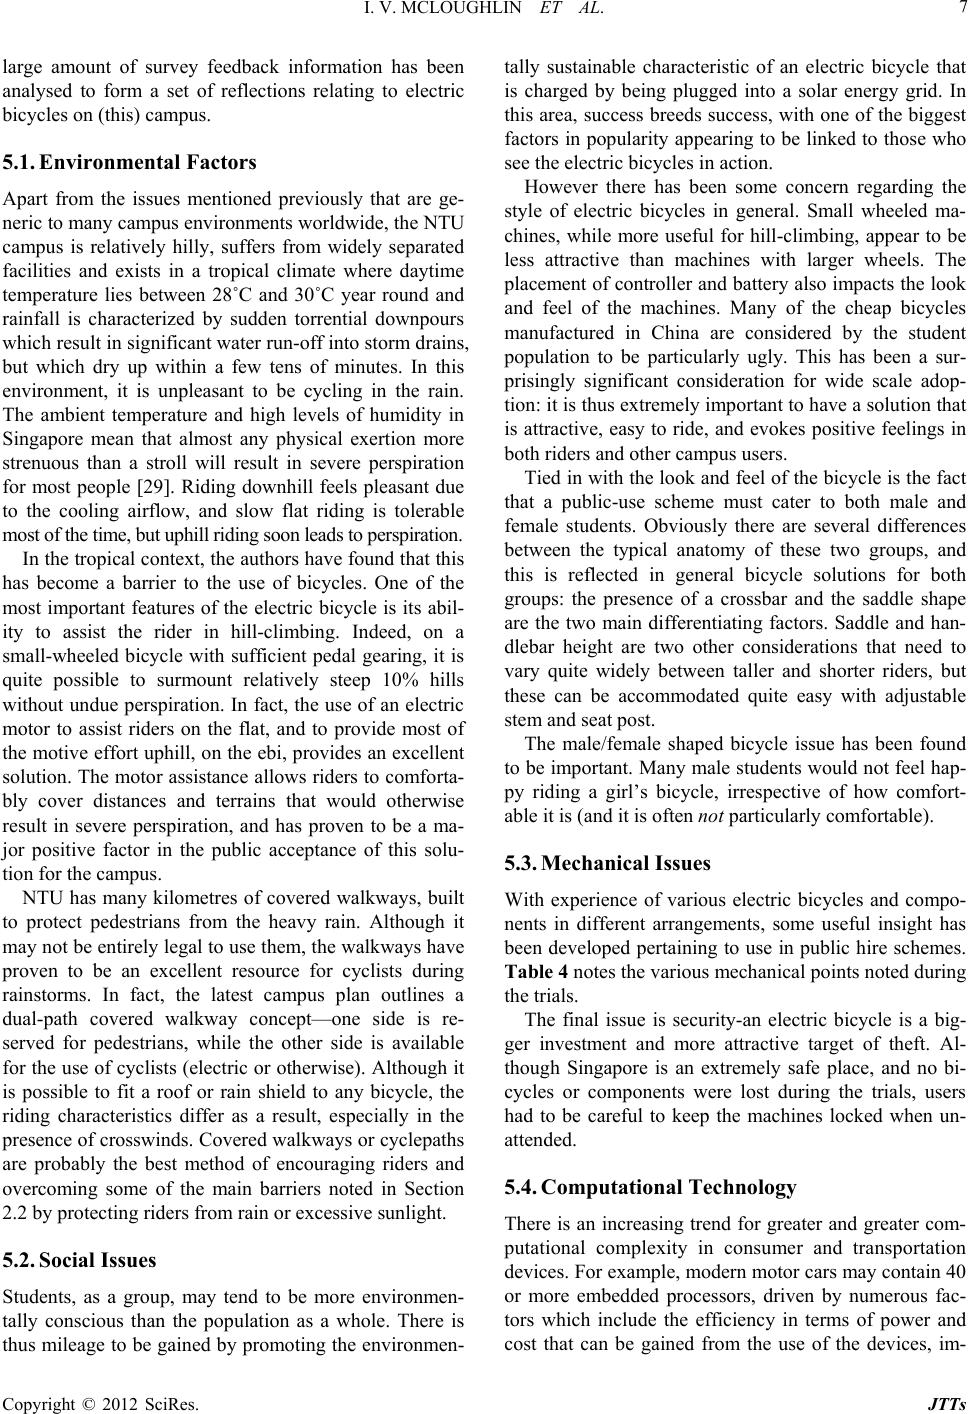 I. V. MCLOUGHLIN ET AL. 7 large amount of survey feedback information has been analysed to form a set of reflections relating to electric bicycles on (this) campus. 5.1. Environmental Factors Apart from the issues mentioned previously that are ge- neric to many campus environments worldwide, the NTU campus is relatively hilly, suffers from widely separated facilities and exists in a tropical climate where daytime temperature lies between 28˚C and 30˚C year round and rainfall is characterized by sudden torrential downpours which result in significant water run- off into sto rm drains, but which dry up within a few tens of minutes. In this environment, it is unpleasant to be cycling in the rain. The ambient temperature and high levels of humidity in Singapore mean that almost any physical exertion more strenuous than a stroll will result in severe perspiration for most people [29]. Riding downhill feels pleasant due to the cooling airflow, and slow flat riding is tolerable most of the time, but uphill riding soon leads to perspiration. In the tropical context, the authors hav e found that this has become a barrier to the use of bicycles. One of the most important features of the electric bicycle is its abil- ity to assist the rider in hill-climbing. Indeed, on a small-wheeled bicycle with sufficient pedal gearing, it is quite possible to surmount relatively steep 10% hills without undue p erspiration. In fact, the use o f an electric motor to assist riders on the flat, and to provide most of the motive effort uphill, on the ebi, provides an excellent solution. The motor assistance allows riders to comforta- bly cover distances and terrains that would otherwise result in severe perspiration, and has proven to be a ma- jor positive factor in the public acceptance of this solu- tion for the campus. NTU has many kilometres of covered walkways, built to protect pedestrians from the heavy rain. Although it may not be entirely legal to use them, the walkways have proven to be an excellent resource for cyclists during rainstorms. In fact, the latest campus plan outlines a dual-path covered walkway concept—one side is re- served for pedestrians, while the other side is available for the use of cyclists (electric or otherwise). Although it is possible to fit a roof or rain shield to any bicycle, the riding characteristics differ as a result, especially in the presence of crosswinds. Covered walkways or cyclepaths are probably the best method of encouraging riders and overcoming some of the main barriers noted in Section 2.2 by protecting riders from rain or excessive sunlight. 5.2. Social Issues Students, as a group, may tend to be more environmen- tally conscious than the population as a whole. There is thus mileage to be gained by promoting the environmen- tally sustainable characteristic of an electric bicycle that is charged by being plugged into a solar energy grid. In this area, success breeds success, with one of the biggest factors in popularity appearing to be linked to those who see the electric bicycles in action. However there has been some concern regarding the style of electric bicycles in general. Small wheeled ma- chines, while more useful for hill-climbing, appear to be less attractive than machines with larger wheels. The placement of controller and battery also impacts the look and feel of the machines. Many of the cheap bicycles manufactured in China are considered by the student population to be particularly ugly. This has been a sur- prisingly significant consideration for wide scale adop- tion: it is thus extremely important to have a solu tion that is attractive, easy to ride, and evokes positive feelings in both riders and other campus users. Tied in with the look and feel of the bicycle is the fact that a public-use scheme must cater to both male and female students. Obviously there are several differences between the typical anatomy of these two groups, and this is reflected in general bicycle solutions for both groups: the presence of a crossbar and the saddle shape are the two main differentiating factors. Saddle and han- dlebar height are two other considerations that need to vary quite widely between taller and shorter riders, but these can be accommodated quite easy with adjustable stem and seat post. The male/female shaped bicycle issue has been found to be important. Many male students would not feel hap- py riding a girl’s bicycle, irrespective of how comfort- able it is (and it is often not particularly comfortable). 5.3. Mechanical Issues With experience of various electric bicycles and compo- nents in different arrangements, some useful insight has been developed pertaining to use in public hire schemes. Table 4 notes the various mechanical points noted during the trials. The final issue is security-an electric bicycle is a big- ger investment and more attractive target of theft. Al- though Singapore is an extremely safe place, and no bi- cycles or components were lost during the trials, users had to be careful to keep the machines locked when un- attended. 5.4. Computational Technology There is an increasing trend for greater and greater com- putational complexity in consumer and transportation devices. For example, modern motor cars may contain 40 or more embedded processors, driven by numerous fac- tors which include the efficiency in terms of power and cost that can be gained from the use of the devices, im- Copyright © 2012 SciRes. JTTs  I. V. MCLOUGHLIN ET AL. 8 Table 4. Mechanical issues identified during the trials. Motor cogging is a problem, especially with larger direct drive BLDC motors, causing a noisy drive that is jerky at low speed. The centre of gravity of bicycles, especially with high battery placement, can lead to instability. Falls when mounting/dismounting are common. Front wheel drive motors tend to cause over-steer during acceleration. Heavy bicycles with high-mounted batteries, when parked, are dangerous if knocked over. Hub motors should not be used with alloy forks, due to danger of fracture (although 200 W and below may be acceptable). The changed centre-of-gravity usually prevents a actory-fitted kickstand from operating correctly. Torque arms are mandated for larger hub motors, where torque can be sufficient to rotate the fixed axle, undo the wheel-nuts and break the drive cable. Some of the geared hub motor s available on the market are asymmetrical (rear motors should be, to accommodate the gear block, but front motors are often the same). This leads to difficulties with rim brakes. Chain-drive systems experience enhanced chain, gear and derailleur wear. provements in operational effectiveness, additional fea- tures and so on. The advantages in having a perceived high-technology solution for advanced vehicles should also not be under-estimated as a selling point. Bicycles, similarly to motor cars, have also been equipped with computers for many years-cycling computers can track speed, distance, cadence and other attributes of a users travel. For electric bicycles, the use of modern BLDC motors necessitates relatively complex control algorithms, usu- ally provided by a simple microcontroller. These bicycles thus already incorporate a simple computer, which can conceivably also be used to provide standard bicycle computer functions, perhaps augmented by the BLDC controller access to additional sensing information. Moving upward in technology (and requiring substan- tially more computing power), GPS-assisted mapping and navigation systems are as useful for bicycles as they are for cars, moderated mainly by the reduced range of most cycle riders compared to cars (i.e. they are more likely to confine their journeys to areas that they are al- ready familiar with). Electric vehicles of all types can benefit from energy-aware route guidance—for example how best to navigate from point A to point B given the amount of energy available, knowledge of battery char- acteristics and the usage patterns of the current rider (which can be tracked or possibly inferred as a journey progresses). For the NTU electric bicycle scheme, Android touch- screen computers have been provided for every machine. A custom navigation solution for the university cam- pus, which encodes campus points of interest, pedestrian Figure 3. Screen shots of the Android eBike application show- ing navigation endpoint (top) and current location with des- tination search bar (bottom). areas, high traffic areas and safety blackspots, has been written, called the eBike app (see Figure 3). This is based upon an OpenStreetMaps dataset and a community fork of the AndNav2 application. The NTU eBike app is open source, freely available for download and modification. In addition to navigation capabilities, IEEE802.11 com- munications and a campus server allow each bicycle to periodically announce their locations, receive messages, and access location-aware services. These include social networking-based applications which enable riders to know where their friends are currently riding, participate in campus discovery tours, operate a distance-based charg- ing scheme and so on. Although the energy-saving features of the current campus bicycle computers are not particularly significant, the usability aspects are important. These can be classi- fied into social or technical spheres. Apart from the so- cial aspects already mentioned, the authors have continu- ally attempted to improve the attractiveness of these bi- cycles for campus users (who are predominantly the un- dergraduate stud ent population), in many ways including choice of frame, colour scheme, styling, accessories and so on. The use of an Android-based touch-screen system, one of the most desirable and advanced computing solu- tions currently available, increases the desirability of the bikes for many users. Technical benefits of the system Copyright © 2012 SciRes. JTTs 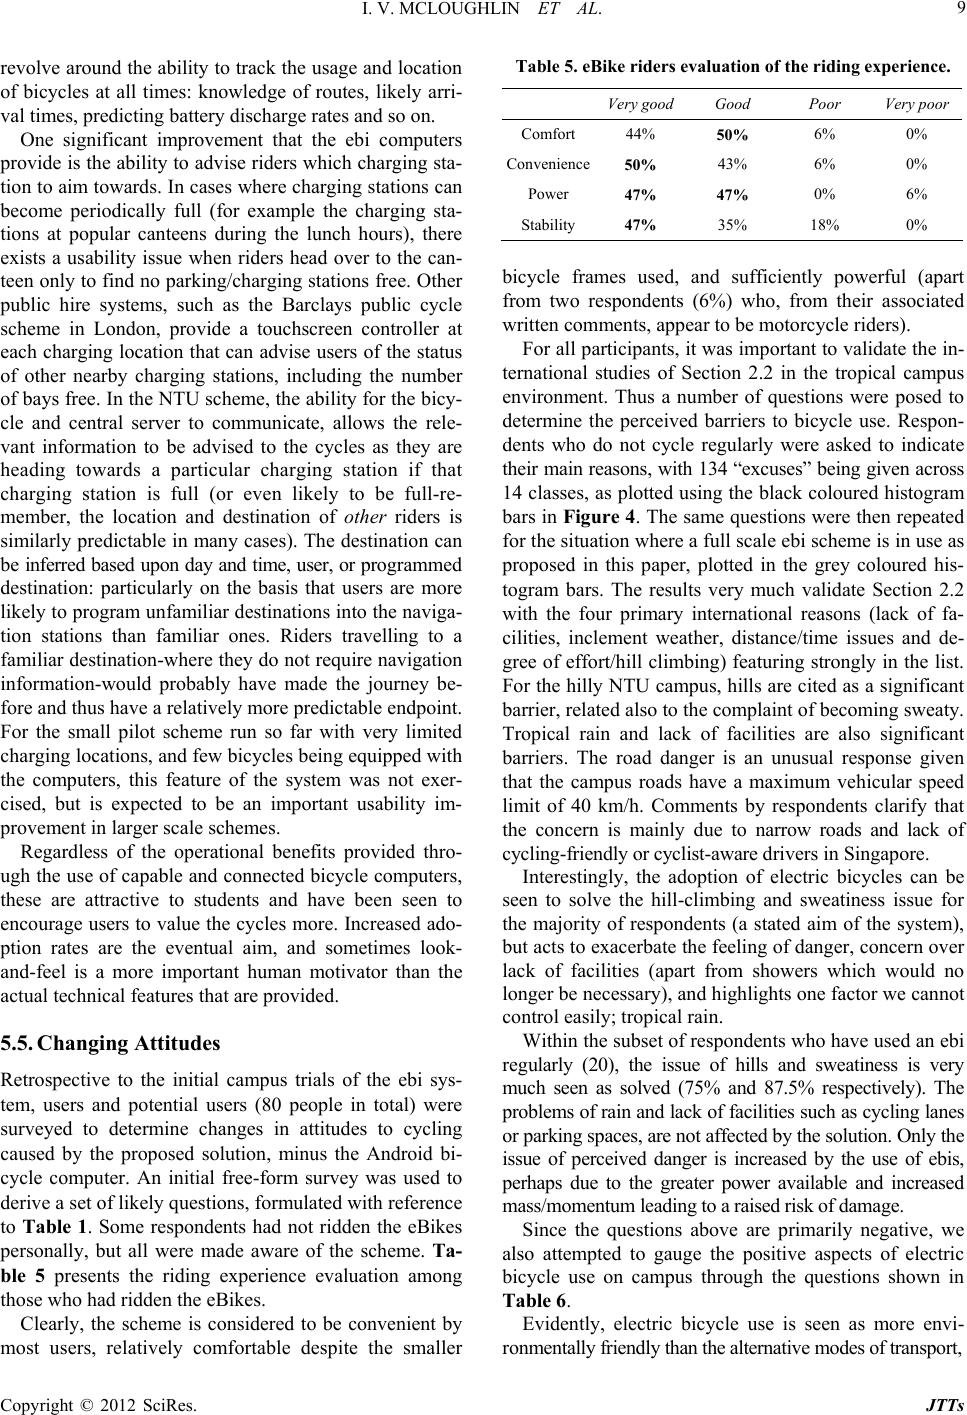 I. V. MCLOUGHLIN ET AL. 9 revolve around the ab ility to track the usage and location of bicycles at all times: knowledge of routes, likely arri- val times, predicting battery discharge rates and so on. One significant improvement that the ebi computers provide is the ability to advise rid ers which charging sta- tion to aim towards. In cases where charging stations can become periodically full (for example the charging sta- tions at popular canteens during the lunch hours), there exists a usability issue when riders head over to the can- teen only to find no parking/charging stations free. Other public hire systems, such as the Barclays public cycle scheme in London, provide a touchscreen controller at each charging location that can advise users of the status of other nearby charging stations, including the number of bays free. In the NTU scheme, the ability for the bicy- cle and central server to communicate, allows the rele- vant information to be advised to the cycles as they are heading towards a particular charging station if that charging station is full (or even likely to be full-re- member, the location and destination of other riders is similarly predictable in many cases). The destination can be inferred based upon day and time, user, or pro gr amm ed destination: particularly on the basis that users are more likely to program unf amiliar destinations into the nav iga- tion stations than familiar ones. Riders travelling to a familiar destination-where they do not require navigation information-would probably have made the journey be- fore and thus have a relatively more predictable endpoint. For the small pilot scheme run so far with very limited charging locations, and few bicycles being equipped with the computers, this feature of the system was not exer- cised, but is expected to be an important usability im- provement in larger scale schemes. Regardless of the operational benefits provided thro- ugh the use of capable and connected bicycle computers, these are attractive to students and have been seen to encourage users to value the cycles more. Increased ado- ption rates are the eventual aim, and sometimes look- and-feel is a more important human motivator than the actual technical features that are provided. 5.5. Changing Attitudes Retrospective to the initial campus trials of the ebi sys- tem, users and potential users (80 people in total) were surveyed to determine changes in attitudes to cycling caused by the proposed solution, minus the Android bi- cycle computer. An initial free-form survey was used to derive a set of likely questions, formulated with reference to Table 1. Some respondents had not ridden the eBikes personally, but all were made aware of the scheme. Ta- ble 5 presents the riding experience evaluation among those who had ridden the eBikes. Clearly, the scheme is considered to be convenient by most users, relatively comfortable despite the smaller Table 5. eBike riders evaluation of the riding experience. Very goodGood Poor Very poor Comfort 44% 50% 6% 0% Convenience 50% 43% 6% 0% Power 47% 47% 0% 6% Stability 47% 35% 18% 0% bicycle frames used, and sufficiently powerful (apart from two respondents (6%) who, from their associated written comments, appear to be motorcycle riders). For all participants, it was important to validate the in - ternational studies of Section 2.2 in the tropical campus environment. Thus a number of questions were posed to determine the perceived barriers to bicycle use. Respon- dents who do not cycle regularly were asked to indicate their main reasons, with 134 “excuses” being given across 14 classes, as plotted using the black coloured histogram bars in Figure 4. The same questions were then repeated for the situation where a full scale ebi scheme is in use as proposed in this paper, plotted in the grey coloured his- togram bars. The results very much validate Section 2.2 with the four primary international reasons (lack of fa- cilities, inclement weather, distance/time issues and de- gree of effort/hill climbing) featuring strongly in the list. For the hilly NTU campus, hills are cited as a significant barrier, related also to the complaint o f beco ming sweaty. Tropical rain and lack of facilities are also significant barriers. The road danger is an unusual response given that the campus roads have a maximum vehicular speed limit of 40 km/h. Comments by respondents clarify that the concern is mainly due to narrow roads and lack of cycling-friendly or cyclist-aware drivers in Singapore. Interestingly, the adoption of electric bicycles can be seen to solve the hill-climbing and sweatiness issue for the majority of respondents (a stated aim of the system), but acts to exacerbate the feeling of danger, concern over lack of facilities (apart from showers which would no longer be necessary), and highlights one factor we cannot control easily; tropical rain. Within the subset of respondents who have used an ebi regularly (20), the issue of hills and sweatiness is very much seen as solved (75% and 87.5% respectively). The problems of rain and lack of facilities such as cycling lanes or parking spaces, are not affected by the solution. Only the issue of perceived danger is increased by the use of ebis, perhaps due to the greater power available and increased mass/momentum leading to a raised risk of damage. Since the questions above are primarily negative, we also attempted to gauge the positive aspects of electric bicycle use on campus through the questions shown in Table 6. Evidently, electric bicycle use is seen as more envi- ronmentally friendly than the alternative modes of transport, Copyright © 2012 SciRes. JTTs 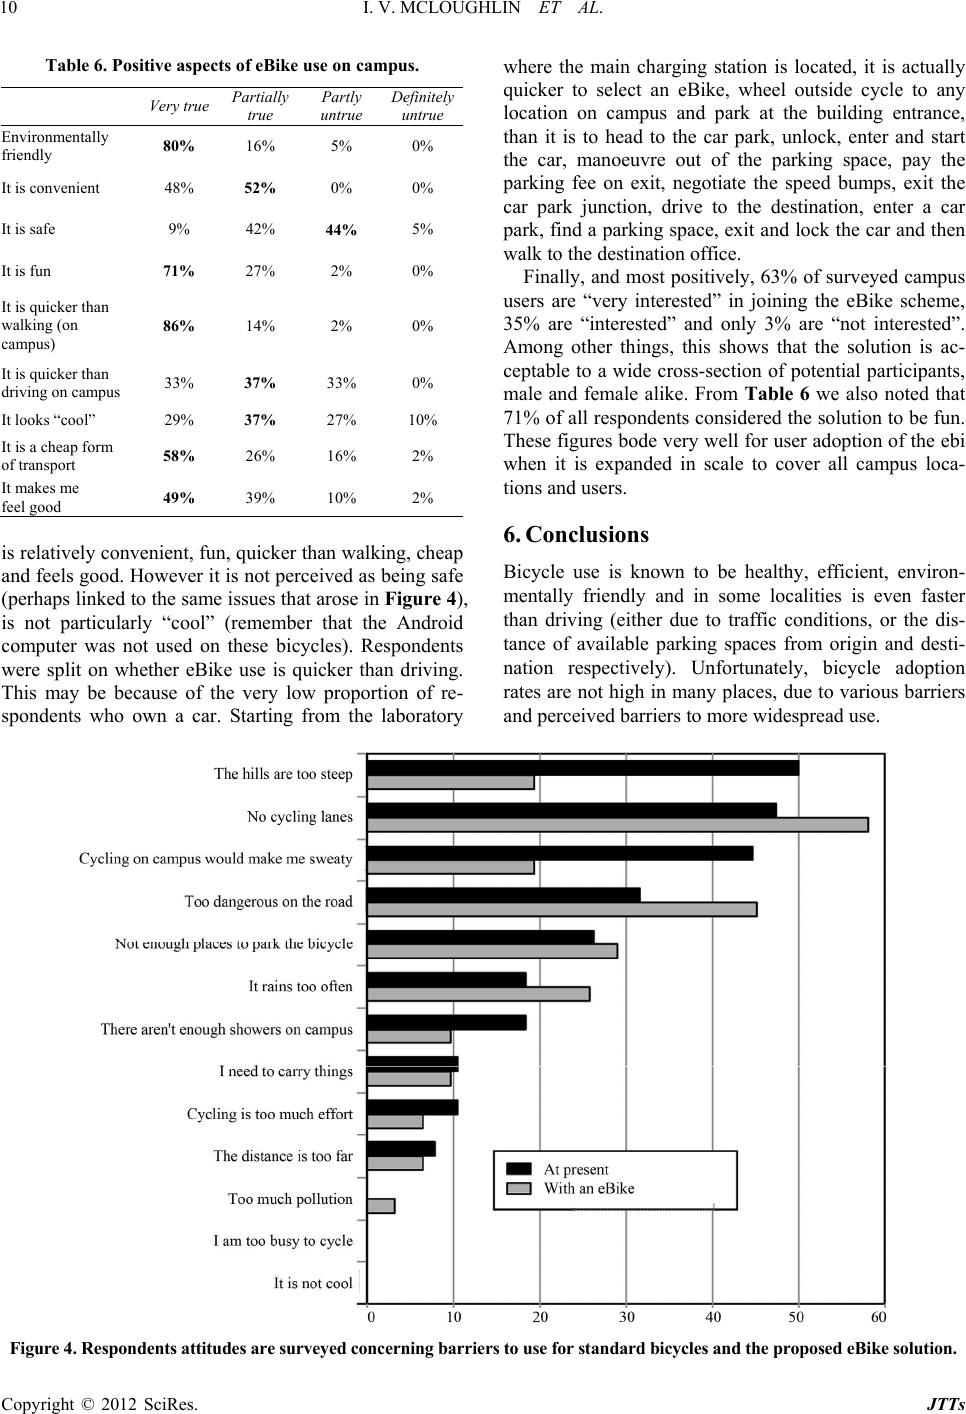 I. V. MCLOUGHLIN ET AL. Copyright © 2012 SciRes. JTTs 10 Table 6. Positive aspects of eBike use on campus. Very true Partially true Partly untrue Definitely untrue Environmentally friendly 80% 16% 5% 0% It is convenient 48% 52% 0% 0% It is safe 9% 4 2% 44% 5% It is fun 71% 27% 2% 0% It is quicker than walking (on campus) 86% 14% 2% 0% It is quicker than driving on campus 33% 37% 33% 0% It looks “cool” 29% 37% 27% 10% It is a cheap form of transport 58% 26% 16% 2% It makes me feel good 49% 39% 10% 2% is relatively conv enient, fun, q uicker than walk ing, cheap and feels good. However it is not perceived as being safe (perhaps linked to the same issues that arose in Figure 4), is not particularly “cool” (remember that the Android computer was not used on these bicycles). Respondents were split on whether eBike use is quicker than driving. This may be because of the very low proportion of re- spondents who own a car. Starting from the laboratory where the main charging station is located, it is actually quicker to select an eBike, wheel outside cycle to any location on campus and park at the building entrance, than it is to head to the car park, unlock, enter and start the car, manoeuvre out of the parking space, pay the parking fee on exit, negotiate the speed bumps, exit the car park junction, drive to the destination, enter a car park, find a parking space, exit and lock the car and then walk to the destination office. Finally, and most positiv ely, 63% of surveyed campus users are “very interested” in joining the eBike scheme, 35% are “interested” and only 3% are “not interested”. Among other things, this shows that the solution is ac- ceptable to a wide cross-section of potential participants, male and female alike. From Table 6 we also noted that 71% of all respondents considered the solution to be fun. These figures bode very well for user adoption of the ebi when it is expanded in scale to cover all campus loca- tions and users. 6. Conclusions Bicycle use is known to be healthy, efficient, environ- mentally friendly and in some localities is even faster than driving (either due to traffic conditions, or the dis- tance of available parking spaces from origin and desti- nation respectively). Unfortunately, bicycle adoption rates are not high in many places, due to various barriers and perceived barriers to more widespread use. Figure 4. Respondents attitudes are su rveyed con cerning barriers to use for s tandard bicycles and th e propos ed eBike solution . 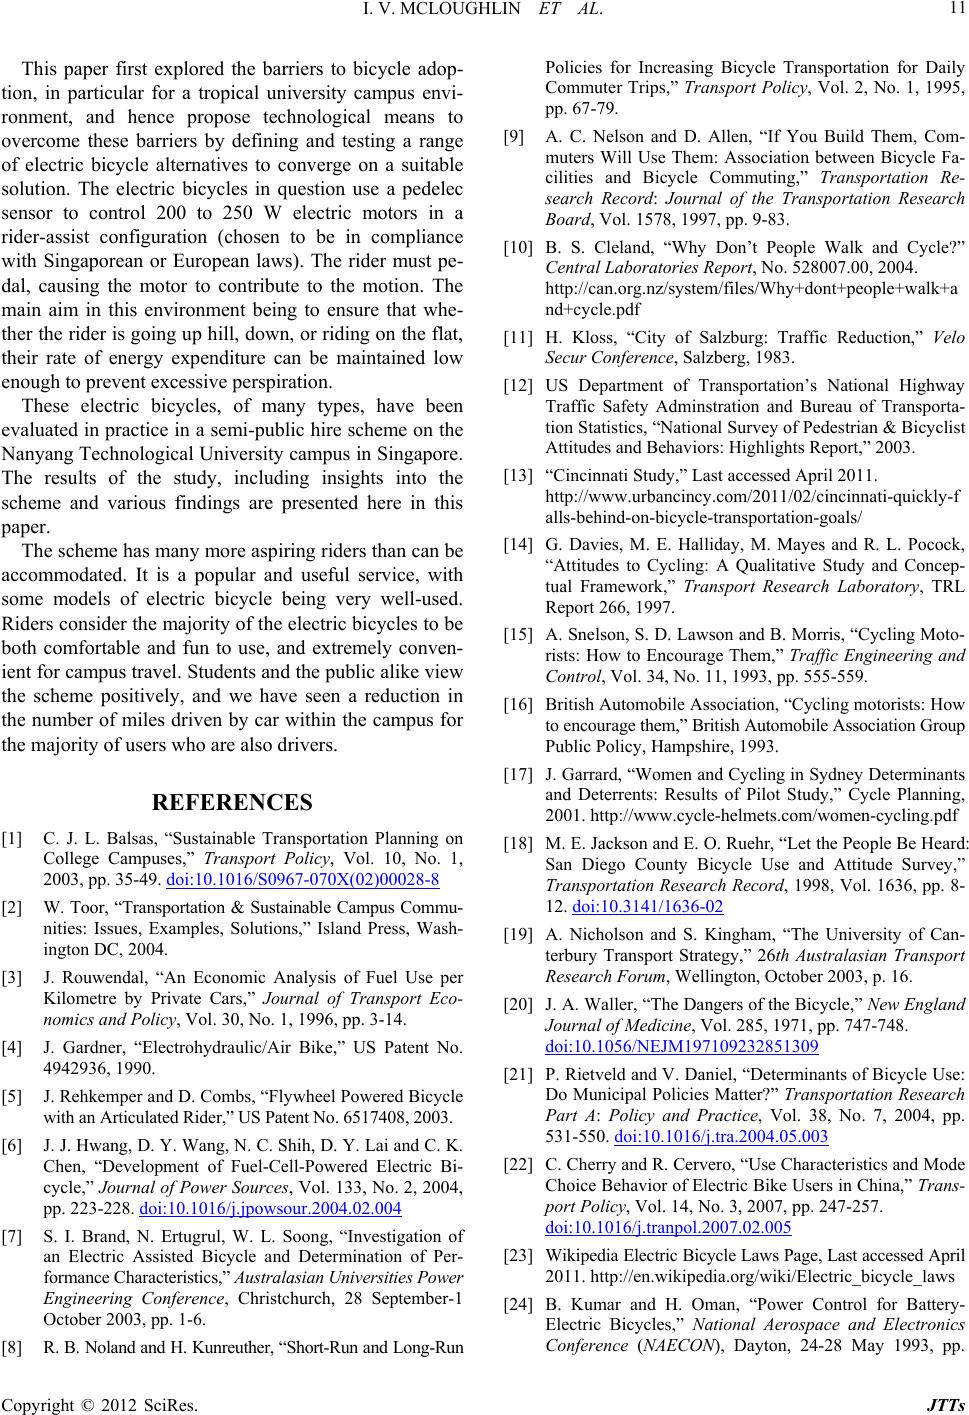 I. V. MCLOUGHLIN ET AL. 11 This paper first explored the barriers to bicycle adop- tion, in particular for a tropical university campus envi- ronment, and hence propose technological means to overcome these barriers by defining and testing a range of electric bicycle alternatives to converge on a suitable solution. The electric bicycles in question use a pedelec sensor to control 200 to 250 W electric motors in a rider-assist configuration (chosen to be in compliance with Singaporean or European laws). The rider must pe- dal, causing the motor to contribute to the motion. The main aim in this environment being to ensure that whe- ther the rider is going up hill, down, or riding on the flat, their rate of energy expenditure can be maintained low enough to prevent excessive perspiration. These electric bicycles, of many types, have been evaluated in practice in a semi-public hire scheme on the Nanyang Technological University campus in Singapore. The results of the study, including insights into the scheme and various findings are presented here in this paper. The scheme has many more aspiring riders than can be accommodated. It is a popular and useful service, with some models of electric bicycle being very well-used. Riders consider the majority of the electric bicycles to be both comfortable and fun to use, and extremely conven- ient for campus travel. Students and th e public alike view the scheme positively, and we have seen a reduction in the number of miles driven by car within the campus for the majority of users who are also dr ivers. REFERENCES [1] C. J. L. Balsas, “Sustainable Transportation Planning on College Campuses,” Transport Policy, Vol. 10, No. 1, 2003, pp. 35-49. doi:10.1016/S0967-070X(02)00028-8 [2] W. Toor, “Transportation & Sustainable Campus Commu- nities: Issues, Examples, Solutions,” Island Press, Wash- ington DC, 2004. [3] J. Rouwendal, “An Economic Analysis of Fuel Use per Kilometre by Private Cars,” Journal of Transport Eco- nomics and Policy, Vol. 30, No. 1, 1996, pp. 3-14. [4] J. Gardner, “Electrohydraulic/Air Bike,” US Patent No. 4942936, 1990. [5] J. Rehkemper and D. Combs, “Fly wheel Powe red Bicy cle with an Articulated Rider,” US Patent No. 6517408, 2003. [6] J. J. Hwang, D. Y. Wang, N. C. Shih, D. Y. Lai and C. K. Chen, “Development of Fuel-Cell-Powered Electric Bi- cycle,” Journal of Power Sources, Vol. 133, No. 2, 2004, pp. 223-228. doi:10.1016/j.jpowsour.2004.02.004 [7] S. I. Brand, N. Ertugrul, W. L. Soong, “Investigation of an Electric Assisted Bicycle and Determination of Per- formance Characteristics,” Australasian Universities Power Engineering Conference, Christchurch, 28 September-1 October 2003, pp. 1-6. [8] R. B. Noland and H. Kunreuther, “Short-Run and Long-Run Policies for Increasing Bicycle Transportation for Daily Commuter Trips,” Transport Policy, Vol. 2, No. 1, 1995, pp. 67-79. [9] A. C. Nelson and D. Allen, “If You Build Them, Com- muters Will Use Them: Association between Bicycle Fa- cilities and Bicycle Commuting,” Transportation Re- search Record: Journal of the Transportation Research Board, Vol. 1578, 1997, pp. 9-83. [10] B. S. Cleland, “Why Don’t People Walk and Cycle?” Central Laboratories Report, No. 528007.00, 2004. http://can.org.nz/system/files/Why+dont+people+walk+a nd+cycle.pdf [11] H. Kloss, “City of Salzburg: Traffic Reduction,” Velo Secur Conference, Salzberg, 1983. [12] US Department of Transportation’s National Highway Traffic Safety Adminstration and Bureau of Transporta- tion Statistics, “National Survey of Pedestrian & Bicyclist Attitudes and Behaviors: Highlights Report,” 2003. [13] “Cincinnati Study,” Last accessed April 2011. http://www.urbancincy.com/2011/02/cincinnati-quickly-f alls-behind-on-bicycle-transportation-goals/ [14] G. Davies, M. E. Halliday, M. Mayes and R. L. Pocock, “Attitudes to Cycling: A Qualitative Study and Concep- tual Framework,” Transport Research Laboratory, TRL Report 266, 1997. [15] A. Snelson, S. D. Lawson and B. Morris, “Cycling Moto- rists: How to Encourage Them,” Traffic Engineering and Control, Vol. 34, No. 11, 1993, pp. 555-559. [16] British Automobile Association, “Cycling motorists: How to encourage them,” British Automobile Association Group Public Policy, Hampshire, 1993. [17] J. Garrard, “Women and Cycling in Sydney Determinants and Deterrents: Results of Pilot Study,” Cycle Planning, 2001. http://www.cycle-helmets.com/women-cycling.pdf [18] M. E. Jackson and E. O. Ruehr, “Let the People Be Heard: San Diego County Bicycle Use and Attitude Survey,” Transportation Research Record, 1998, Vol. 1636, pp. 8- 12. doi:10.3141/1636-02 [19] A. Nicholson and S. Kingham, “The University of Can- terbury Transport Strategy,” 26th Australasian Transport Research Forum, Wellington, October 2003, p. 16. [20] J. A. Waller, “The Dangers of the Bicy cle,” New England Journal of Medicine, Vol. 285, 1971, pp. 747-748. doi:10.1056/NEJM197109232851309 [21] P. Rietveld and V. Daniel, “Determinants of Bicycle Use: Do Municipal Policies Matter?” Transportation Research Part A: Policy and Practice, Vol. 38, No. 7, 2004, pp. 531-550. doi:10.1016/j.tra.2004.05.003 [22] C. Cherry and R. Cervero, “Use Characteristics and Mode Choice Behavior of Electric Bike Users in China,” Trans- port Policy, Vol. 14, No. 3, 2007, pp. 247-257. doi:10.1016/j.tranpol.2007.02.005 [23] Wikipedia Electric Bicycle Laws Page, Last accessed April 2011. http://en.wikipedia.org/wiki/Electric_bicycle_laws [24] B. Kumar and H. Oman, “Power Control for Battery- Electric Bicycles,” National Aerospace and Electronics Conference (NAECON), Dayton, 24-28 May 1993, pp. Copyright © 2012 SciRes. JTTs  I. V. MCLOUGHLIN ET AL. 12 428-434. [25] S. Pay and Y. Baghzouz, “Effectiveness of Battery-Super- capacitor Combination in Electric Vehicles,” IEEE Pow er Technology Conference, Bologna, 23-26 June 2003, p. 6. [26] T. Wood and P. Milne, “Head Injuries to Pedal Cyclists and the Promotion of Helmet Use in Victoria, Australia,” Accident Analysis & Prevention, Vol. 20, No. 3, 1988, pp. 177-185. doi:10.1016/0001-4575(88)90002-4 [27] New South Wales Centre for Road Safety, “Power-Assis- ted Pedal Cycles: Proposal for a New AB Vehicle Defini- tion,” May 2009. [28] C. Outram, C. Ratti and A. Biderman, “The Copenhagen Wheel: An Innovative Electric Bicycle System That Har- nesses the Power of Real-Time Information and Crowd Sourcing,” Conference on Ecologic Vehicles & Renew- able Energies (EVER2010), Monaco, May 2010. [29] C. T. Davies, “Influence of Skin Temperature on Sweat- ing and Aerobic Performance during Severe Work,” Jour- nal of Applied Physiology, Vol. 47, No. 4, 1979, pp. 770- 777. Copyright © 2012 SciRes. JTTs
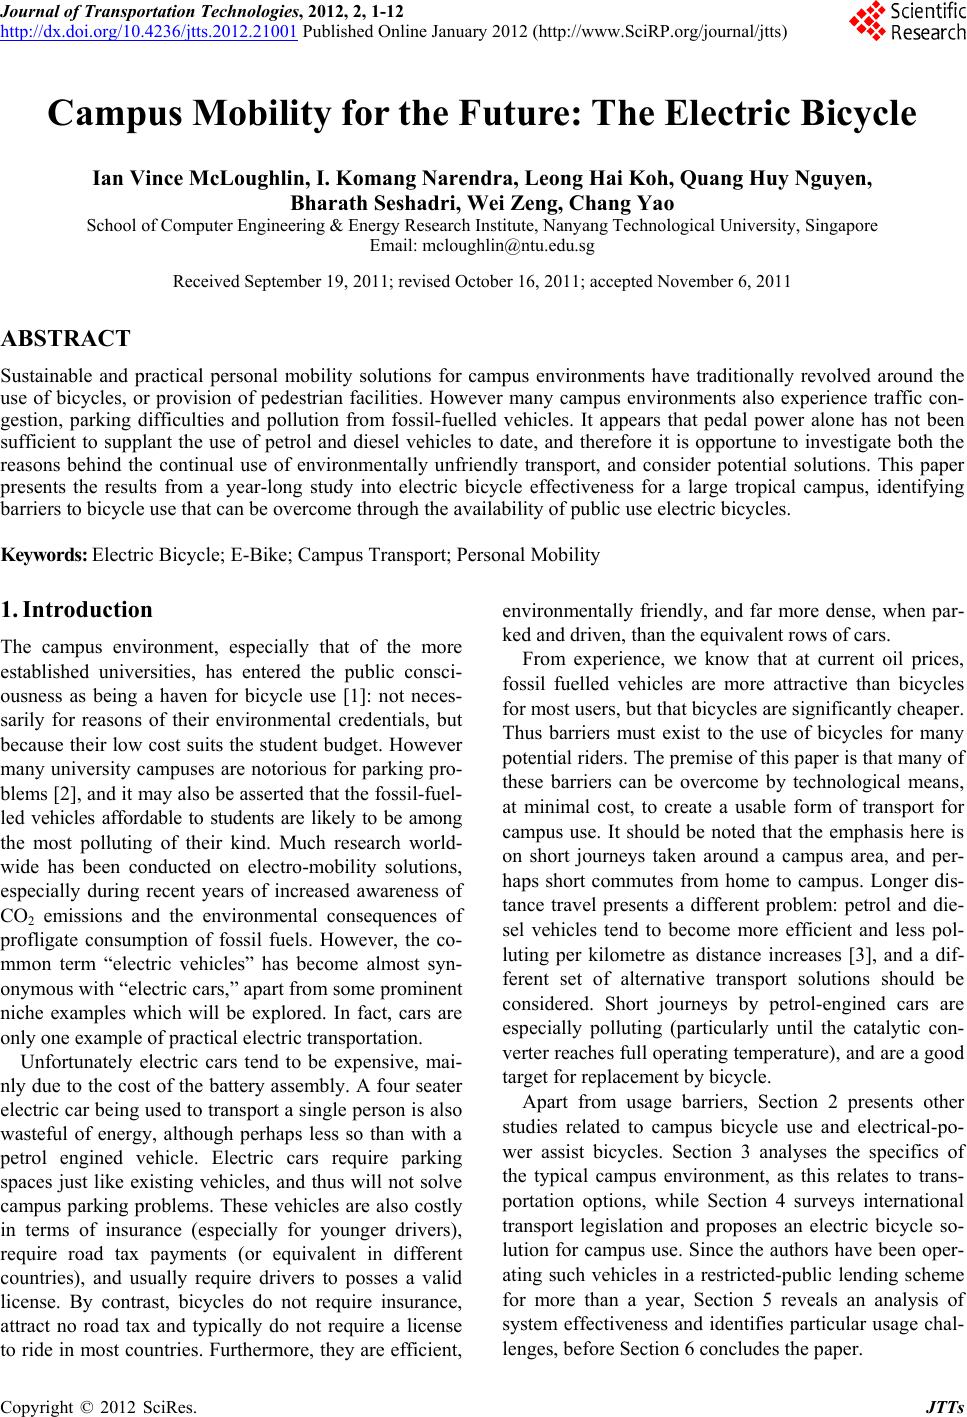
|