Paper Menu >>
Journal Menu >>
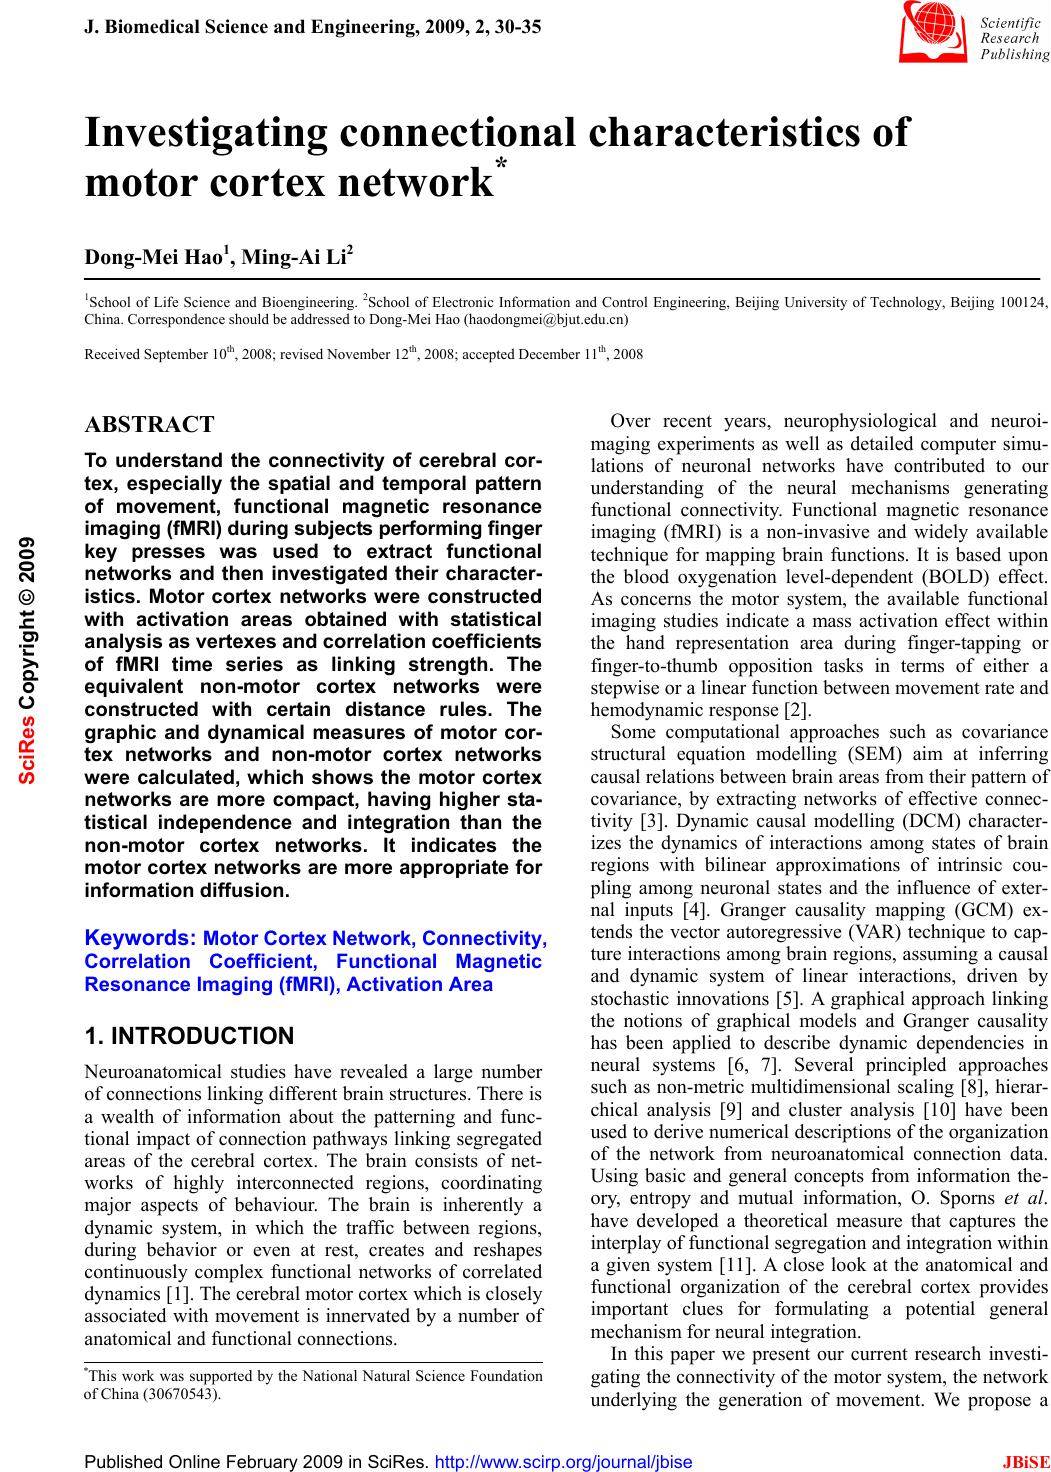 J. Biomedical Science and Engineering, 2009, 2, 30-35 Published Online February 2009 in SciRes. http://www.scirp.org/journal/jbise JBiSE Investigating connectional characteristics of motor cortex network* Dong-Mei Hao1, Ming-Ai Li2 1School of Life Science and Bioengineering. 2School of Electronic Information and Control Engineering, Beijing University of Technology, Beijing 100124, China. Correspondence should be addressed to Dong-Mei Hao (haodongmei@bjut.edu.cn) Received September 10th, 2008; revised November 12th, 2008; accepted December 11th, 2008 ABSTRACT To understand the connectivity of cerebral cor- tex, especially the spatial and temporal pattern of movement, functional magnetic resonance imaging (fMRI) during subjects performing finger key presses was used to extract functional networks and then investigated their character- istics. Motor cortex networks were constructed with activation areas obtained with statistical analysis as vertexes and correlation coefficients of fMRI time series as linking strength. The equivalent non-motor cortex networks were constructed with certain distance rules. The graphic and dynamical measures of motor cor- tex networks and non-motor cortex networks were calculated, which shows the motor cortex networks are more compact, having higher sta- tistical independence and integration than the non-motor cortex networks. It indicates the motor cortex networks are more appropriate for information diffusion. Keywords: Motor Cortex Network, Connectivity, Correlation Coefficient, Functional Magnetic Resonance Imaging (fMRI), Activation Area 1. INTRODUCTION Neuroanatomical studies have revealed a large number of connections linking different brain structures. There is a wealth of information about the patterning and func- tional impact of connection pathways linking segregated areas of the cerebral cortex. The brain consists of net- works of highly interconnected regions, coordinating major aspects of behaviour. The brain is inherently a dynamic system, in which the traffic between regions, during behavior or even at rest, creates and reshapes continuously complex functional networks of correlated dynamics [1]. The cerebral motor cortex which is closely associated with movement is innervated by a number of anatomical and functional connections. Over recent years, neurophysiological and neuroi- maging experiments as well as detailed computer simu- lations of neuronal networks have contributed to our understanding of the neural mechanisms generating functional connectivity. Functional magnetic resonance imaging (fMRI) is a non-invasive and widely available technique for mapping brain functions. It is based upon the blood oxygenation level-dependent (BOLD) effect. As concerns the motor system, the available functional imaging studies indicate a mass activation effect within the hand representation area during finger-tapping or finger-to-thumb opposition tasks in terms of either a stepwise or a linear function between movement rate and hemodynamic response [2]. Some computational approaches such as covariance structural equation modelling (SEM) aim at inferring causal relations between brain areas from their pattern of covariance, by extracting networks of effective connec- tivity [3]. Dynamic causal modelling (DCM) character- izes the dynamics of interactions among states of brain regions with bilinear approximations of intrinsic cou- pling among neuronal states and the influence of exter- nal inputs [4]. Granger causality mapping (GCM) ex- tends the vector autoregressive (VAR) technique to cap- ture interactions among brain regions, assuming a causal and dynamic system of linear interactions, driven by stochastic innovations [5]. A graphical approach linking the notions of graphical models and Granger causality has been applied to describe dynamic dependencies in neural systems [6, 7]. Several principled approaches such as non-metric multidimensional scaling [8], hierar- chical analysis [9] and cluster analysis [10] have been used to derive numerical descriptions of the organization of the network from neuroanatomical connection data. Using basic and general concepts from information the- ory, entropy and mutual information, O. Sporns et al. have developed a theoretical measure that captures the interplay of functional segregation and integration within a given system [11]. A close look at the anatomical and functional organization of the cerebral cortex provides important clues for formulating a potential general mechanism for neural integration. In this paper we present our current research investi- gating the connectivity of the motor system, the network underlying the generation of movement. We propose a *This work was supported by the National Natural Science Foundation of China (30670543). SciRes Copyright © 2009 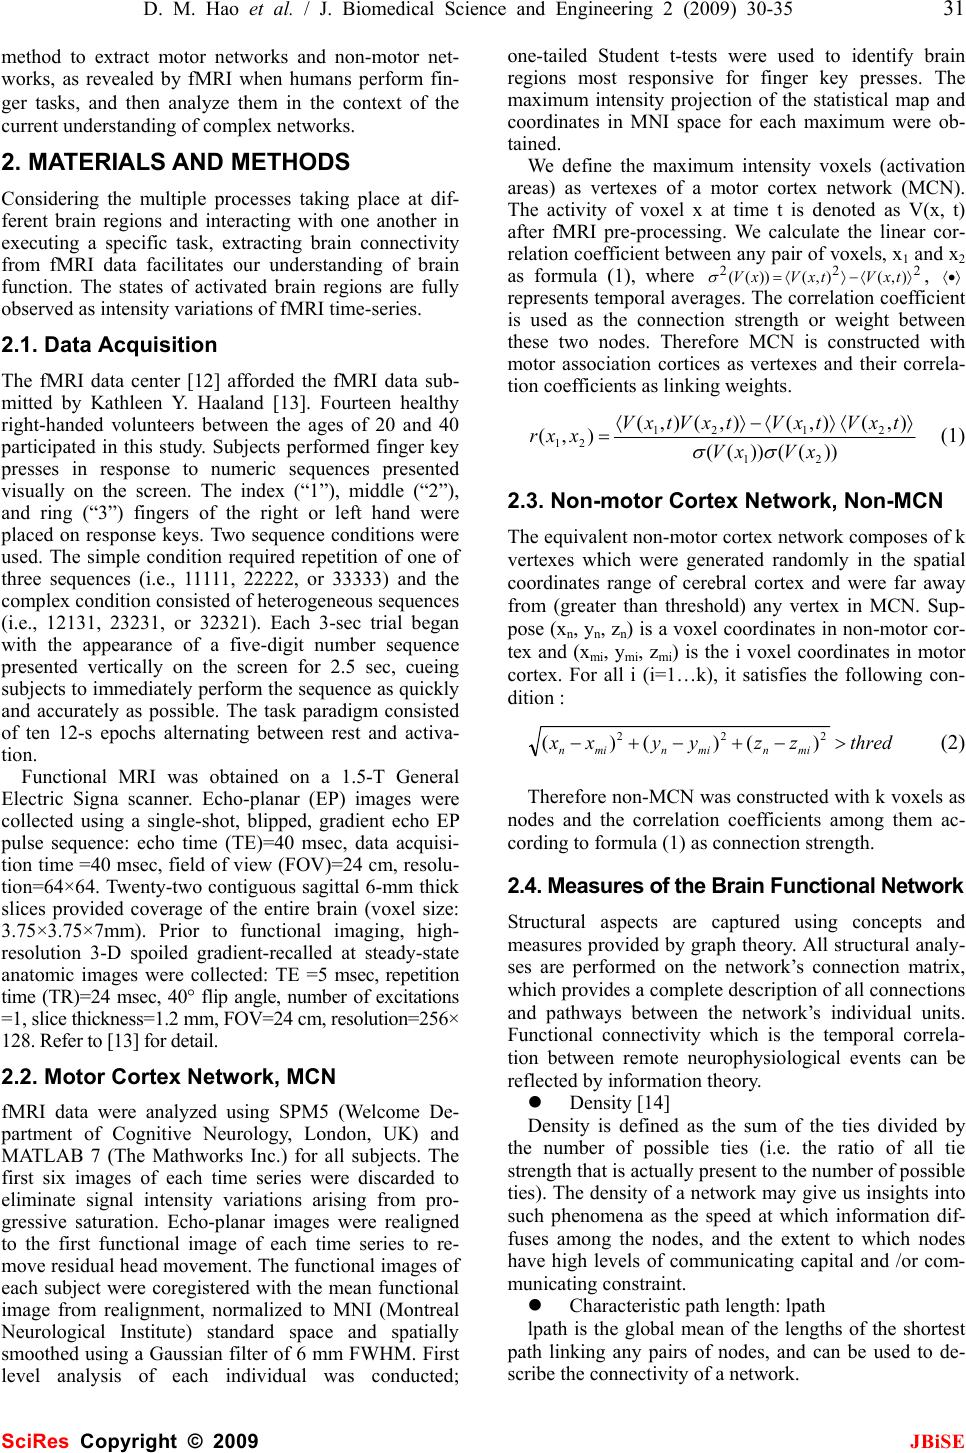 D. M. Hao et al. / J. Biomedical Science and Engineering 2 (2009) 30-35 31 SciRes Copyright © 2009 JBiSE method to extract motor networks and non-motor net- works, as revealed by fMRI when humans perform fin- ger tasks, and then analyze them in the context of the current understanding of complex networks. 2. MATERIALS AND METHODS Considering the multiple processes taking place at dif- ferent brain regions and interacting with one another in executing a specific task, extracting brain connectivity from fMRI data facilitates our understanding of brain function. The states of activated brain regions are fully observed as intensity variations of fMRI time-series. 2.1. Data Acquisition The fMRI data center [12] afforded the fMRI data sub- mitted by Kathleen Y. Haaland [13]. Fourteen healthy right-handed volunteers between the ages of 20 and 40 participated in this study. Subjects performed finger key presses in response to numeric sequences presented visually on the screen. The index (“1”), middle (“2”), and ring (“3”) fingers of the right or left hand were placed on response keys. Two sequence conditions were used. The simple condition required repetition of one of three sequences (i.e., 11111, 22222, or 33333) and the complex condition consisted of heterogeneous sequences (i.e., 12131, 23231, or 32321). Each 3-sec trial began with the appearance of a five-digit number sequence presented vertically on the screen for 2.5 sec, cueing subjects to immediately perform the sequence as quickly and accurately as possible. The task paradigm consisted of ten 12-s epochs alternating between rest and activa- tion. Functional MRI was obtained on a 1.5-T General Electric Signa scanner. Echo-planar (EP) images were collected using a single-shot, blipped, gradient echo EP pulse sequence: echo time (TE)=40 msec, data acquisi- tion time =40 msec, field of view (FOV)=24 cm, resolu- tion=64×64. Twenty-two contiguous sagittal 6-mm thick slices provided coverage of the entire brain (voxel size: 3.75×3.75×7mm). Prior to functional imaging, high- resolution 3-D spoiled gradient-recalled at steady-state anatomic images were collected: TE =5 msec, repetition time (TR)=24 msec, 40° flip angle, number of excitations =1, slice thickness=1.2 mm, FOV=24 cm, resolution=256× 128. Refer to [13] for detail. 2.2. Motor Cortex Network, MCN fMRI data were analyzed using SPM5 (Welcome De- partment of Cognitive Neurology, London, UK) and MATLAB 7 (The Mathworks Inc.) for all subjects. The first six images of each time series were discarded to eliminate signal intensity variations arising from pro- gressive saturation. Echo-planar images were realigned to the first functional image of each time series to re- move residual head movement. The functional images of each subject were coregistered with the mean functional image from realignment, normalized to MNI (Montreal Neurological Institute) standard space and spatially smoothed using a Gaussian filter of 6 mm FWHM. First level analysis of each individual was conducted; one-tailed Student t-tests were used to identify brain regions most responsive for finger key presses. The maximum intensity projection of the statistical map and coordinates in MNI space for each maximum were ob- tained. We define the maximum intensity voxels (activation areas) as vertexes of a motor cortex network (MCN). The activity of voxel x at time t is denoted as V(x, t) after fMRI pre-processing. We calculate the linear cor- relation coefficient between any pair of voxels, x1 and x2 as formula (1), where 222 ),(),())(( 〉〈−〉〈= txVtxVxV σ , 〈 •〉 represents temporal averages. The correlation coefficient is used as the connection strength or weight between these two nodes. Therefore MCN is constructed with motor association cortices as vertexes and their correla- tion coefficients as linking weights. ))(())(( ),(),(),(),( ),( 21 2121 21 xVxV txVtxVtxVtxV xxr σσ 〉〈〉〈−〉〈 = (1) 2.3. Non-motor Cortex Network, Non-MCN The equivalent non-motor cortex network composes of k vertexes which were generated randomly in the spatial coordinates range of cerebral cortex and were far away from (greater than threshold) any vertex in MCN. Sup- pose (xn, yn, zn) is a voxel coordinates in non-motor cor- tex and (xmi , ymi, zmi) is the i voxel coordinates in motor cortex. For all i (i=1…k), it satisfies the following con- dition : thredzzyyxx minminmin >−+−+− 222 )()()( (2) Therefore non-MCN was constructed with k voxels as nodes and the correlation coefficients among them ac- cording to formula (1) as connection strength. 2.4. Measures of the Brain Functional Network Structural aspects are captured using concepts and measures provided by graph theory. All structural analy- ses are performed on the network’s connection matrix, which provides a complete description of all connections and pathways between the network’s individual units. Functional connectivity which is the temporal correla- tion between remote neurophysiological events can be reflected by information theory. z Density [14] Density is defined as the sum of the ties divided by the number of possible ties (i.e. the ratio of all tie strength that is actually present to the number of possible ties). The density of a network may give us insights into such phenomena as the speed at which information dif- fuses among the nodes, and the extent to which nodes have high levels of communicating capital and /or com- municating constraint. z Characteristic path length: lpath lpath is the global mean of the lengths of the shortest path linking any pairs of nodes, and can be used to de- scribe the connectivity of a network. 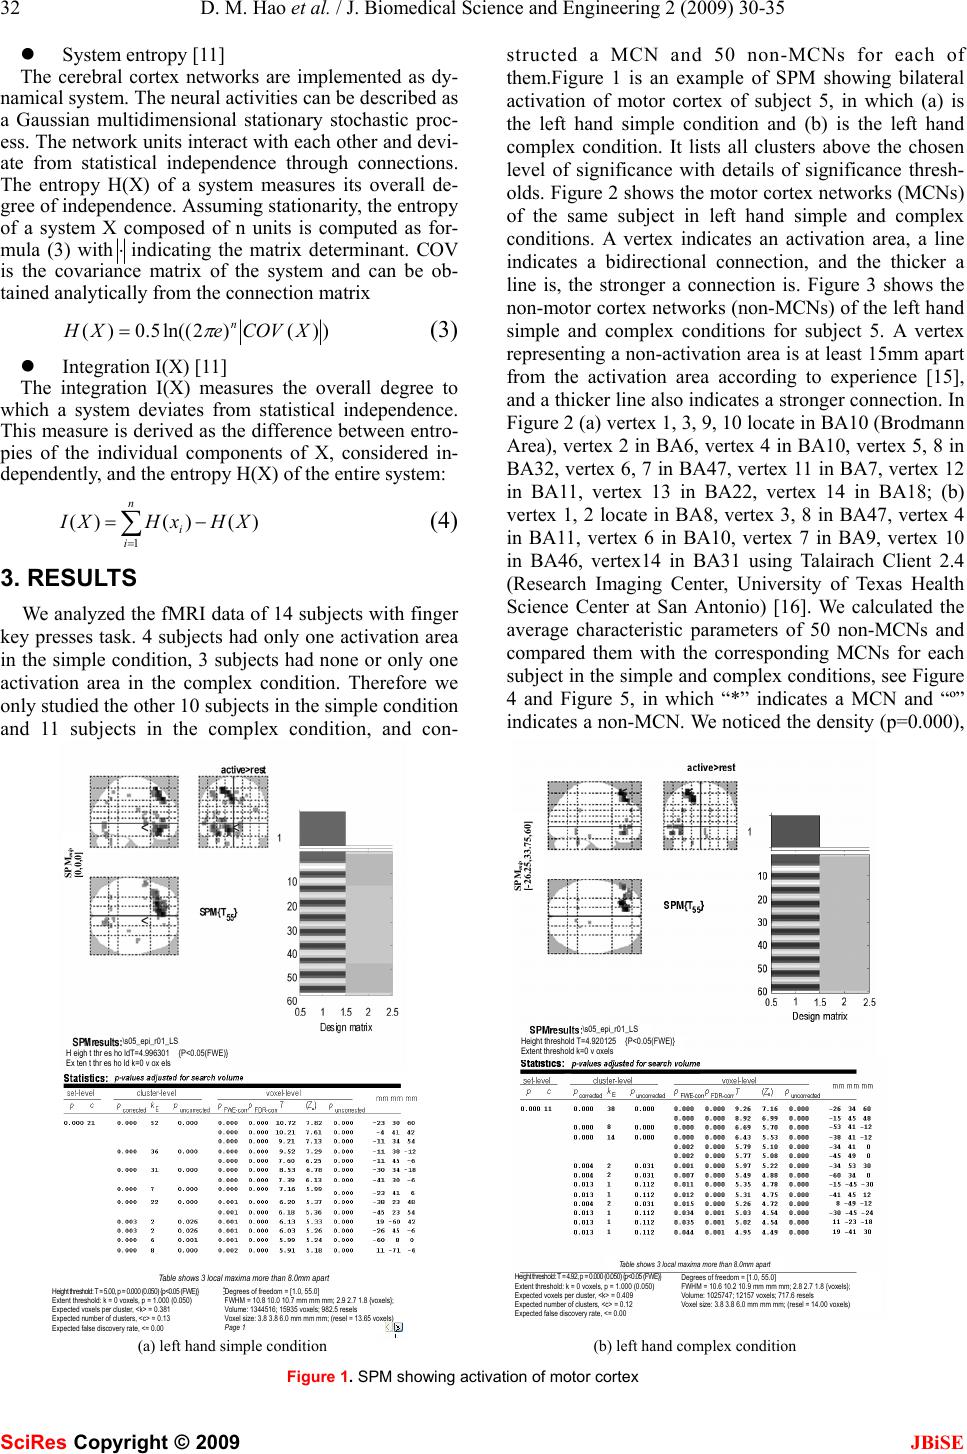 32 D. M. Hao et al. / J. Biomedical Science and Engineering 2 (2009) 30-35 SciRes Copyright © 2009 JBiSE z System entropy [11] The cerebral cortex networks are implemented as dy- namical system. The neural activities can be described as a Gaussian multidimensional stationary stochastic proc- ess. The network units interact with each other and devi- ate from statistical independence through connections. The entropy H(X) of a system measures its overall de- gree of independence. Assuming stationarity, the entropy of a system X composed of n units is computed as for- mula (3) with⋅indicating the matrix determinant. COV is the covariance matrix of the system and can be ob- tained analytically from the connection matrix ))()2ln((5.0)( XCOVeXH n π = (3) z Integration I(X) [11] The integration I(X) measures the overall degree to which a system deviates from statistical independence. This measure is derived as the difference between entro- pies of the individual components of X, considered in- dependently, and the entropy H(X) of the entire system: )()()( 1 XHxHXI n i i−= ∑ = (4) 3. RESULTS We analyzed the fMRI data of 14 subjects with finger key presses task. 4 subjects had only one activation area in the simple condition, 3 subjects had none or only one activation area in the complex condition. Therefore we only studied the other 10 subjects in the simple condition and 11 subjects in the complex condition, and con- structed a MCN and 50 non-MCNs for each of them.Figure 1 is an example of SPM showing bilateral activation of motor cortex of subject 5, in which (a) is the left hand simple condition and (b) is the left hand complex condition. It lists all clusters above the chosen level of significance with details of significance thresh- olds. Figure 2 shows the motor cortex networks (MCNs) of the same subject in left hand simple and complex conditions. A vertex indicates an activation area, a line indicates a bidirectional connection, and the thicker a line is, the stronger a connection is. Figure 3 shows the non-motor cortex networks (non-MCNs) of the left hand simple and complex conditions for subject 5. A vertex representing a non-activation area is at least 15mm apart from the activation area according to experience [15], and a thicker line also indicates a stronger connection. In Figure 2 (a) vertex 1, 3, 9, 10 locate in BA10 (Brodmann Area), vertex 2 in BA6, vertex 4 in BA10, vertex 5, 8 in BA32, vertex 6, 7 in BA47, vertex 11 in BA7, vertex 12 in BA11, vertex 13 in BA22, vertex 14 in BA18; (b) vertex 1, 2 locate in BA8, vertex 3, 8 in BA47, vertex 4 in BA11, vertex 6 in BA10, vertex 7 in BA9, vertex 10 in BA46, vertex14 in BA31 using Talairach Client 2.4 (Research Imaging Center, University of Texas Health Science Center at San Antonio) [16]. We calculated the average characteristic parameters of 50 non-MCNs and compared them with the corresponding MCNs for each subject in the simple and complex conditions, see Figure 4 and Figure 5, in which “*” indicates a MCN and “º” indicates a non-MCN. We noticed the density (p=0.000), (a) left hand simple condition (b) left hand complex condition Figure 1. SPM showing activation of motor cortex SPMmip [0,0,0] SPMmip [-26.25,33.75,60] \ s05_epi_r01_LS H eigh t thr es ho ldT=4.996301 {P<0.05(FWE)} Ex ten t thr es ho ld k=0 v ox els \ s05_epi_r01_LS Height threshold T=4.920125 {P<0.05(FWE)} Extent threshold k=0 v oxels Table shows 3 local maxima more than 8.0mm apart Height threshold: T = 5 . 00, p = 0.000 (0.050) {p<0.05 (FWE)} Extent threshold: k = 0 voxels, p = 1.000 (0.050) Expected voxels per cluster, <k> = 0.381 Expected number of clusters, <c> = 0.13 Expected false discovery rate, <= 0.00 Degrees of freedom = [1.0, 55.0] FWHM = 10.8 10.0 10.7 mm mm mm; 2.9 2.7 1.8 {voxels}; Volume: 1344516; 15935 voxels; 982.5 resels Voxel size: 3.8 3.8 6.0 mm mm mm; (resel = 13.65 voxels) Page 1 Table shows 3 local maxima more than 8.0mm apart Height threshold: T = 4.92, p = 0.000 (0.050) {p<0.05 (FWE)} Extent threshold: k = 0 voxels, p = 1.000 (0.050) Expected voxels per cluster, <k> = 0.409 Expected number of clusters, <c> = 0.12 Expected false discovery rate, <= 0.00 Degrees of freedom = [1.0, 55.0] FWHM = 10.6 10.2 10.9 mm mm mm; 2.8 2.7 1.8 {voxels}; Volume: 1025747; 12157 voxels; 717.6 resels Voxel size: 3.8 3.8 6.0 mm mm mm; (resel = 14.00 voxels) 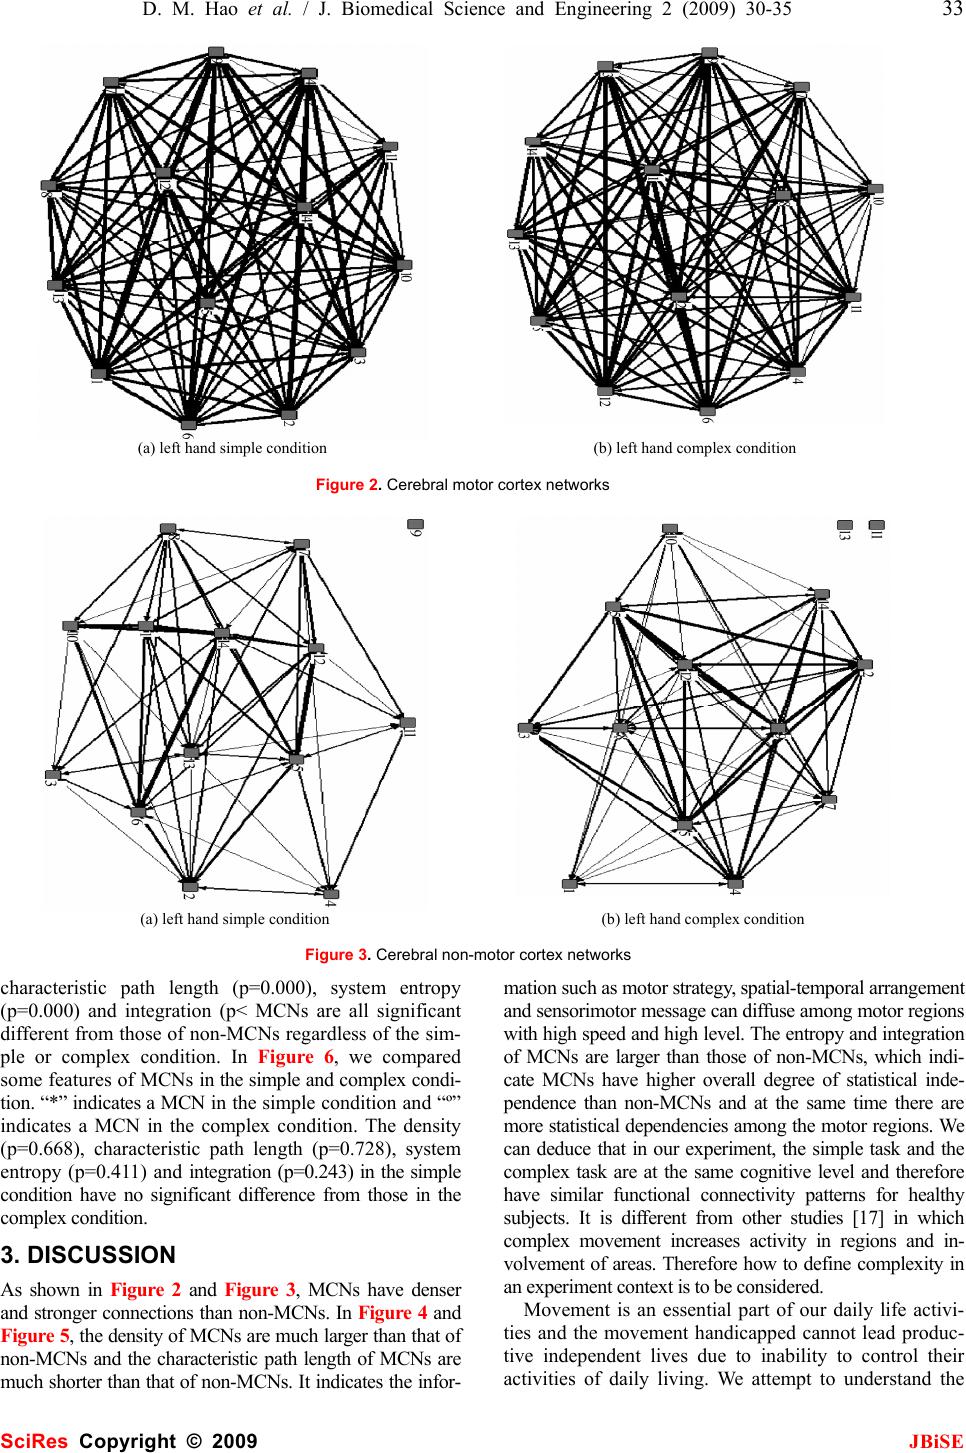 D. M. Hao et al. / J. Biomedical Science and Engineering 2 (2009) 30-35 33 SciRes Copyright © 2009 JBiSE (a) left hand simple condition (b) left hand complex condition Figure 2. Cerebral motor cortex networks (a) left hand simple condition (b) left hand complex condition Figure 3. Cerebral non-motor cortex networks characteristic path length (p=0.000), system entropy (p=0.000) and integration (p< MCNs are all significant different from those of non-MCNs regardless of the sim- ple or complex condition. In Figure 6, we compared some features of MCNs in the simple and complex condi- tion. “*” indicates a MCN in the simple condition and “º” indicates a MCN in the complex condition. The density (p=0.668), characteristic path length (p=0.728), system entropy (p=0.411) and integration (p=0.243) in the simple condition have no significant difference from those in the complex condition. 3. DISCUSSION As shown in Figure 2 and Figure 3, MCNs have denser and stronger connections than non-MCNs. In Figure 4 and Figure 5, the density of MCNs are much larger than that of non-MCNs and the characteristic path length of MCNs are much shorter than that of non-MCNs. It indicates the infor- mation such as motor strategy, spatial-temporal arrangement and sensorimotor message can diffuse among motor regions with high speed and high level. The entropy and integration of MCNs are larger than those of non-MCNs, which indi- cate MCNs have higher overall degree of statistical inde- pendence than non-MCNs and at the same time there are more statistical dependencies among the motor regions. We can deduce that in our experiment, the simple task and the complex task are at the same cognitive level and therefore have similar functional connectivity patterns for healthy subjects. It is different from other studies [17] in which complex movement increases activity in regions and in- volvement of areas. Therefore how to define complexity in an experiment context is to be considered. Movement is an essential part of our daily life activi- ties and the movement handicapped cannot lead produc- tive independent lives due to inability to control their activities of daily living. We attempt to understand the 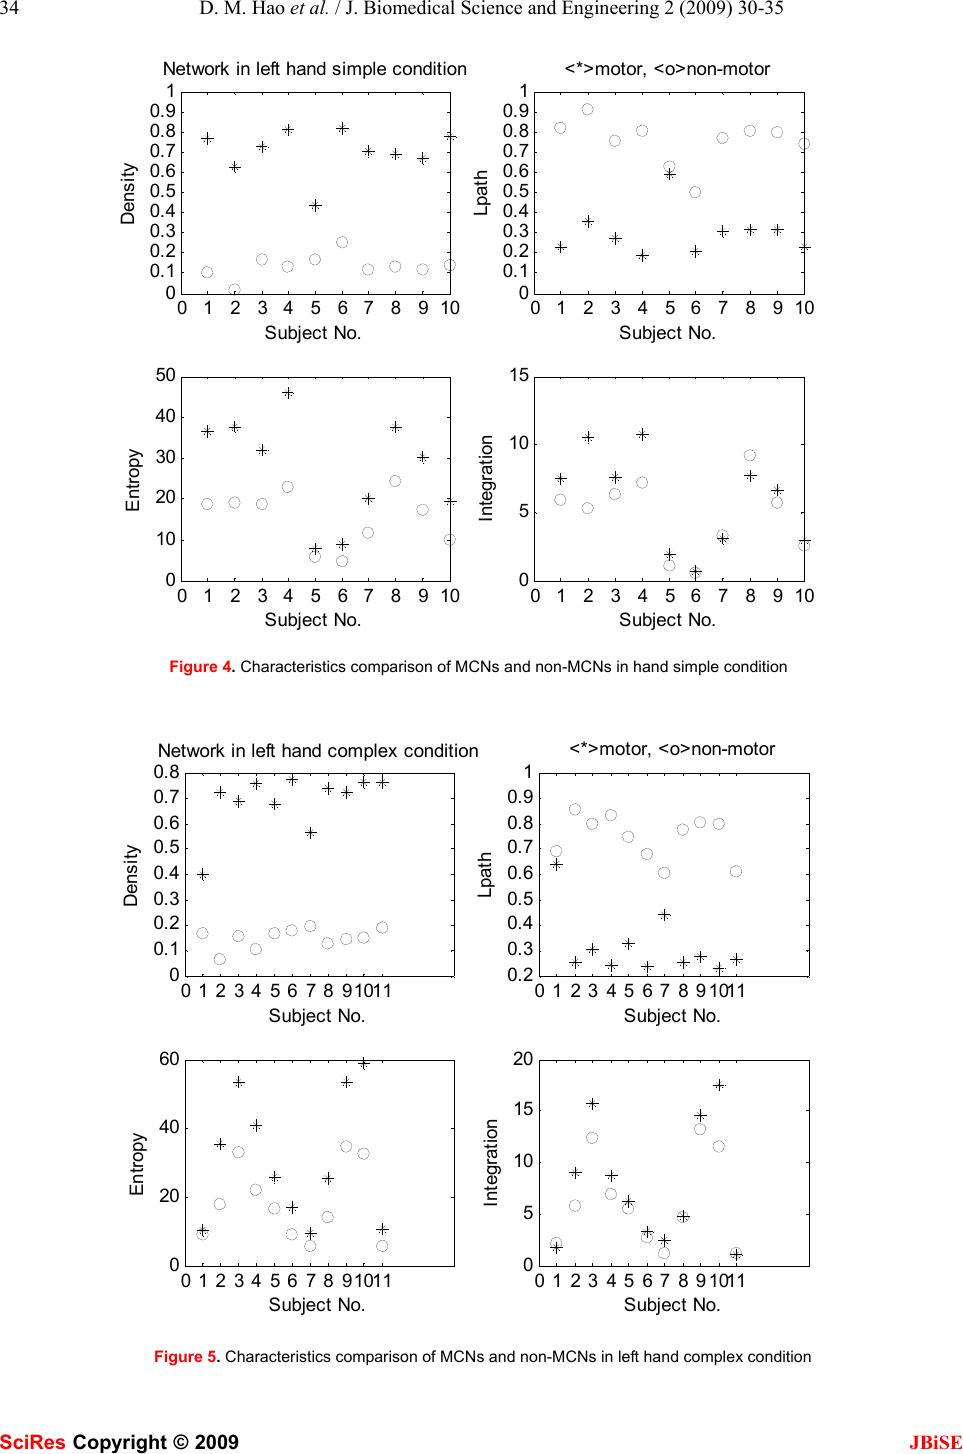 34 D. M. Hao et al. / J. Biomedical Science and Engineering 2 (2009) 30-35 SciRes Copyright © 2009 JBiSE 01 234 567 8910 0 0. 1 0. 2 0. 3 0. 4 0. 5 0. 6 0. 7 0. 8 0. 9 1 Densi ty Subject No. Network in left hand simple condition 01 23 456 78 910 0 0. 1 0. 2 0. 3 0. 4 0. 5 0. 6 0. 7 0. 8 0. 9 1 Lpath Subject No. <*>motor, <o>non-motor 01 234 567 8910 0 10 20 30 40 50 Entropy Subject No. 01 23 456 78 910 0 5 10 15 Integration Subject No. Figure 4. Characteristics comparison of MCNs and non-MCNs in hand simple condition 0 123 45 67891011 0 0. 1 0. 2 0. 3 0. 4 0. 5 0. 6 0. 7 0. 8 Dens it y Subject No. Network in left hand complex condition 0 1234 56 7891011 0. 2 0. 3 0. 4 0. 5 0. 6 0. 7 0. 8 0. 9 1 Lpath Subject No. <*>motor, <o>non-motor 0 123 45 67891011 0 20 40 60 E ntropy Subject No. 0 1234 56 7891011 0 5 10 15 20 Integration Subject No. Figure 5. Characteristics comparison of MCNs and non-MCNs in left hand complex condition 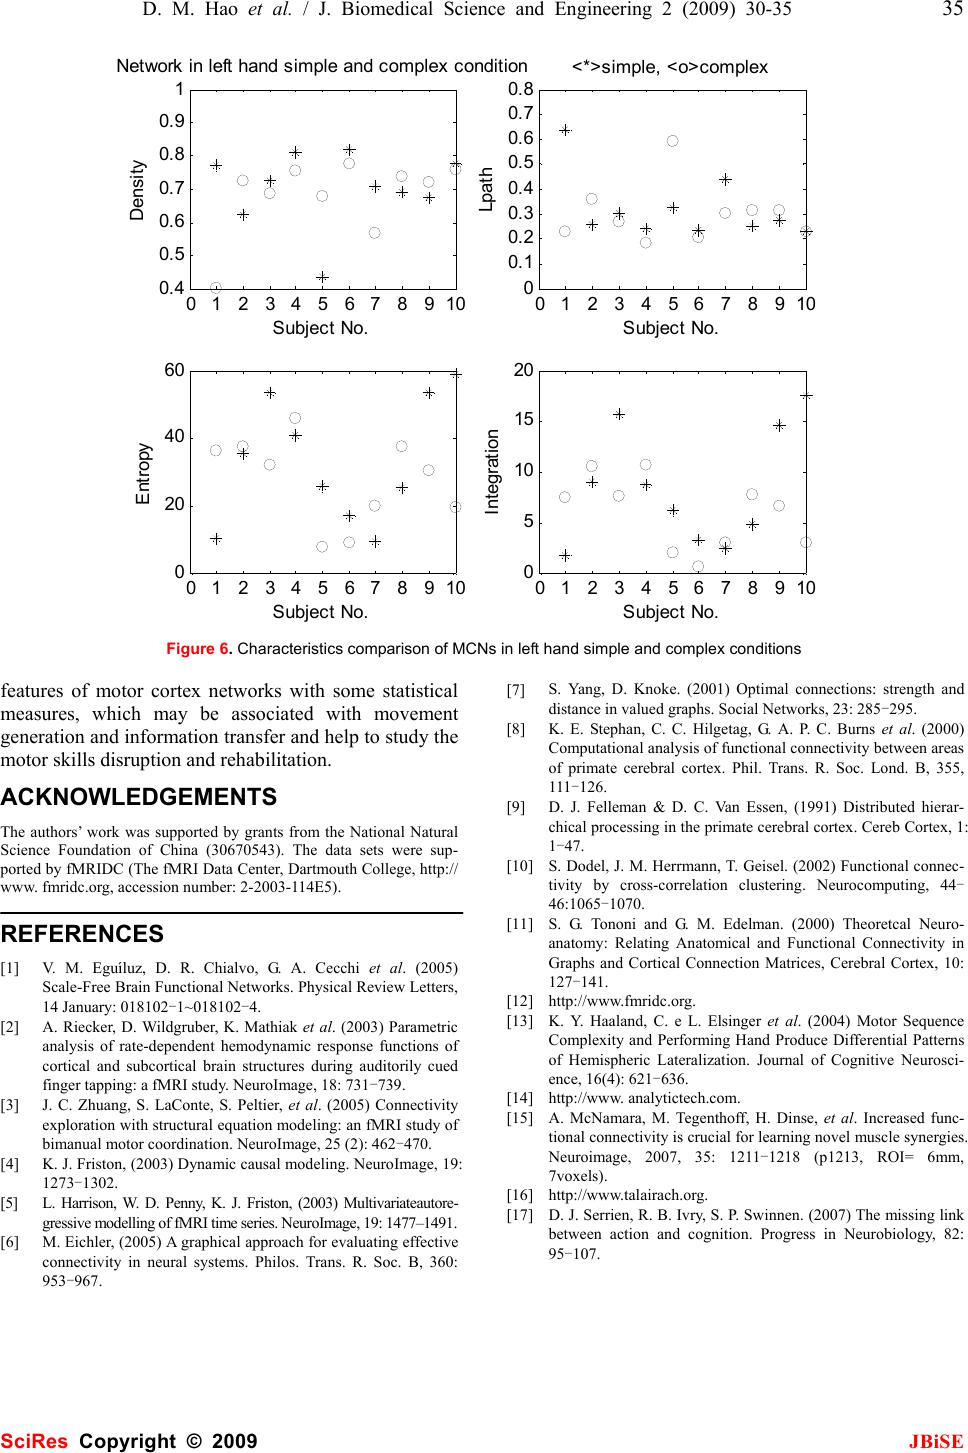 D. M. Hao et al. / J. Biomedical Science and Engineering 2 (2009) 30-35 35 SciRes Copyright © 2009 JBiSE 012345678910 0. 4 0. 5 0. 6 0. 7 0. 8 0. 9 1 Density Subject No. Network in left hand simple and complex condition 0123 45678910 0 0.1 0.2 0.3 0.4 0.5 0.6 0.7 0.8 Lpath Subject No. <*>simple, <o>complex 012345678910 0 20 40 60 Entropy Subject No. 0123 45678910 0 5 10 15 20 Integration Subject No. Figure 6. Characteristics comparison of MCNs in left hand simple and complex conditions features of motor cortex networks with some statistical measures, which may be associated with movement generation and information transfer and help to study the motor skills disruption and rehabilitation. ACKNOWLEDGEMENTS The authors’ work was supported by grants from the National Natural Science Foundation of China (30670543). The data sets were sup- ported by fMRIDC (The fMRI Data Center, Dartmouth College, http:// www. fmridc.org, accession number: 2-2003-114E5). REFERENCES [1] V. M. Eguíluz, D. R. Chialvo, G. A. Cecchi et al. (2005) Scale-Free Brain Functional Networks. Physical Review Letters, 14 January: 018102-1~018102-4. [2] A. Riecker, D. Wildgruber, K. Mathiak et al. (2003) Parametric analysis of rate-dependent hemodynamic response functions of cortical and subcortical brain structures during auditorily cued finger tapping: a fMRI study. NeuroImage, 18: 731-739. [3] J. C. Zhuang, S. LaConte, S. Peltier, et al. (2005) Connectivity exploration with structural equation modeling: an fMRI study of bimanual motor coordination. NeuroImage, 25 (2): 462-470. [4] K. J. Friston, (2003) Dynamic causal modeling. NeuroImage, 19: 1273-1302. [5] L. Harrison, W. D. Penny, K. J. Friston, (2003) Multivariateautore- gressive modelling of fMRI time series. NeuroImage, 19: 1477–1491. [6] M. Eichler, (2005) A graphical approach for evaluating effective connectivity in neural systems. Philos. Trans. R. Soc. B, 360: 953-967. [7] S. Yang, D. Knoke. (2001) Optimal connections: strength and distance in valued graphs. Social Networks, 23: 285-295. [8] K. E. Stephan, C. C. Hilgetag, G. A. P. C. Burns et al. (2000) Computational analysis of functional connectivity between areas of primate cerebral cortex. Phil. Trans. R. Soc. Lond. B, 355, 111-126. [9] D. J. Felleman & D. C. Van Essen, (1991) Distributed hierar- chical processing in the primate cerebral cortex. Cereb Cortex, 1: 1-47. [10] S. Dodel, J. M. Herrmann, T. Geisel. (2002) Functional connec- tivity by cross-correlation clustering. Neurocomputing, 44- 46:1065-1070. [11] S. G. Tononi and G. M. Edelman. (2000) Theoretcal Neuro- anatomy: Relating Anatomical and Functional Connectivity in Graphs and Cortical Connection Matrices, Cerebral Cortex, 10: 127-141. [12] http://www.fmridc.org. [13] K. Y. Haaland, C. e L. Elsinger et al. (2004) Motor Sequence Complexity and Performing Hand Produce Differential Patterns of Hemispheric Lateralization. Journal of Cognitive Neurosci- ence, 16(4): 621-636. [14] http://www. analytictech.com. [15] A. McNamara, M. Tegenthoff, H. Dinse, et al. Increased func- tional connectivity is crucial for learning novel muscle synergies. Neuroimage, 2007, 35: 1211-1218 (p1213, ROI= 6mm, 7voxels). [16] http://www.talairach.org. [17] D. J. Serrien, R. B. Ivry, S. P. Swinnen. (2007) The missing link between action and cognition. Progress in Neurobiology, 82: 95-107. |