Health
Vol.6 No.10(2014), Article ID:44785,9 pages DOI:10.4236/health.2014.610124
Subchronic Exposure of Apigenin Induces Hepatic Oxidative Stress in Male Rats
Jiawei Liu1, Yuhong Wang2, Wencai Chen1, Sheng Li2, Lingfei Liu1, Yuhui Dang1, Zhilan Li1*
1School of Public Health, Lanzhou University, Lanzhou, China
2Lanzhou Municipal Center for Disease Control, Lanzhou, China
Email: *lizhl@lzu.edu.cn
Copyright © 2014 by authors and Scientific Research Publishing Inc.
This work is licensed under the Creative Commons Attribution International License (CC BY).
http://creativecommons.org/licenses/by/4.0/


Received 28 February 2014; revised 31 March 2014; accepted 9 April 2014
ABSTRACT
Apigenin (4’, 5, 7-trihydroxyflavone, AP), a dietary flavonoid, is reported to have several therapeutic effects in different diseases including cancer. In the present study, in order to explore the potential mechanism and provide the references for further studies, we investigated the effect of apigenin at various dosages on the hepatic oxidative stress of male rats. Totally 48 SD male rats were randomly divided into control group (saline, 1 ml/100g·bw), low-dose group (AP, 234 mg/kg·bw), middle-dose group (AP, 468 mg/kg·bw) and high-dose group (AP, 936 mg/kg·bw). The rats were administered with apigenin or saline via intragastriation once a day, 6 days per week, and 5 consecutive weeks. Rats were sacrificed and the livers were harvested and then immediately preserved at −20˚C. Liver homogenate was prepared before detection. Hepatic malondialdehyde (MDA), nitric oxide syntheses (NOS), superoxide dismutase (SOD), catalase (CAT), glutathione peroxidase (GSH-Px), total antioxidant capacity (T-AOC) and glutathione (GSH) were determined by colorimetric methods according to the provided procedures. The weights of liver and spleen in apigenin treatment groups did not reveal statistically significant difference when compared with that in the control group (P > 0.05). Total protein (TP), albumin (ALB) and globulin (GLO) in apigenin treatment groups were significantly lower than those in the control group (P < 0.05). SOD in the middledose group (AP, 468 mg/kg·bw) and high-dose group (AP, 936 mg/kg·bw) were significantly higher than that in the control group (P < 0.05). T-AOC, CAT and GSH-Px in apigenin treatment groups were significantly lower than those in the control group (P < 0.05). In high-dose AP group (AP, 936 mg/kg·bw), apigenin can result in the reduction of T-AOC, thus leading to the oxidative damage of liver tissues. In contrast, in middle-dose AP group (AP, 468 mg/kg·bw), apegenin can reduce the elimination capacity of oxygen free radicals.
Keywords:Apigenin, Male Rats, Liver, Oxidative Stress

1. Introduction
Flavonoids are the largest subclass of polyphenols [1] , and have gained increasing attention due to their potential roles in promoting human health, especially cardiovascular health. In numerous in vitro and in vivo studies, antiallergic, anti-inflammatory, antiviral or antioxidant properties are attributed to flavonoids [2] . Apigenin (4’, 5, 7-trihydroxyflavone, AP), (Figure 1) a natural plant flavone, is widely distributed in numerous vegetables and fruits, such as parsley, onion, orange, tea, and chamomile. Modern pharmacological studies have confirmed that apigenin has anti-inflammation, anti-mutagenesis, anti-tumor, anti-proliferation and anti-oxidation properties, and can lead to the decrease in ischemia and hypoxia-reoxygenation-induced damage [3] . It is reported to have a therapeutic effect on different diseases including cancer [4] . Apigenin unlike quercetin, kaempferol and other flavonoids does not exhibit genotoxicity or mutagenicity [5] . Therefore, it has gained particular interest in recent years as a promising health-promoting agent. The toxicity of apigenin, however, is less explored, and the reports regarding to apigenin are scanty in literature.
Recently, apigenin has attracted tremendous attention from scientists due to its application in therapeutics [6] . However, few reports have demonstrated that apigenin can produce phenoxyl radicals [7] or reactive oxygen species (ROS) [8] [9] and induce cytotoxicity [10] or clastogemcity [11] in different in vivo models. Chemical Selection Working Group of FDA, USA (2000) recommends developmental toxicity and chromosomal aberration assays for apigenin [4] . This study has explored its toxicity on the liver tissues of rats following a single intragastric administration.
2. Materials and Methods
2.1. Animals
Forty-eight 8 - 9 weeks old SD rats (male 180 - 220 g), [Certificate number SCXK [Gan] 2011-0001-0001176] were purchased from Gansu Traditional Chinese Medical School Medicine Laboratory Animal Center [Certificate number SCXK [Gan] 2011-0001-0002756] for this experiment. The animals were maintained under standard laboratory conditions (12 h light, 12 h darkness, temperature 18˚C - 23˚C), and normal rat chow and regular tap water were available. These rats were allowed to acclimatize to the laboratory environment for 4 days prior to the study.
2.2. Chemicals and Reagents
Apigenin [batch no. HK20120405] was purchased from Shanxi Huike Botany Development Co., Ltd. Company. The purity of purchased apigenin was higher than 98% as determined by HPLC. Hepatic MDA [batch no. 20121224], NOS [batch no. 20121227], SOD [batch no. 20121228], CAT [batch no. 20130115], T-AOC [batch no. 20121229] and GSH-Px [batch no. 20121228] were purchased from Nanjing Jiancheng Bioengineering Institute. Hepatic GSH [batch no. E20130114019] was purchased from Shanghai Jingtian Bioengineering Institute.
2.3. Apigenin Administration
The experimental rats were randomly divided into 4 groups such as the control group (saline, 10 ml/kg·bw), low-dose group (AP, 234 mg/kg·bw), middle-dose group (AP, 468 mg/kg·bw) and high-dose group (AP, 936 mg/kg·bw), and 12 rats in each group. The rats were administered with apigenin or saline every 6 days and sacrificed on the 35th day after the treatments.
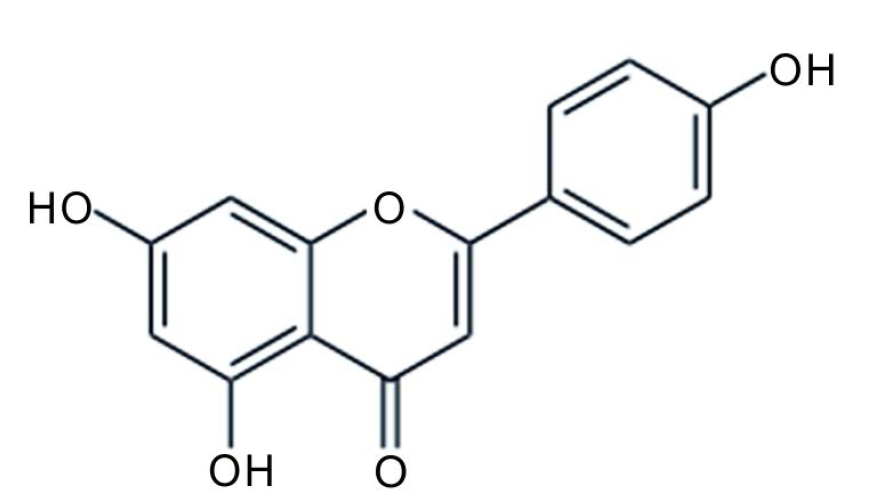
Figure 1. Structure of apigenin.
2.4. Blood Collection and Serum Biochemical Parameters
Autopsy blood was withdrawn from each animal by cardiac puncture, collected into Eppendorf tubes, allowed to stand undisturbed for 2 hours and centrifuged at 3000 r/min for 10 min. Serum was separated and the levels of TP, ALB, GLO, ALT and AST were determined by HITACHI7180 automated biochemical analyzer.
2.5. Biochemical Parameters of Liver Tissue
Liver tissue homogenate was used for the assays of antioxidant enzymes. Partial hepatic tissues (0.2 - 0.4 g) were harvested and rapidly frozen at −20˚C for further analysis. Hepatic tissues were rapidly cut into small pieces in ice-cold normal saline before detection and the tissue homogenate (10%) was centrifuged at 3500 r/min at 4˚C for 10 min. Hepatic MDA, NOS, SOD, CAT, T-AOC, and GSH-Px activities and protein contents were determined by colorimetric methods according to the provided procedures. Hepatic GSH was determined by enzyme-linked immunosorbent assay methods according to the manufacturer’s instructions.
2.6. Liver Histology
Liver tissue was fixed in 10% buffered formalin for histological investigations. Fixed liver tissues were washed overnight, dehydrated through graded alcohols and embedded in paraffin wax. Serial sections of about 5 μm thickness were stained with hematoxylin and eosin (H.E) for histological examinations.
2.7. Statistical Analysis
Data were expressed as mean ± SD, and the one-way ANOVA followed by a post hoc LSD test was used for the comparison between groups. The statistical analysis was conducted using SPSS16.0, and P ≤ 0.05 was considered as statistically significant difference.
3. Results
3.1. Effect of Apigenin on Body Weights of Male Rats
The activity and diet of the rats were normal after the treatment for 35 days, the body weights of male rats revealed an obvious increase, and no significant toxicity in experimental rats was observed (Figure 2).
3.2. Effect of Apigenin on Organ Weights of Male Rats
The weights of liver and spleen in four dose groups were no statistically significant difference (P > 0.05) when compared with that in the control group (Table 1).
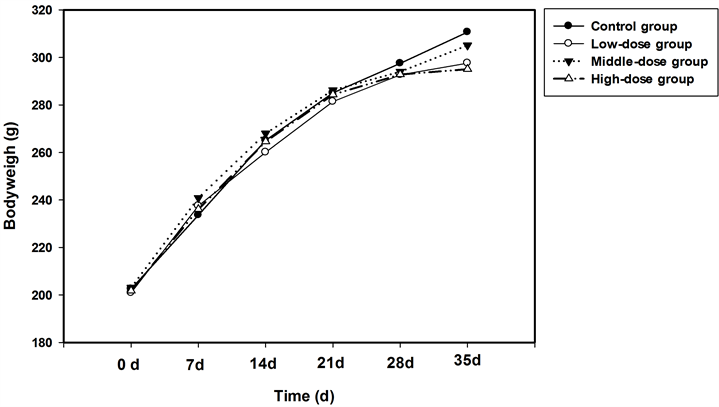
Figure 2. Effect of apigenin on the body weight of male rats.

Table 1. Effect of apigenin on relative organ weights of rats after treatment for 35 days ( ).
).
3.3. Effect of Apigenin on Biochemical Parameters of Male Rats
After administration of apigenin for 35 days, the levels of serum TP, ALB and GLO in low-dose group, middledose group, and high-dose group were significantly lower than those in the control group (P < 0.05) (Table 2).
3.4. Effect of Apigenin on Activity of Antioxidant Enzymes in Rats Liver
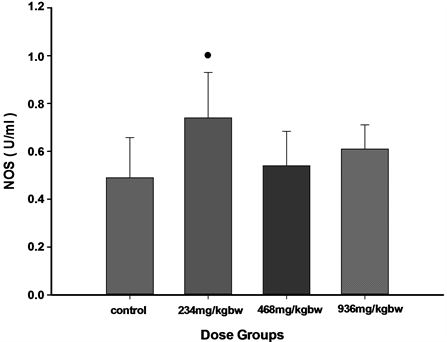
The hepatic SOD activities in the middle-dose group and high-dose group were significantly lower than those in the control group (P < 0.05). The hepatic CAT, GSH-PX and T-AOC activities in the low-dose group, middledose group, and high-dose group were significantly lower than those in the control group (P < 0.05). The hepatic MDA content in the low-dose group was significantly higher than that in the control group (P < 0.05); however, hepatic MDA contents in the middle-dose group and high-dose group were significantly lower than that in the control group (P < 0.05) (Table 3 and Figure 3).
3.5. Rats Liver Histological Changes (Figure 4)
1) Control group, Hepatic tissue structure is normal in the control group (H.E 400×).
2) Low-dose group, Hepatocyte cytoplasm rarefaction, spotty necrosis scattering in hepatic lobule (H.E 400×).
3) Middle-dose group, at the periphery of central vein infiltrated by inflammatory cells (H.E 400×).
4) High-dose group, severe hydropic changes and degeneration of cytoplasm within hepatocytes were observed (H.E 400×).
4. Discussion
The weights of organs and organ coefficients are the most important biological characteristics of experimental animals, and can reflect functional status of the animals during biomedical research. In the pharmacological experiments, the weights of organs and major organ coefficients should be tested. The change of organ coefficients can reflect chemical poison. Pathological changes can be the circumstantial evidence, and also be the important clue for exploring target organ. In the present study, the results showed that the weights of liver and spleen did not reveal an obvious significant difference (P > 0.05) when compared with that in the control group, suggesting that the intragastric administration of apigenin did not affect food intake during the growth period of the rats.
Hematological characteristics are important for animals and can be used as an effective and sensitive index to monitor physiological and pathological conditions of experimental animals [12] . The TP, ALB and GLO generated in the liver were used as the clinical indicators to evaluate nutritional status of the patients. When functional abnormality was occurred in the liver, the decreased albumin was observed. The degree of decreased albumin is parallel to liver injury. Whereas the ALB and A: G ratios were significantly reduced in the apigenin group when compared with those in the control group, the reduction of ALB is due to a negatively-acute phase protein and decrease in concentration following an inflammatory stimulus [12] . In the present study, the results showed that total protein, albumin and globulin in the low-dose group, middle-dose group and high-dose group were significantly lower than those in the control group (P < 0.05). It was suggested that apigenin could cause liver damage at those dose.
A large number of evidences suggest that intracellular metabolism of flavonoids may be grouped into three
Table 2. Effect of apigenin on biochemical parameters of male rats ( , n = 12).
Note: *P < 0.05 vs. The control group.
Table 3. Effect of apigenin on the activities of antioxidant enzymes in the livers of rats ( , n = 12).
Note: *P < 0.05 vs. the control group.
categories: 1) conjugation with thiols, particularly GSH, 2) oxidative metabolism, and 3) P450-related metabolism [13] . GSH constitutes the first line of defense against free radicals and the depletion of mitochondrial GSH will lead to necrosis as a result of the inability to defend the normally produced ROS in mitochondria [14] . GSH, a sulfhydryl-reducing agent that normally assists in the transport of amino acids, quenches free radicals and helps to regulate the internal redox environment of cells, which has been proved to bring health benefits [15] . SOD can accelerate the conversion of superoxide free radicals to hydrogen peroxide, while CAT or GPX can convert H2O2 to H2O [16] . GSH-Px can remove H2O2 by coupling its reduction with the oxidation of GSH. GSH-Px can also reduce other peroxides such as fatty acid hydroperoxides. These enzymes are present in the cytoplasm at the millimolar level and also present in the mitochondrial matrix. Most animal tissues contain both CAT and GSH-Px [17] . MDA level indirectly reflects the degree of cellular damage attacked by free radicals and is widely used as an index of free radicals-mediated lipid peroxidation [14] . The decomposition of peroxidized lipids yields a variety of end products including MDA, and the imbalance between the process of free radical formation and the endogenous defense system can result in oxidative stress, which is considered as a major reason of various diseases [15] .
We used hepatic MDA, GSH and T-AOC levels to evaluate oxidative stress. The hepatic CAT, GSH-PX, MDA and T-AOC activities in the low-dose group, middle-dose group and high-dose group were significantly lower than those in the control group (P < 0.05). These results suggest that apigenin can lead to lipid peroxidation the livers of the rats. In the present study, an increase in MDA was presumably associated with the increased free radicals, which confirmed the fact that these free radicals inhibited the activities of SOD, CAT and GSH-Px. The superoxide ion free radicals are also capable of inhibiting the activities of SOD and CAT. The observed reduction in enzyme activity may be attributed to the increase of ROS.
 (A)
(A) 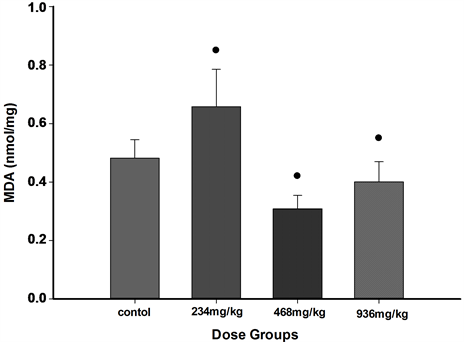 (B)
(B) 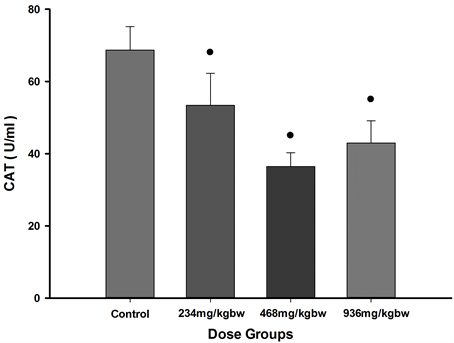 (C)
(C)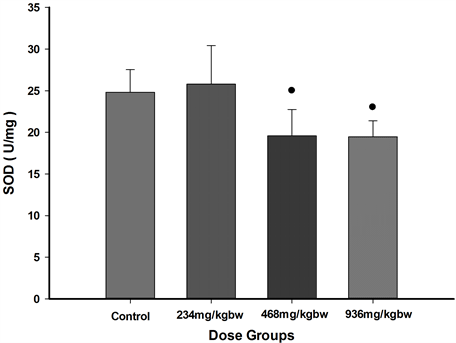 (D)
(D) 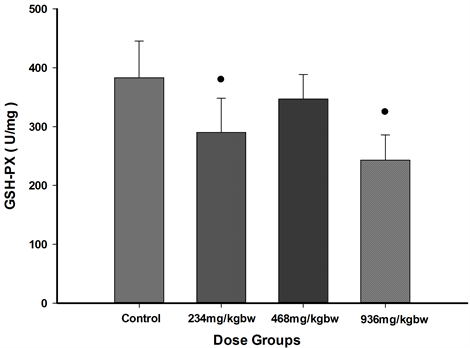 (E)
(E)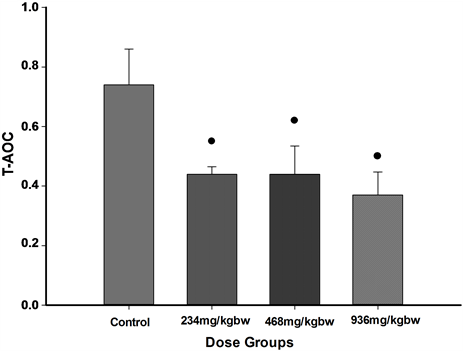 (F)
(F) 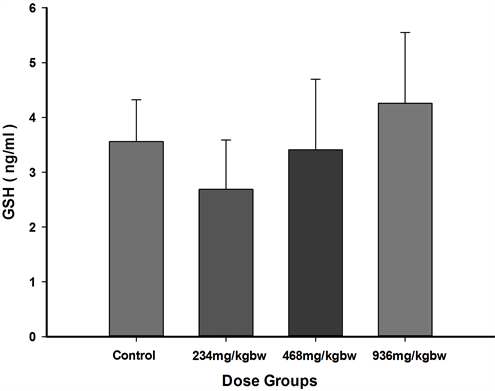 (G)
(G)
Figure 3. The levels of oxidative stress parameters. (A) MDA, (B) NOS, (C) SOD, (D) CAT, (E) T-AOC, (F) GSH-Px, (G) GSH. The asterisks indicate significance of differences (P < 0.05) in comparison to control group.
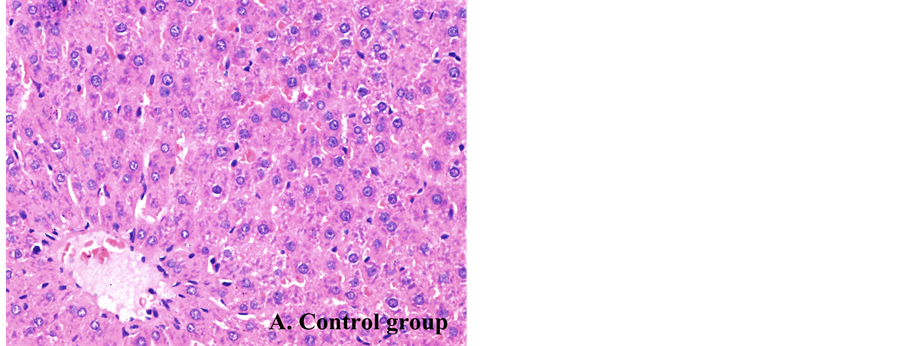
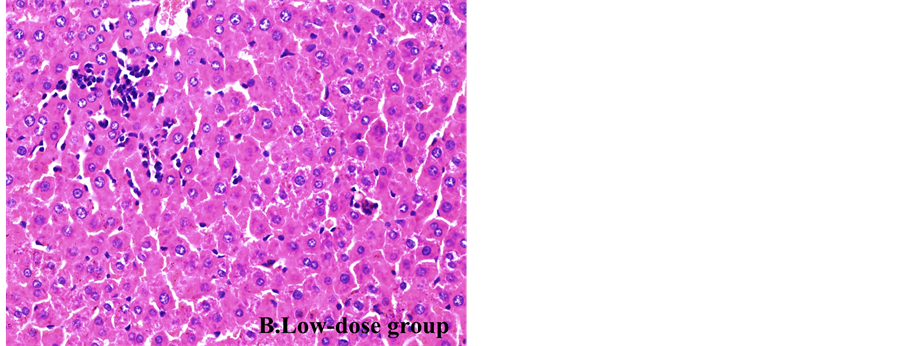
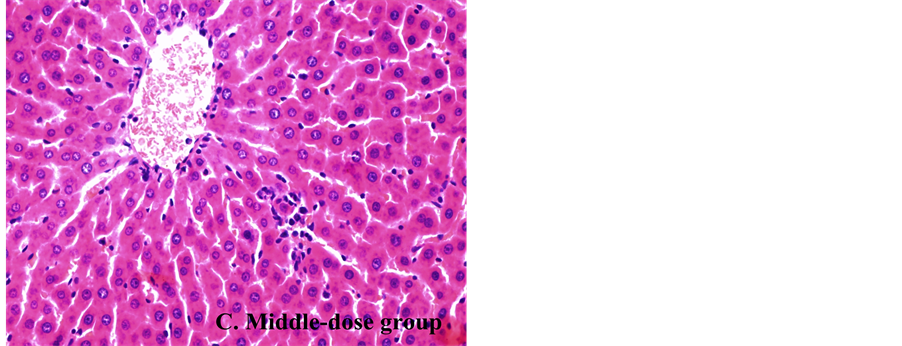
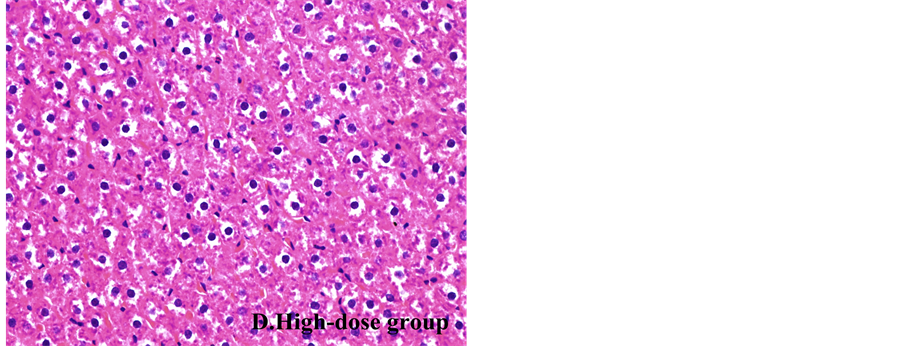
Figure 4. Histologucal examination of liver sections.
T-AOC reflects the total antioxidant capacity and represents the cumulative action of all antioxidants present in the liver [18] . T-AOC is a sensitive and reliable marker to detect in vivo change of oxidative stress, which may provide more biologically relevant information than that from measured concentrations of individual antioxidants [18] . Our present results also showed that T-AOC was significantly decreased in the apigenin treatment groups when compared with that in the control group, which indicated that the reduction of antioxidant enzymes could cause the decline of T-AOC, thus resulting in oxidative stress in liver tissues.
5. Conclusion
Although little is known about these metabolites, the evidence from previous studies hints that these cellular metabolites may execute the modulated effects on flavonoids [13] . Similarly, apigenin can induce oxidative stress through different pathways and result in hepatic toxicity [19] . However, further studies are required to elucidate its detailed signal pathways.
Acknowledgements
This work was supported by the research foundation for the Population in Gansu Province, China (Grant No. GS-RK-2013-01). We thank lab members Xiaojing Zhang, Xin Zheng for their assistance. We also thank Dr. Siwu Fu and Dr. Yingbiao Sun for critical reading the manuscript.
Funding
This work was supported by the research foundation for the Population in Gansu Province, China (Grant No. GS-RK-2013-01).
References
- Beecher, G.R. (2003) Overview of Dietary Flavonoids: Nomenclature, Occurrence and Intake. Journal of Nutrition, 133, 3248-3254.
- Aherne, S.A. and O’Brien, N.M. (2002) Dietary Flavonols: Chemistry, Food Content, and Metabolism. Nutrition, 18, 75-81. http://dx.doi.org/10.1016/S0899-9007(01)00695-5
- Yang, J., Wang, X.Y., Xue, J., Gu, Z.L. and Xie, M.L. (2013) Protective Effect of Apigenin on Mouse Acute Liver Injury Induced by Acetaminophen Is Associated with Increment of Hepatic Glutathione Reduced Captivity. Food and Function, 4, 939-943. http://dx.doi.org/10.1039/c3fo60071h
- Singh, P., Mishra, S.K., Noel, S., Sharma, S. and Rath, S.K. (2012) Acute Exposure of Apigenin Induces Hepatotoxicity in Swiss Mice. PLoS ONE, 7, e31964. http://dx.doi.org/10.1371/journal.pone.0031964
- Prince Vijeya Singh, J., Selvendiran, K., Mumtaz Banu, S., Padmavathi, R. and Sakthisekaran, D. (2004) Protective Role of Apigenin on the Status of Lipid Peroxidation and Antioxidant Defense against Hepatocarcinogenesis in Wistar Albino Rats. Phytomedicine, 11, 309-311. http://dx.doi.org/10.1078/0944711041495254
- Chuang, C.M., Monie, A., Wu, A. and Hung, C.F. (2009) Combination of Apigenin Treatment with Therapeutic HPV DNA Vaccination Generates Enhanced Therapeutic Antitumor Effects. Journal of Biomedical Science, 16, 1-11.
- Galati, G., Sabzevari, O., Wilson, J.X. and O’Brien, P.J. (2002) Prooxoidant Activity and Cellular Effects of Phenoxyl Radicals of Dietary Flavonoids and Other Polyphenolics. Toxicology, 177, 91-104. http://dx.doi.org/10.1016/S0300-483X(02)00198-1
- Morrisssey, C., Oneill, A., Spengler, B., Christoffel, V., Fitzpatrick, J.M. and Watson, R.W.G. (2005) Apigenin Drives the Production of Reactive Oxygen Species and Initiates a Mitochondrial Mediated Cell Death Pathway in Prostate Epithelial Cells. Prostate, 63, 131-142. http://dx.doi.org/10.1002/pros.20167
- Miyoshi, N., Naniwa, K., Yamada, T., Osawaa, T. and Nakamura, Y. (2007) Dietary Flavonoid Apigenin Is a Potential Inducer of Intracellular Oxidative Stress: The Role in the Interruptive Apoptotic Signal. Archives of Biochemistry and Biophysics, 466, 174-282. http://dx.doi.org/10.1016/j.abb.2007.07.026
- Tsuji, P.A. and Walle, T. (2008) Cytotoxic Effects of the Dietary Flavones Chrysin and Apigenin in a Normal Trout Liver Cell Line. Chemico-Biological Interactions, 171, 37-44. http://dx.doi.org/10.1016/j.cbi.2007.08.007
- Noel, S., Kasinathan, M. and Rath, S.K. (2006) Evaluation of Apigenin Using in Vitro Cytochalasin Blocked Micronucleus Assay. Toxicology in Vitro, 20, 1168-1172. http://dx.doi.org/10.1016/j.tiv.2006.03.007
- Qiao, G., Park, S. and Xu, D.H. (2012) Clinical, Hematological, and Biochemical Alterations in Olive Flounder Paralichthys Olivaceus Following Experimental Infection by Vibrio Scophthalmi. Fisheries and Aquatic Sciences, 15, 233- 239. http://dx.doi.org/10.5657/FAS.2012.0233
- Spencer, J.P.E., Abd EI Mohsen, M.M. and Rice-Evans, C. (2004) Cellular Uptake and Metabolism of Flavonoids and Their Metabolites: Implications for Their Bioactivity. Archives of Biochemistry and Biophysics, 423, 148-161. http://dx.doi.org/10.1016/j.abb.2003.11.010
- Peng, W., Zhang, C., Lv, H.Q., et al. (2010) Comparative Evaluation of the Protective Potentials of Human Paraoxonase 1 and 3 against CCl4-Induced Liver Injury. Toxicology Letters, 193, 159-166. http://dx.doi.org/10.1016/j.toxlet.2010.01.003
- Panda, S. and Kar, A. (2007) Apigenin (4’,5,7-trihydroxyflavone) Regulates Hyperglucaemia, Thyroid Dysfunction and Lipid Peroxidation in Alloxan-Induced Diabetic Mice. Journal of Pharmacy and Pharmacology, 59, 1543-1548.
- Singh Jeyabal, P.V., Syed, M.B., Venkataraman, M., Sambandham, J.K. and Sakthisekaran, D. (2005) Apigenin Inhibits Oxidative Stress-Induced Macromolecular Damage in N-Nitrosodiethylamine (NDEA)-Induced Hepatocellular Carcinogenesis in Wistar Albino Rats. Molecular Carcinogenesis, 44, 11-20.
- Limon-Pacheco, J. and Gonsebatt, M.E. (2009) The Role of Antioxidants and Antioxidant-Related Enzymes in Protective Responses to Environmentally Induced Oxidative Stress. Mutation Research, 674, 137-147. http://dx.doi.org/10.1016/j.mrgentox.2008.09.015
- Jin, Y.X., Wang, L.G., Ruan, M.L., Liu, J.W., Yang, Y.F., Zhou, C., Xu, B. and Fu, Z.W. (2011) Cypermethrin Exposure during Puberty Induces Oxidative Stress and Endocrine Disruption in Male Mice. Chemosphere, 84, 124-130. http://dx.doi.org/10.1016/j.chemosphere.2011.02.034
- Duthie, G. and Morrice, P. (2012) Antioxidant Capacity of Flavonoids in Hepatic Microsomes Is Not Reflected by Antioxidant Effects in Vivo. Oxidative Medicine and Cellular Longevity, 8, 1-4. http://dx.doi.org/10.1155/2012/165127
Abbreviations
TP: total protein
ALB: albumin
GLO: globulin
ALT: alanine aminotransferase
AST: aspartate aminotransferase
SOD: superoxide dismutase
MDA: malondialdehyde
NOS: nitricoxide syntheses
CAT: catalase
GSH-PX: glutathione peroxidase
GSH: reduced glutathione tablets
T-AOC: total antioxidative capacityNOTES

*Corresponding author.