Applied Mathematics
Vol.3 No.9(2012), Article ID:23016,5 pages DOI:10.4236/am.2012.39158
Simulating the Spreading of Two Competing Public Opinion Information on Complex Network*
1College of Science, Guilin University of Technology, Guilin, China
2Guangxi Key Laboratory of Spatial Information and Geomatics, Guilin, China
Email: jjjzzz0@163.com
Received August 6, 2012; revised September 6, 2012; accepted September 13, 2012
Keywords: Complex Network; Public Opinion Information; Competing; Spreading
ABSTRACT
In this paper, we investigate the regularity of spreading of information and public opinions towards two competing products in complex networks. By building its mathematical model and simulating its evolution process, we have found the statistical regularity for support rates of two different products at a steady stage. The research shows that strength of the public opinion spreading is proportional to the final support rates of a product.
1. Introduction
We live in a world in which all kinds of network are interwoven with each other, such as technology networks (WWW [1], transportation network [2], electricity networks [3]), social networks (like human relations networks [4], SCN [5]), biological networks (like cellular neural networks [6], food supply chain networks [7]) and so on. Complex networks exist in all aspects of human life. If we take every single person as a node and relations with each other as the edges between the nodes, we will find that human society is composed of a huge and complex network of social relations. Human behavior in complex networks is related to many subjects, like politics, economy, society, humanity, and psychology. So the research of its regularity has become very important in many fields of science, as the result can be put into practice in reality and will take an important role in guiding economic, policy making and social activities.
Studying all kinds of spreading behavior in complex networks has generated a new branch of science, which is called spreading dynamics on networks. So far the wellresearched models in this field are epidemic spreading models [8-11]. There are several typical epidemic spreading models, for example, SIS, SIR, SIRS etc. S here represents “susceptible”. The S individuals are healthy and they are not able to infect others but may be infected. I represents “infective”. These I individuals have infectivity and can infect others. R represents “removed”. These individuals are immune and not able to infect others, and will not take part in the epidemic process. The above three typical epidemic spreading models are all based on single virus spreading and belong to single information spreading models. For the past few years, the spreading of other things (such as public opinions, rumors) on complex networks has been more and more researched [12,13]. Generally, these researches are all based on the relevant epidemic spreading models. However, the situation in our real life is that there are often various information mixed together. For instance, diverse virus, multiple opinions or rumors can be spread at the same time. Different from single virus spreading, they are influenced, strengthened or restrained by each other. The evolutionary process of multiple information spreading is more complicated than single information’s. Therefore, its research can not simply be attributed to single information spreading models like SIS, SIR, SIRS and more. For the time being, the study of multiple information spreading just begins, and only few research essays mentioned about it [14,15]. In this paper we mainly study the situation in which the opinion and information towards two competing parties exist at the same time in a complex network, and also investigate interrelated and interacted nature of the above opinion spreading during their evolutionary process. By building a mathematical model based on a scale-free network, we use computer to simulate this evolutionary process and investigate the statistical regularity of spreading process at the assumption that the spreading of competing information of two products flows freely. The fact is that the result we obtain at the end is mostly consistent with that in practice. That means it can be used later in our economical life and offer the theoretical support for fair commercial competition and can also be a guidance for product planning and marketing.
2. Model of Spreading of Public Opinions towards Two Competing Products on BA Network
2.1. Background for the Model Building
Product marketing and competition between different companies are common in the commercial world. At the information age today, competition of market shares for one company largely depends on that of its product information spreading. And that is why we can see various kinds of advertisement everywhere in the world. Generally speaking, product information spreading is roughly divided into commercial advertising and public opinion spreading. The public opinion for one product are the experience and comments told by the consumers who used the product and are spread from one person to another. As the spreading behaviors are not controlled by anyone and non-commercial, these comments look much closer to the truth and more convincible for consumers, compared with the other ways of promotion. That is the reason why it will take an important role in product competition campaign today.
Public opinion spreading works in social networks. Recently, the researches concerning complex networks and its development provide us with new methods and ideas to understand and study social networks and also various types of spreading behaviors in these networks. The earliest study of complex networks is traced back to the research of mathematical graph theory, which is one of the bases of discrete mathematics. The fact that Euler’s celebrated 1735 solution of the Königsberg bridge problem is often cited as the first true proof in the theory of networks. In 1960s, two Hungarian mathematicians Erdös and Rényi [16] built random graph theory, and started the systematic research of complex networks. They used relatively simple random graphs to explain the topology of networks, and created ER random graph model. However, as the study of networks goes deeper, people find that random networks are very different from real networks in many properties. Ordinarily, lots of networks in reality are not either completely regular or completely random, but lie somewhere between these two extremes. In 1998, Watts and Strogatz connected the above phenomenon with social networks, and then published a piece of paper entitled “Collective dynamics of ‘small-world’ networks” in Nature. In this paper, they revealed the small-world characteristic of complex networks and built WS small-world networks [17]. In 1999, Barabási and Albert published a piece of paper entitled “Emergence of Scaling in Random Networks” in Science, in which put forward BA scale-free networks model [18]. These two breakthroughs intensified hugely the scientists’ interest in the research of complex networks. With the further research of complex networks, scholars noticed that most of real networks have both the smallworld effect and scale-free property, and many networks can be abstracted into WS small-world networks or BA scale-free networks as the basic networks. Considering the scale-free property of social networks, we set our spreading model on BA scale-free networks. Nodes on BA networks represent consumers, and the edge between two nodes represents the interrelation and communication between two consumers.
When competing information of two products flow freely, different cognition about two products from consumers will interact with each other. Consumers’ knowledge and attitude to a product influences that on their acquaintances’ attitude to products via mouth that of their acquaintances by words of mouth, and then influence the market shares of these two products. In this paper, consumers are divided into three types in the assumption that there are two competing products A and B in market. Type A are supporters for product A; type B are supporters for product B and type C are neutrals. Neutrals have no knowledge of any products, so they have no preference first. Their attitude is likely to be influenced by other consumers’ information but doesn’t affect the others’. Type A can be classified into firm proponents and ordinary supporters. Firm proponents can be regarded as loyal customers of product A, who are good spreaders of product A and aren’t affected by other customers. Ordinary supporters of two products can affect other people and be affected by others. Denoting the subclass of firm proponents of type A as type A and that of type B as type B, we build the spreading model based on competing public opinion information of two products on a BA network, and simulate its spreading pattern through a computer simulation as follows.
2.2. Description of the Model
We use variable  to express attitude of node i (ith consumer) towards two products at time t,
 . The closer the value of
  approaches 1, the stronger the consumer support product A. On the contrary, the closer the value of
  approaches −1, the stronger the consumer support product B. Time t takes discrete value and its step size is 1.
Firstly, we build a BA network as follows:
1) Growth: Starting with a small number (m0) of nodes, at every timestep we add a new node with  edges that link the new node to m different nodes already present in the system.
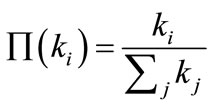
2) Preferential attachment: When choosing the nodes to which the new node connects, we assume that the probability Π that a new node will be connected to node i depends on the degree  of node i, such that
Secondly, we investigate the evolution rules of public opinion on BA networks:
1) Initialization of node state: Every node is assigned to a value which comes from  randomly, and take the value as the corresponding node’s initial state. Namely, initial state of node i is denoted by
 , which represents node i’s first cognition about two products.
2) Classification rules of nodes: we classify nodes according to their state and the rules are showed as follows.
Type A set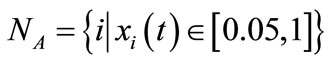 ; they are proponents for product A.
Type B set ; they are proponents for product B.
Type C set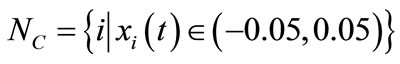 ; they are neutrals and maybe effected but can’t affect other nodes.
Type A set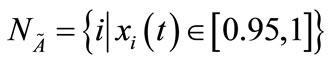 ; it’s a subset of
 , and nodes in it are firm supporters of product A. They can affect other nodes but no one can affect them.
Type B set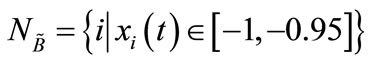 ; it’s a subset of
 , and nodes in it are firm supporters of product B. They can affect other nodes but no one can affect them.
3) Evolution mechanism: every time step, a node is selected randomly. The node will be affected by its neighbor nodes and its new state is produced. That means a customer have a new understanding of products because he or she is affected by their neighbor’s information. For example, at the eleventh time step, node No. 3 is selected, and its state changes for its neighbor node No. 8 affects it. Then its next state can be expressed by a state transition equation:
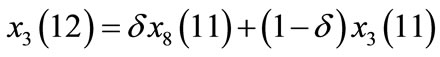
where  shows state of node i in time t;
  shows affect strength of node No. 8. If
  is bigger, that means the state of No. 3 closer to
  after affected; if
  is smaller, No. 3 will be closer to its previous state after affected. In real life, the influence of type A and B nodes to other nodes may depends on how strong their promotion is. In the model,
  and
and  are taken as IF
(impact factor) of each node in type A and type B respectively. Then we give the state transition equation showing how node i is affected by its neighbor node j (1):
3. Numerical Simulation and Analysis
In this part, we use MATLAB to simulate evolution process of the above model. What we investigate mainly is the impact of IF to product competitiveness, which shows the correlativity between spreading strength of public opinions of products and final support rate of products. In our simulations, there are 5 nodes in the BA network first. Every time, a new node is added and connected to 3 existing nodes on the network. The size of the network is . The number of evolution times is 50000, and sampling interval is 500 when drawing.
Figure 1 indicates evolution process of public opinion information for two products when  and
and . The vertical coordinate shows proportion of three types by total numbers of people. We see from Figure 1 that the type with bigger IF wins. In order to validate this result further, we let
 , and value of
  changes from 0.6 to 0.9. We calculate the difference of the proportion of type A by total numbers of individuals and the proportion of type B:
  and graph it in Figure 2. What should be explained here is that
  in Figure 2 may be negative in its early evolution, but the situation will be change when system comes to a stable stage (normally after 50 times evolution). Therefore the value of
  is positive in Figure 2. As we can see in Figure 2, the type with bigger IF is the winner and the bigger IF is, the faster it wins. To verify this conclusion further, an experiment is designed as follows. We take value of
  from 0.5 to 0.9 at interval of 0.05, and the same to
 . And there are 81 ways of combination consisting of different
  and
and , and we do 81 experiments, starting from the largest to the smallest of the value
 . Then Figure 3 is given according to the recorded figures and summarized result for the evolution process. Change in color shows change of
 : absolute square of
 . Figure 3 displays that value of
  in experiments with smaller serial numbers (
 is bigger) are growing faster, namely the competition costs shorter time, while the values of
  in experiments with bigger serial number (
 is smaller) are growing slower, namely the competition costs longer time. This experiment indicates that the bigger difference between two IF is, the faster determine a winner is determined.
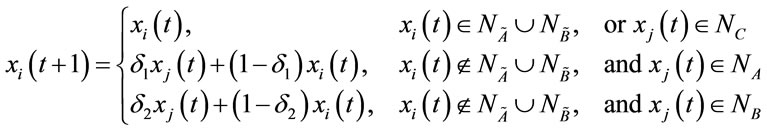 (1)
(1)
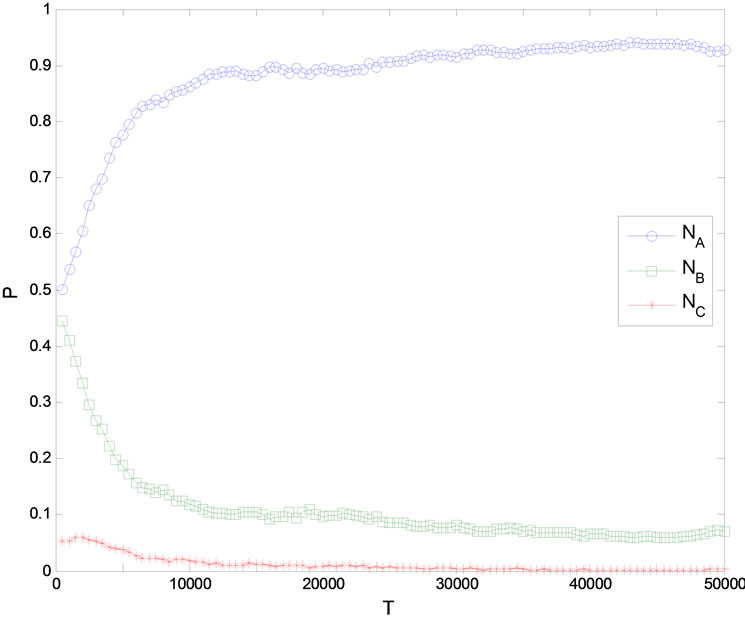
Figure 1. Time evolution curves of two public opinion for two competing products when δ1 = 0.8 and δ2 = 0.7.
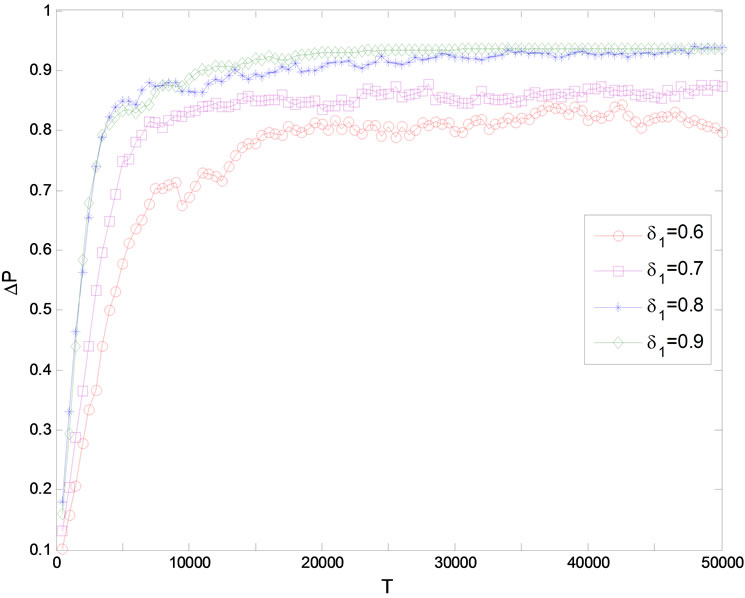
Figure 2. Time evolution curves of nodes proportion difference when δ2 = 0.5.
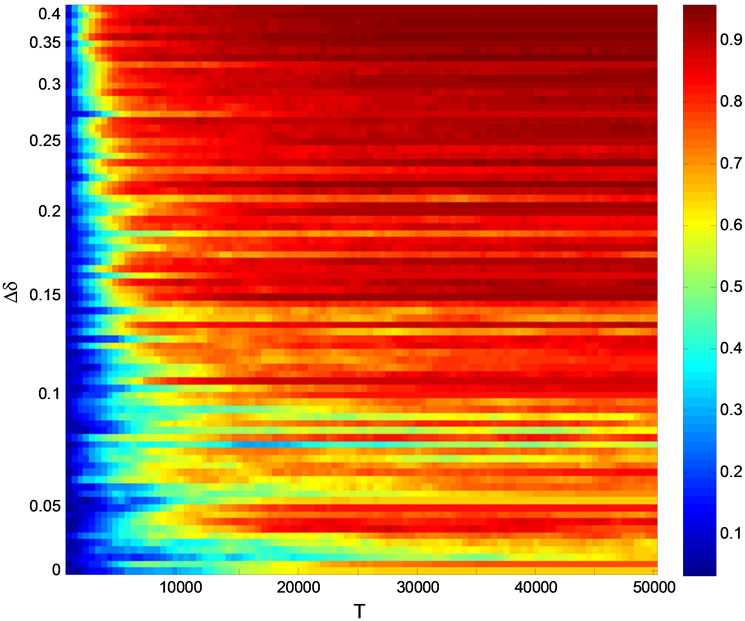
Figure 3. Time evolution process of nodes proportion difference with different impact strength.
4. Conclusions
In this paper, by building a spreading model of public opinions towards two products on BA network, we simulate their evolution process to investigate its spreading evolution mechanism on a BA network. Our research shows that the strength of public opinion information spreading about products affects their support rate directly. The party with bigger IF will win higher support rate in competition, and the bigger IF is, the faster it wins. Therefore, companies in competition must pay more attention to the service and support for their old customers and put more effort in the promotion to them.
It will be proved that the result of our research is significant to planning for fair competition in economic activities and it also provides the researchers new methods and new ideas for further study of evolution of multiple information spreading in networks.
REFERENCES
- R. Albert, H. Jeong and A. L. Barabási, “Diameter of the World-Wide Web,” Nature, Vol. 401, 1999, pp. 130-131. doi:10.1038/43601
- P. Sen, P. Dasgupta, A. Chatterjee, et al., “Small-Word Properties of the Indian Railway Network,” Physical Review E, Vol. 67, 2003, Article ID: 036106. doi:10.1103/PhysRevE.67.036106
- T. Xu, J. Chen, Y. He, et al., “Complex Networks Properties of Chinese Power Grid,” International Journal of Modern Physics B, Vol. 18, 2004, pp. 2599-2603. doi:10.1142/S0217979204025749
- F. Liljeros, C. R. Edling, L. A. N. Amaral, et al., “The Web of Human Sexual Contact,” Nature, Vol. 411, 2001, pp. 907-908. doi:10.1038/35082140
- M. E. J. Newman, “Scientific Collaboration Networks. I. Network Construction and Fundamental Results,” Physical Review E, Vol. 64, 2001, Article ID: 016131.
- J. Hu, S. Zhong and L. Liang, “Exponential Stability Analysis of Stochastic Delayed Cellular Neural Network,” Chaos, Solitons & Fractals, Vol. 27, No. 4, 2006, pp. 1006-1010. doi:10.1016/j.chaos.2005.04.067
- J. A. Dunne, R. J. Williams and N. D. Martinez, “Network Structure and Biodiversity Loss in Food Webs: Robustness Increases with Connectance,” Ecology Letters, Vol. 5, No. 4, 2002, pp. 558-567. doi:10.1046/j.1461-0248.2002.00354.x
- T. Zhou, Z. Fu and B. Wang, “Epidemic Dynamics on Complex Network,” Progress in Natural Science, Vol. 16, No. 5, 2006, pp. 452-457. doi:10.1080/10020070612330019
- X. J. Xu, H. O. Peng, X. M. Wang, et al., “Epidemic Spreading with Time Delay in Complex Networks,” Physica A, Vol. 367, 2006, pp. 525-530. doi:10.1016/j.physa.2005.11.035
- K. Li, M. Small, H. Zhang, et al., “Epidemic Outbreaks on Networks with Effective Contacts,” Nonlinear Analysis: Real World Application, Vol. 11, No. 2, 2010, pp. 1017-1025. doi:10.1016/j.nonrwa.2009.01.046
- R. Pastor-Satorras and A. Vespingnani, “Epidemic Spreading in Scale-Free Networks,” Physical Review Letters, Vol. 86, No. 4, 2001, pp. 3200-3203.
- B. Wang and T. Zhou, “Several Directions in Complex System Research,” Complex Systems and Complexity Science, Vol. 5, No. 4, 2008, pp. 21-28.
- J. M. Bristor, “Enhanced Explanations of Word of Mouth Communications: The Power of Relationships,” Research in Consumer Behavior, Vol. 4, 1990, pp. 51-83.
- A. Grabowski and R. A. Kosiński, “Ising-Based Model of Opinion Formation in a Complex Network of Interpersonal Interactions,” Physica A, Vol. 361, No. 2, 2006, pp. 651-664. doi:10.1016/j.physa.2005.06.102
- M. E. J. Newman, “Threshold Effects for Two Pathogens Spreading on a Network,” Physical Review Letters, Vol. 95, No. 108701, 2005.
- P. Erdős and A. Rényi, “On Random Graphs I,” Publicationes Mathematicae Debrecen, Vol. 6, 1959, pp. 290- 297.
- D. J. Watts and S. H. Strogatz, “Collective Dynamics of ‘Small-World’ Networks,” Nature, Vol. 393, 1998, pp. 440-442. doi:10.1038/30918
- A. L. Barabási and R. Albert, “Emergence of Scaling in Random Networks,” Science, Vol. 286, No. 5439, 1999, pp. 509-512. doi:10.1126/science.286.5439.509
NOTES
*Supported by the National Natural Science Foundation of China (Grant Nos. 61164020 and 61004101), the Natural Science Foundation of Guangxi, China (Grant No. 2011GXNSFA018147) and the project of Guangxi Key Laboratory of Spatial Information and Geomatics (Grant No. Gui1103108-24).