Journal of Biophysical Chemistry
Vol.2 No.3(2011), Article ID:6741,13 pages DOI:10.4236/jbpc.2011.23038
Kinetic and binding equilibrium studies of dihydroflavonol 4-reductase from Vitis vinifera and its unusually strong substrate inhibition
1Chimie et Biologie des Membranes et des Nanoobjets UMR CNRS, Université Bordeaux 1, Pessac, France; *Corresponding Author: j.chaudiere@cbmn.u-bordeaux.fr
2Centre de Recherche Paul Pascal, Pessac, France;
3Laboratoire de Physiologie Moléculaire des Plantes, Centre de Biotechnologie de Borj-Cedria, Hamman-Lif, Tunisie.
Received 10 June 2011; revised 15 July 2011; accepted 24 July 2011.
Keywords: Substrate Inhibition; Steady-State Kinetics; Hummel and Dreyer Technique; Isothermal Titration Calorimetry; Non-productive Enzyme Substrate Complex
ABSTRACT
Dihydroflavonol 4-reductase (DFR), a member of the short-chain dehydrogenase family, catalyzes the last common step in the biosynthesis of flavan-3-ols and condensed tannins. Initial rates of DFR were measured by monitoring the 340- nm absorbance decrease resulting from the joint consumption of dihydroquercetin (DHQ) and NADPH, as a function of pH, temperature and ionic strength. At pH 6.5 and 30˚C, substrate inhibition was observed above 30 µM DHQ. At lower/non-inhibitory DHQ concentrations, NADP+ behaves as a competitive inhibitor with respect to NADPH and as a mixed inhibitor with respect to DHQ, which supports a sequential ordered mechanism, with NADPH binding first and NADP+ released last. Binding-equilibrium data obtained by means of the chromatographic method of Hummel and Dreyer at pH 7.5 and by isothermal calorimetric titration at pH 6.5 led to the conclusion that ligands of the apoenzyme included NADPH, NADP+ and DHQ. The mechanism which best accounts for substrate inhibition at pH 6.5 in the absence of product involves the formation of a binary non-productive E.DHQ complex. Thus, a productive ternary complex cannot be formed when DHQ binds first. This mechanism of inhibition may prevent the accumulation of unstable leucoanthocyanidins within cells.
1. INTRODUCTION
Flavonoids are ubiquitous in plants where they constitute a very large family of polyphenolic structures. Among them, anthocyanidins and their glycosylated derivatives are largely responsible for the pigmentation patterns of flowers and fruits [1,2], whereas one of the best documented functions of flavan-3-ols and condensed tannins is to protect plants from infection by bacteria and fungi, as well as from destruction by insects or indiscriminate consumption by herbivorous animals [3-5]. Flavonoids are increasingly recognized as important components of our diet [6], and many of them exhibit pharmacological properties which may be beneficial to human health [5,7,8].
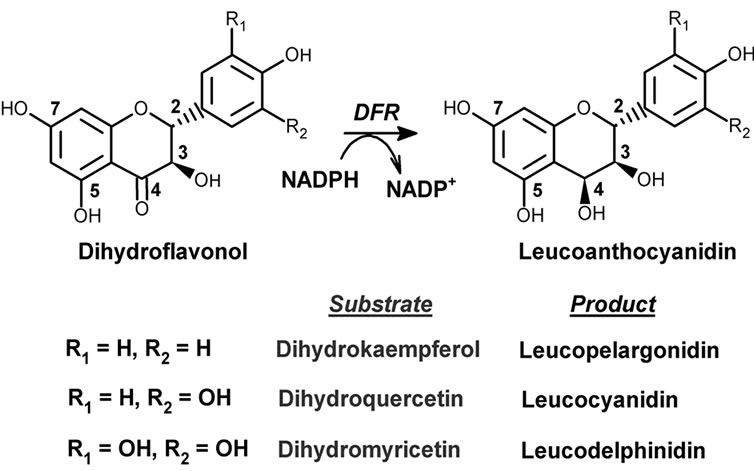
As shown in Scheme 1, dihydroflavonol 4-reductase (DFR, EC 1.1.1.219) reduces dihydroflavonols into 3,4- dihydroxy derivatives which are unstable products known as leucoanthocyanidins. As such it catalyses the last common step in the biosynthesis of the most abundant flavonoids, i.e. flavan-3-ols and condensed tannins [9-18]. Because of this strategic position, DFRs with distinct substrate specificities may exert an important control on the pattern of anthocyanins and proanthocyanidins which are produced downstream. In recent years, several groups attempted to compare distinct DFRs in terms of substrate specificity and pH or temperature profiles, and to gather some kinetic information from in vitro assays [13,14,19-22]. Although such studies did bring new and significant information, especially in terms of substrate specificity, they did not produce interpretable kinetic data. In their study of DFR isoenzymes from Medicago truncatula, Xie et al. [14] underlined that they could not obtain reliable estimations of KM values because their double-reverse plots were hardly consistent with hyperbolic behaviour. A reliable
analysis would require a homogeneous enzyme preparation and an assay methodology which could provide strong evidence that initial rates at steady state have been measured. Unfortunately, all time-dependent investigations of DFR activity which have been published so far were made on crude extracts or ammonium sulfate precipitates of DFR-containing cells, and all of them used discontinuous assays [12,14,15,23].
In this study, we worked on purified recombinant DFR from Vitis vinifera (Vv-DFR) and we developed a spectrophotometric assay in which direct monitoring of joint substrate consumption yields initial rates at steady-state. Our binding and kinetic data support the conclusion that the unusually strong substrate inhibition which is observed mostly relies on the formation of an unproductive binary enzyme-substrate complex, although a more classical ternary abortive complex is also involved in the presence of NADP+.
2. MATERIALS AND METHODS
2.1. Chemicals
(+)-Taxifolin (2R,3R-dihydroquercetin; DHQ) was purchased from Fluka BioChemika. NADPH tetrasodium salt ≥ 97% pure, NADP+ sodium salt ≥ 98% pure and dithiothreitol were purchased from Sigma-Aldrich. All other reagents were of the highest purity commercially available and used without purification. Concentrations of stock solutions were calculated from absorbance measurements, at 340 nm for NADPH and DHQ, and at 280 nm for NADP+.
2.2. Expression and Purification of Recombinant Vv-DFR
A cDNA library isolated from Vitis vinifera berries (Cabernet Sauvignon, post-veraison) was used for PCR amplification of the open-reading frame of the Vv-DFR gene. All steps, including PCR amplification, production of a DFR construct which included a hexahistidine “N-terminal” coding subsequence, expression of recombinant DFR in E. coli, and purification of the recombinant enzyme to homogeneity without removal of the hexahistidine tag at its N-terminal end, were performed as previously described [15]. DFR protein concentration was measured by monitoring the absorbance at 280 nm, using a theoretical extinction coefficient of 43,025 M–1·cm–1. A 200 - 400 µM stock solution of pure enzyme was prepared in 10 mM Tricine, pH 7.3, 50 mM NaCl and 5 mM dithiothreitol. This solution could be stored at 4˚C for at least eight weeks with less than 5% loss of activity.
2.3. Enzyme Assays and Kinetic Studies
Initial rates were measured by monitoring the 340-nm absorbance decrease resulting from the joint consumption of NADPH and DHQ as a function of time, using a thermostated Safas 190 spectrophotometer equipped with a magnetic stirrer and a computerized recorder (Spectro 2000). A pH-independent molar extinction coefficient of 6220 M–1·cm–1 was used for NADPH, whereas distinct molar extinction coefficients of DHQ had to be used for distinct pH values, ranging from 2940 M–1·cm–1 at pH 5.5 to 6660 M–1·cm–1 at pH 6.5 and 11300 M–1·cm–1 at pH 7.5. The presence of 2% ethanol (v/v) was required for fast dissolution of DHQ in the reactional aqueous medium, and it had no significant effect on enzyme activity or stability.
For each assay, and unless otherwise mentioned, the reaction mixture contained Bistris/Tricine buffer (2 × 50 mM) titrated to the appropriate pH, and 2% ethanol, 50 mM NaCl, 60 to 150 nM Vv-DFR and selected concentrations of NADPH and DHQ, in a total volume of 1 ml. 950 µL of the reaction mixture containing all components except DHQ were first incubated at the working temperature for 3 min. The reaction was then initiated by the addition of DHQ (50 µL) and the 340-nm absorbance was monitored for 3 min.
The rate of joint substrate consumption was estimated from the slope of the initial linear decrease in 340-nm absorbance as a function of time (over at least 30 sec). The enzyme rate (mean value on triplicates) was then obtained upon subtraction of the non-enzymatic blank. Rate equations associated with potential kinetic mechanisms were derived by means of the King-Altman method [24] in the general hypothesis of steady-state, and from dissociation constants of all rapid equilibria in the hypothesis of global rapid equilibrium. The method of Cha [25] was coupled to that of King and Altman for steady-state mechanisms in which dead-end steps imposed partial equilibria. All these equations were then formatted in terms of Cleland’s kinetic parameters [26]. The Marquardt-Levenberg algorithm [27] was used for non-linear adjustment of the corresponding kinetic parameters to estimated initial rates.
2.4. Chromatographic Studies of Binding at Equilibrium at pH 7.5
The chromatographic method of Hummel and Dreyer [28,29] was used to study the binding of NADPH, NADP+ and DHQ to the apoenzyme, in Bistris/Tricine 2 × 50 mM pH 7.5 plus 50 mM NaCl, at ambient temperature (~25˚C). All chromatograms were obtained with a size-exclusion HPLC column (7.8 × 300 mm) filled with Bio-sil SEC 125 (BioRad Laboratories Inc.), using a flow rate of 0.4 ml/min, and selecting an optimal absorbance wavelength for ligand monitoring, i.e. 340 nm for NADPH (e = 6220 M–1·cm–1) and DHQ (e = 11300 M–1·cm–1), and 250 nm for NADP+ (e = 10470 M–1·cm–1). The total volume of injected sample was fixed at 100 µl in all experiments. The area of the peak observed at the retention time of the potential ligand was systematically used for analysis, instead of that of the protein peak which appeared earlier in the chromatogram.
2.5. Calorimetric Studies of Binding at Equilibrium at pH 6.5
Isothermal titration calorimetry [30] was used to study the binding of DHQ to the apoenzyme, in Bistris/Tricine 2 × 50 mM pH 6.5 containing 2% ethanol, 200 mM NaCl and 2.5% glycerol (v/v) at 30˚C. These experiments were performed with a computerized microcalorimeter (Nano-ITC from TA Instruments, Guyancourt, France) equipped with two 950-µl gold cells. The reference cell was filled with buffer only. Twenty two 10-µl aliquots of DHQ (1.25 mM) were injected every 150 sec in the titration cell containing Vv-DFR (90 µM initial concentration). The baseline obtained in the absence of Vv-DFR was subtracted from the observed titration curve. Accurate estimates of the standard binding enthalpy DH0 and dissociation constant KDHQ were obtained for a single binding site, by means of non-linear adjustment of Eq.1(a), in which (ET) and (LT) are the total concentrations of enzyme and ligand respectively, and V0 is the volume of the titration cell [30].
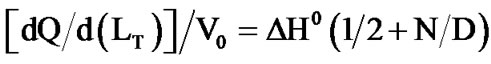 (1a)
(1a)
with
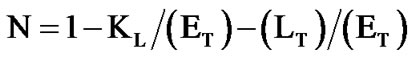
and

3. RESULTS
3.1. Optimisation of Assay Parameters
In the first part of this work, our goal was to develop a direct spectrophotometric assay of DFR which would yield reliable estimates of initial rates at steady-state. We selected an absorbance wavelength of 340 nm which had the advantage to be that of the UV/Vis absorbance peak of both NADPH and DHQ in the pH range 5.5 to 7.5, with no significant absorbance of the corresponding products NADP+ and leucocyanidin. At this wavelength, one can therefore monitor the joint consumption of NADPH and DHQ as a function of time, using the sum of the two corresponding molar extinction coefficients to convert Abs/min into µM/min. Unlike that of NADPH, the molar extinction coefficient of DHQ was found to be pH-dependent, increasing from pH 5.5 to 7.5, as expected from a chromophore due to donor/acceptor resonance between a phenolate/monobase form of ring A and the ketone group in position 4. In a preliminary comparative study of five distinct buffers which included potassium phosphate, MES, malate, citrate and Bistris/Tricine, each of them titrated to pH 6.5 at 30˚C, the highest activities were obtained with Bistris/Tricine, which was thereafter exclusively used in this work.
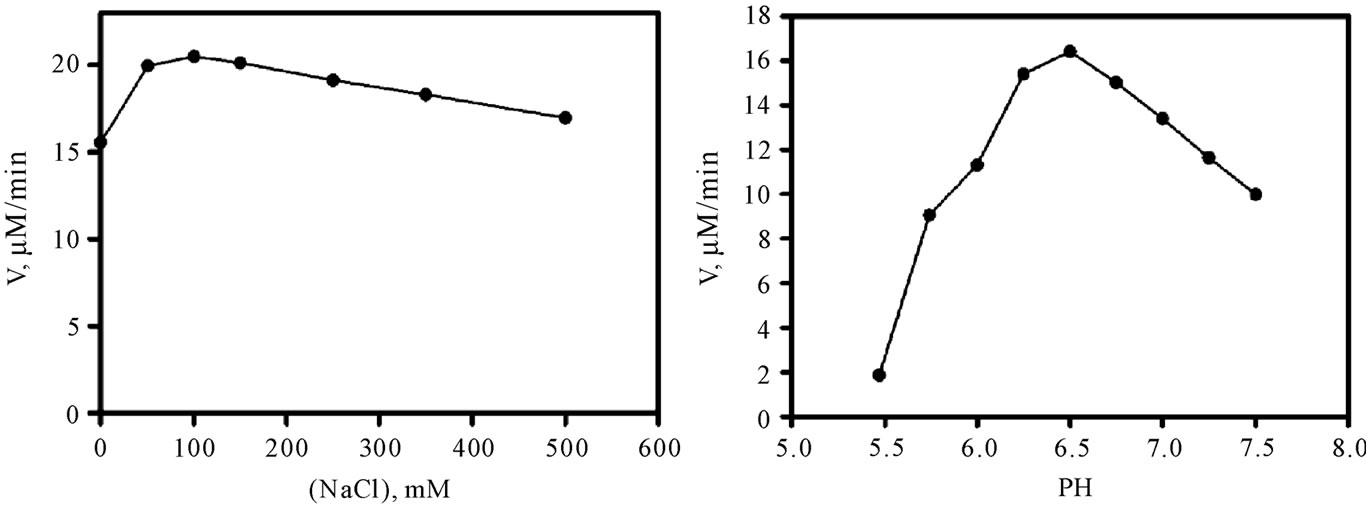
As shown in Figure 1(a), the enzyme activity was found to depend on ionic strength, with maximal rates being observed between 50 and 100 mM NaCl. A fixed concentration of 50 mM NaCl was systematically used in further experiments. The pH profile of Vv-DFR is shown in Figure 1(b). The activity markedly increases from pH 5.5 to 6.5 where it reaches a maximal value. It then continuously decreases at more alkalin pH. We therefore decided to work at pH 6.5 in further kinetic experiments. The temperature profile which was observed at pH 6.5 is shown in Figure 1(c) in the form of an Arrhenius plot. This plot was not obtained with Ln(Vmax) or Ln(Vmax/KM), which means that it cannot be used to estimate an activation energy which could be associated with a pseudo rate-constant of integer order such as kcat or one of the two possible kcat/KM. The decreasing portion of the curve is well defined but markedly concave downward between 20˚C and 32.5˚C. From a more practical point of view, these data suggested that we should avoid to work at temperatures as high as 40˚C. Our subsequent kinetic studies were therefore performed at pH 6.5, 30˚C and 50 mM NaCl. As shown in Figure 1(d), the enzyme rate is a linear function of enzyme concentration. This enabled us to adjust all initial rates to a theoretical enzyme concentration of 60 nM when performing linear or non-linear regressions.
 (a)
(a)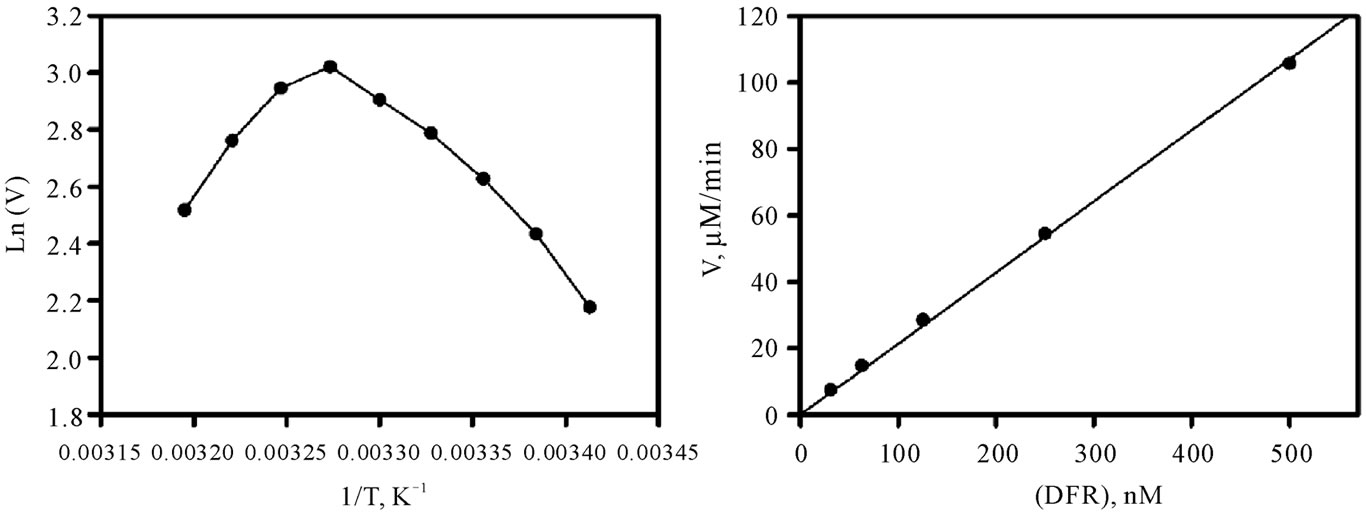 (b)
(b)
Figure 1. Activity of Vv-DFR as a function of ionic strength, pH, temperature and enzyme concentration. Measurements of initial rates were performed in Bistris/Tricine (2 × 50 mM) containing 2% ethanol, 200 µM NADPH and 35 µM DHQ, upon 5-min preincubation of the reactional medium containing the enzyme but devoid of DHQ (used to initiate the reaction) at the indicated NaCl concentration, pH and temperature. The enzyme concentration was 60 nM everywhere except in (d). (a) pH 6.5, 30˚C; (b) 50 mM NaCl, 30˚C; (c) 50 mM NaCl, pH 6.5; (d) 50 mM NaCl, pH 6.5 and 30˚C.
3.2. Steady-State Kinetics at pH 6.5 and 30˚C
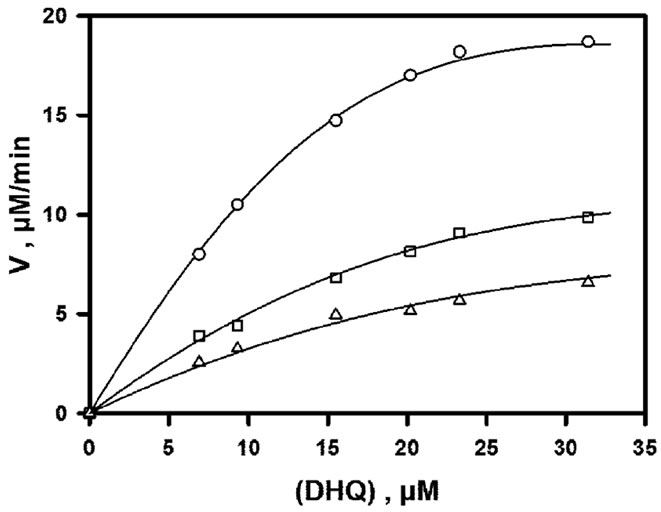
In the early phase of this work, we realised that substrate inhibition would prevent us from obtaining enzyme rates which would be close to a theoretical Vmax. As shown in Figure 2, the enzyme is strongly inhibited by its polyphenolic substrate for all fixed concentrations of the cosubstrate NADPH. The concentration of DHQ for which an apparent maximal rate is observed for each curve is about 30 - 35 µM and does not significantly depend on (NADPH). Double-reverse plots obtained for (DHQ) £ 30 µM and (NADPH) ³ 60 µM gave good straight lines, but no conclusive analysis of this partial data set could be made using the classical procedure of secondary plots [31].
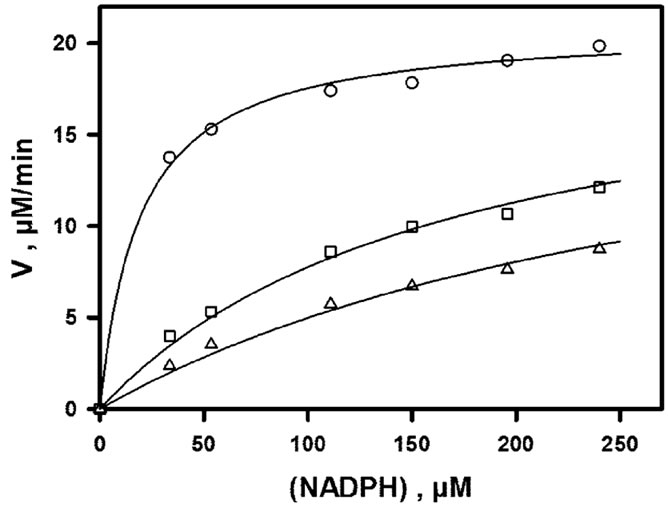
The inhibitory effect of NADP+ which is observed when (NADPH) is varied in the presence of 30 µM DHQ (fixed concentration) is shown in Figure 3(a). As shown in Figure 3(b), a double-reverse plot yields straight lines (R ³ 0.99) which intersect on the ordinate axis. This means that the effect of NADP+ is strictly competitive with respect to NADPH, with Ki ~ 14.6 µM. The inhibitory effect of NADP+ which is observed when (DHQ) is varied in the presence of 150 µM NADPH (fixed concentration) is shown in Figure 4(a). The double-reverse plot which is shown in Figure 4(b) yields straight lines with an intersection point which is clearly on the left of the ordinate axis and close to the abscissa axis. Thus, NADP+ behaves as a mixed or purely noncompetitive inhibitor with respect to DHQ. One should underline that such linear inhibition patterns were obtained only at non-inhibiting DHQ concentrations, which means that the basic kinetic mechanism is most likely strictly ordered, with NADPH binding first and NADP+
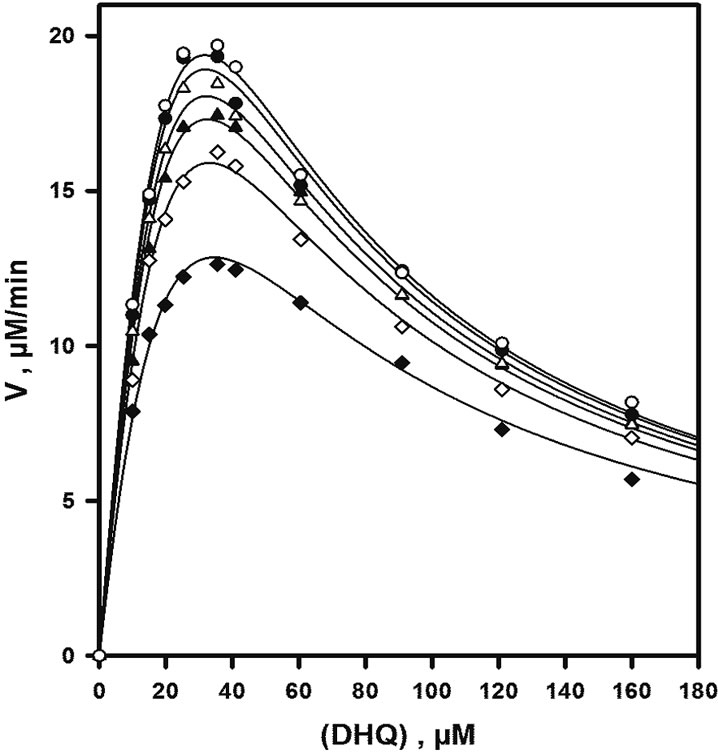
Figure 2. Steady-state initial rates observed in the absence of product. Assays were performed at pH 6.5, 50 mM NaCl and 30˚C. All data are normalized to 60 nM enzyme. From bottom to top, NADPH concentrations are 30, 60, 91, 120, 180 and 240 µM; the continuous lines represent the theoretical fit to Eq.2 in the absence of any product, using parameters obtained by non-linear adjustment to the whole data set, i.e. rates of Figures 2, 3(a) and 4(a).
released last.
3.3. Studies of Binding at Equilibrium
The chromatographic method of Hummel and Dreyer which we first used for such studies had the advantage over equilibrium dialysis to be applicable to non-radiolabeled but chromophoric ligands, in the hypothesis of fast equilibria. With the high concentrations of enzyme which were required, we could not work at pH 6.5 where some aggregation-induced precipitation of the enzyme was significant within 15 min at 30˚C. This problem was first avoided by working at pH 7.5 with Bistris/Tricine 2 × 50 mM containing 2% ethanol and 50 mM NaCl. The analysis of NADPH binding to the apoenzyme is summarized in Figure 5. The eluent contains a fixed concentration of NADPH, and the 340-nm absorbance provided by the detector is set to zero in the absence of injected sample. When a sample of apoenzyme which has been dissolved in the NADPH-free buffer is injected without coinjection of NADPH, a negative peak or trough appears at the retention time of NADPH. This only reflects the lack of NADPH in the sample. When increasing concentrations of NADPH are co-injected with the enzyme, the area of the negative peak linearly decreases and eventually becomes positive above a
 (a)
(a)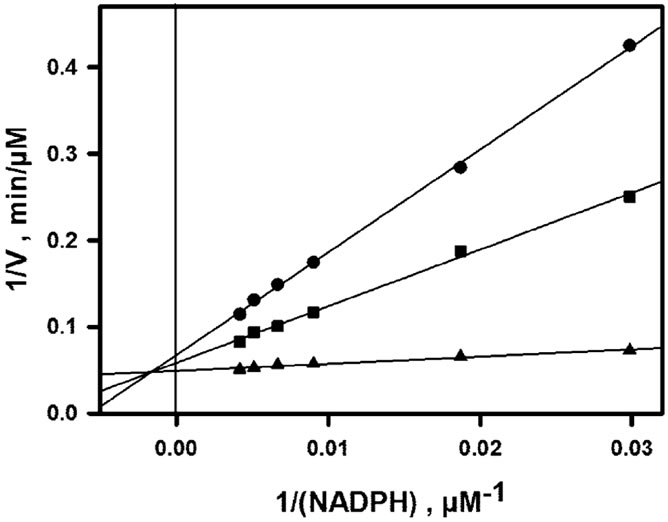 (b)
(b)
Figure 3. NADP+-induced inhibition as a function of NADPH concentration. Assays were performed at pH 6.5, 50 mM NaCl and 30˚C, with (DHQ) fixed at 30 µM. All data are normalized to 60 nM enzyme. (a) Rate curves; from top to bottom, NADP+ concentrations are 0, 100 and 200 µM; the continuous lines represent the theoretical fit to Eq.2, using parameters obtained by non-linear adjustment to the whole data set, i.e. rates of Figures 2, 3(a) and 4(a); (b) double-reverse plot; from bottom to top, NADP+ concentrations are 0, 100 and 200 µM; unlike the non-linear regression in (a), the linear regressions (R ³ 0.99) are local and do not rely on any mechanistic assumption or equation.
threshold concentration of co-injected NADPH (see Figure 5(A)). This threshold concentration can be accurately estimated by internal calibration (Figure 5(B)), and it is equal to the sum of free and bound NADPH at equilibrium. Because the concentration of free NADPH at equilibrium is by design equal to the NADPH concentration which has been fixed in the buffer, the observation of a threshold value higher than this proves that NADPH does bind to the apoenzyme, and the concentration of bound NADPH is then obtained by subtraction. The absence of significant trailing in the peaks is compatible
 (a)
(a)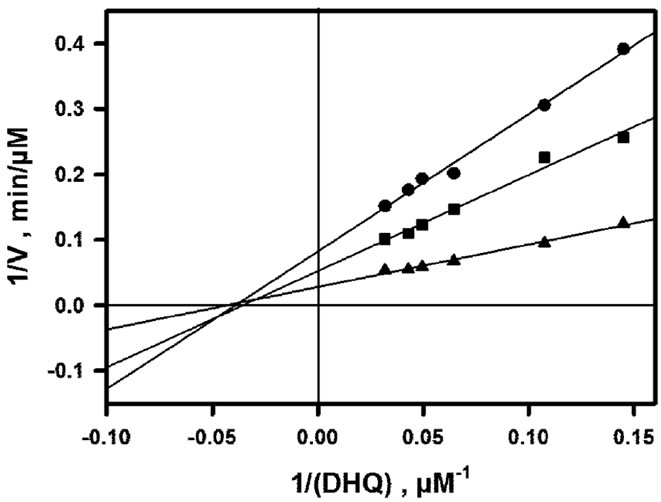 (b)
(b)
Figure 4. NADP+-induced inhibition as a function of DHQ concentration. Assays were performed at pH 6.5, 50 mM NaCl and 30˚C, with (NADPH) fixed at 150 µM. All data are normalized to 60 nM enzyme. (a) Rate curves; from top to bottom, NADP+ concentrations are 0, 100 and 200 µM; the continuous lines represent the theoretical fit to Eq.2, using parameters obtained by non-linear adjustment to the whole data set, i.e. rates of Figures 2, 3(a) and 4(a); (b) double-reverse plot; from bottom to top, NADP+ concentrations are 0, 100 and 200 µM; unlike the non-linear regression in (a), the linear regressions (R ³ 0.99) are local and do not rely on any mechanistic assumption or equation.
with a fast binding equilibrium, and assuming that there is a single hyperbolic binding site, Eq.1(b) can then be used to obtain a first estimation of the dissociation constant Kd.
 (1b)
(1b)
In this equation, (L) and (EL) are the concentrations of free and bound ligand respectively, and (ET) is the total concentration of enzyme. As shown in Figure 5(C), a more rigorous analysis can be made by repeating such experiments for several concentrations of NADPH fixed
 (A)
(A)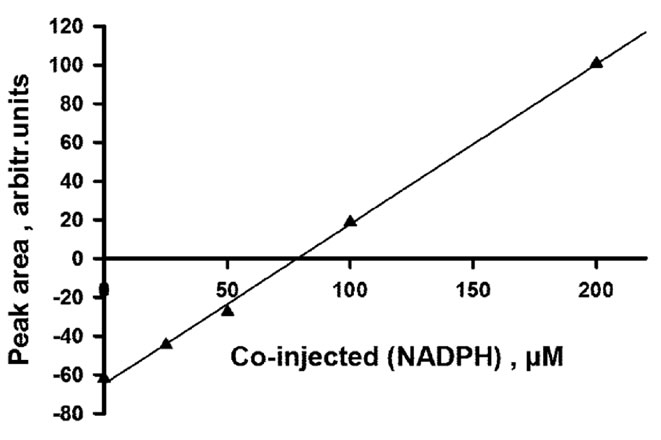 (B)
(B)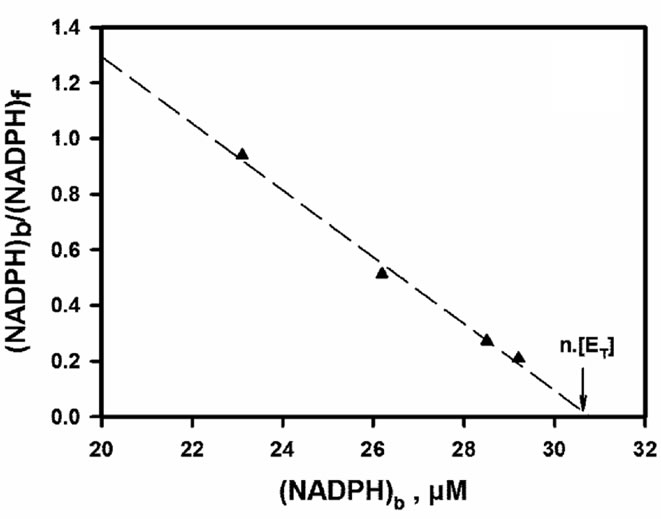 (C)
(C)
Figure 5. Hummel and Dreyer analysis of NADPH binding to the apoenzyme. (A) Chromatograms obtained upon injection of 100 µl of 30 µM DFR, with 51.1 µM NADPH fixed in the eluent; concentrations of coinjected NADPH increase from (a) to (e): 0, 25, 50, 100 and 200 µM; the ligand peak appears around 20.2 - 20.3 min; (B) internal calibration used to estimate the threshold concentration of co-injected NADPH that is required for peak inversion; (C) Scatchard plot derived from 4 experiments using 24.6, 51.1, 104.6 and 139 µM NADPH fixed in the eluent; f = free; b = bound; linear regression, R = 0.994, slope = –0.12, x-intercept = 30.82 µM.
in the eluent, and analyzing the entire set of data pairs, i.e. concentrations of free and bound ligand at equilibrium, by means of a Scatchard plot [32]. The linear profile of this plot demonstrates that NADPH-binding sites are equivalent and independent. From the abscissa intercept, one can conclude that there is a single NADPH binding site per enzyme molecule, and the corresponding dissociation constant deduced from slope reciprocal is KNADPH = 8.33 ± 0.48 µM. The same techniques were used to study the binding of either DHQ (detection at 340 nm) or NADP+ (detection at 250 nm) to the apoenzyme. As shown in Figures 6(a) and 6(b), DHQ and NADP+ also behave as hyperbolic ligands of the apoenzyme. For each of these two ligands, there is again a single binding site per enzyme molecule, with estimated dissociation constants KDHQ = 24.6 ± 1.5 µM and  = 21.9 ± 1.7 µM. In all these experiments, enzyme oligomerisation would have significantly shortened the retention time of the protein peak, and this never happened. We can therefore say that enzyme oligomerisation did not occur upon binding of any of the three ligands.
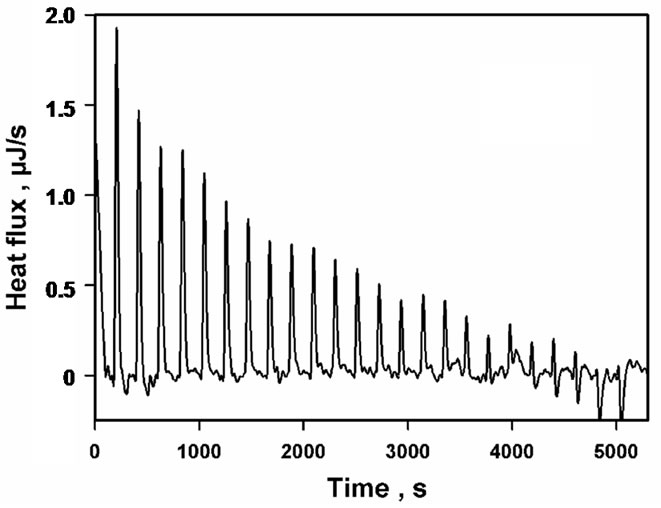
Since the kinetic data obtained at pH 6.5 supported an ordered mechanism at low/non-inhibiting substrate concentration, with NADPH binding first, whereas both NADPH and DHQ were found to bind to the apoenzyme at pH 7.5, we had to admit that the formation of a non-productive E.DHQ complex might account—at least in part—for the observed substrate inhibition. However, this hypothesis could hardly be supported without demonstrating that DHQ did not only bind to the apoenzyme at pH 7.5, but also at pH 6.5. This could be done by means of isothermal titration calorimetry at pH 6.5 and 30˚C, but only at higher ionic strength (NaCl 200 mM) and in the presence of 2.5% glycerol, to avoid the enzyme aggregation/precipitation that was otherwise systematically observed at pH 6.5 with the high protein concentration which was required, i.e. about 1000 times that which was used in the kinetic experiments. As shown in Figure 7, DHQ does bind to the apoenzyme in such conditions, with KDHQ = 97.4 ± 23.6 µM and DH0 = –10.3 ± 1.02 kJ·mol–1 for n = 1.
4. DISCUSSION
The pH profile which we obtained with Vv-DFR is close to that reported for DFR1 from Medicago truncatula [14]. The fact that maximal activities are observed at pH 6.5 suggests that Vv-DFR is well designed to work in the cytosolic compartment. No inflexion point can be visualised, and this is not surprising since we could only use substrate concentrations for which no enzyme intermediate could be designated as major species at steady state. For the same reason, the kinetic significance of the
 (a)
(a)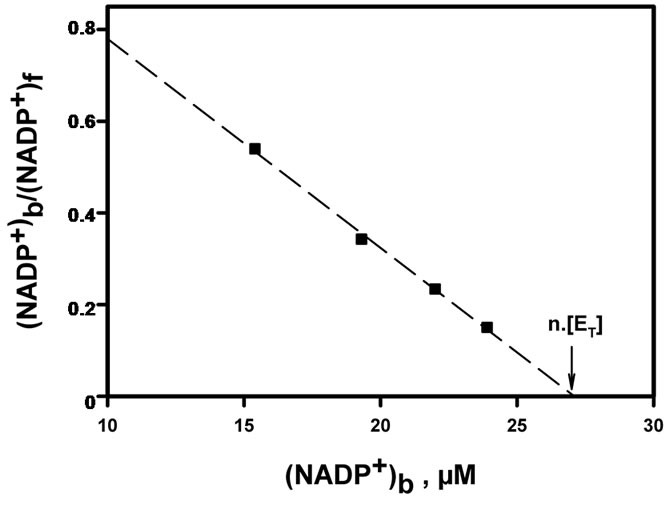 (b)
(b)
Figure 6. Scatchard plots for DHQ and NADP+ binding to the apoenzyme. Data are derived from Hummel and Dreyer analysis, using the same type of procedure as that described in Figure 5. (a) Binding of DHQ; f = free; b = bound; linear regression, R = 0.994, slope = –0.041, x-intercept = 35.8 µM; (b) binding of NADP+; f = free; b = bound; linear regression, R = 0.997, slope = –0.045, x-intercept = 28.2 µM.
thermal activation portion of the graph shown in Figure 1(c) cannot be analysed in detail. A more surprising observation is that thermal inactivation of Vv-DFR is already significant at 40˚C. This suggests that Vv-DFR may undergo some thermal inactivation in berries exposed to the highest temperatures of summer, but we cannot exclude the possibility that our hexahistidine tag decreases thermal stability.
Vv-DFR was purified as a monomer and none of our kinetic and binding data suggests that it could oligomerise during catalysis. Its complex kinetic behaviour is therefore unlikely to result from allosteric properties and it should be explained in terms of hyperbolic binding of all ligands involved in catalysis. This means that we have to look for King-Altman schemes which would be compatible with the whole set of kinetic data. Product inhibition patterns strongly suggest that the kinetic
 (a)
(a)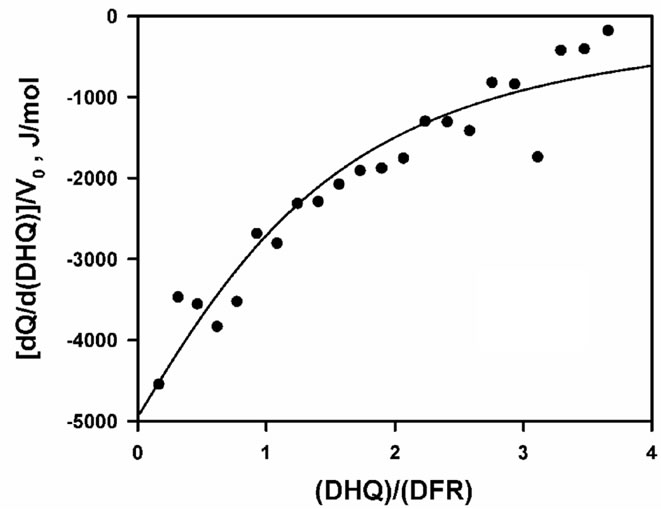 (b)
(b)
Figure 7. Microcalorimetric titration of Vv-DFR by DHQ at pH 6.5 and 30˚C. (ET)0 = 90 µM in Bistris/Tricine (2 × 50 mM), 2% ethanol, 200 mM NaCl, 2.5% glycerol (v/v). (a) Isothermogram obtained upon subtraction of the baseline observed in the absence of Vv-DFR; (b) data analysis; the continuous line is the theoretical fit obtained by non-linear adjustment of Eq.1(a) for a single binding site (n = 1), which led to KDHQ = 97.4 ± 23.6 µM and DH0 = –10.3 ± 1.02 kJ·mol-1; no stable solution was obtained for n = 2.
mechanism is ordered-on in the absence of substrate inhibition, with NADPH binding first and at least NADP+ released last. Because leucocyanidin—an unstable product—was unavailable for kinetic or binding studies, we could not study its inhibitory effect and we could not assess the efficiency of the enzyme in the backward direction of the reaction. Unexpectedly however, our binding-equilibrium data clearly demonstrate that DHQ actually binds to the apoenzyme at pH 6.5 and pH 7.5, in either case with a single binding site. Since a random-on mechanism is not supported by the kinetic data in the absence of substrate inhibition, it is very likely that the binary E.DHQ complex cannot bind to NADPH to yield a productive E.NADPH.DHQ complex. It should be underlined that our inhibition patterns were obtained at low DHQ concentrations and do not strictly rule out a partially productive random-on mechanism at high/inhibitory DHQ concentration, but the unproductive binding of DHQ should then be highly favored given the strong substrate inhibition. Moreover, with such a mechanism, the isomerisation of the central ternary complex (EAB ↔ EPQ; see Figure 8) should not be rate-limiting over the whole range of substrate concentrations. Therefore, a rapid-equilibrium hypothesis (Scheme 7, Eq.7 in Appendix) should not be applied (its use gives no fit anyway), and a strict steady-state hypothesis (Scheme 6, Eq.6 in Appendix) leads to rate equations which contain too many parameters for non-linear adjustment (no convergence), even in the absence of any product.
One possible explanation for the existence of a non productive E.DHQ complex would be that the polyphenolic structure is locked in a non-productive orientation. It is known that the tricyclic structure of flavonoids and their large number of phenolic and aliphatic hydroxyl groups tend to favor multiple binding configurations through hydrogen bonds and aromatic stacking. This is well documented in proline-rich proteins which are believed to play an important role in the astringency of polyphenols [33]. In Vv-DFR, we even described the 3D-structure of a crystallised quaternary complex containing NADPH and a pair of stacking molecules of quercetin [34]. Interestingly, in leucoanthocyanidin reductase from Vitis vinifera [35], another member of the short-chain dehydrogenase family whose substrate is the product of DFR, the productive binding configuration of the tricyclic structure is head-to-tail with respect to that observed in the homologous ternary abortive complex of Vv-DFR [15]. With Vv-DFR, head-to-tail and/or upside-down binding of the polycyclic structure would either prevent further binding of NADPH, or be incompatible with stereospecific hydride transfer (at C4) from NADPH if the latter did bind. Another possibility would be the existence of a regulatory DHQ-binding site distant from the active site. So far, neither the E.DHQ complex nor the apoenzyme could be obtained in crystallised form because very high concentrations of enzyme invariably lead to its aggregation/precipitation in the absence of NADPH. In the absence of a 3D-structure of the apoenzyme, we cannot use any docking software to extend our analysis and compare several possible structures of the E.DHQ complex. We do know however that Vv-DFR is able to produce a ternary abortive complex E.DHQ.NADP+, since the only 3D-structure of DFR which is known was obtained in our laboratory from its crystallised form [15]. Eight kinetic schemes which might be compatible with our observations are drawn in Figure 8. With the exception of Scheme 5 which is the
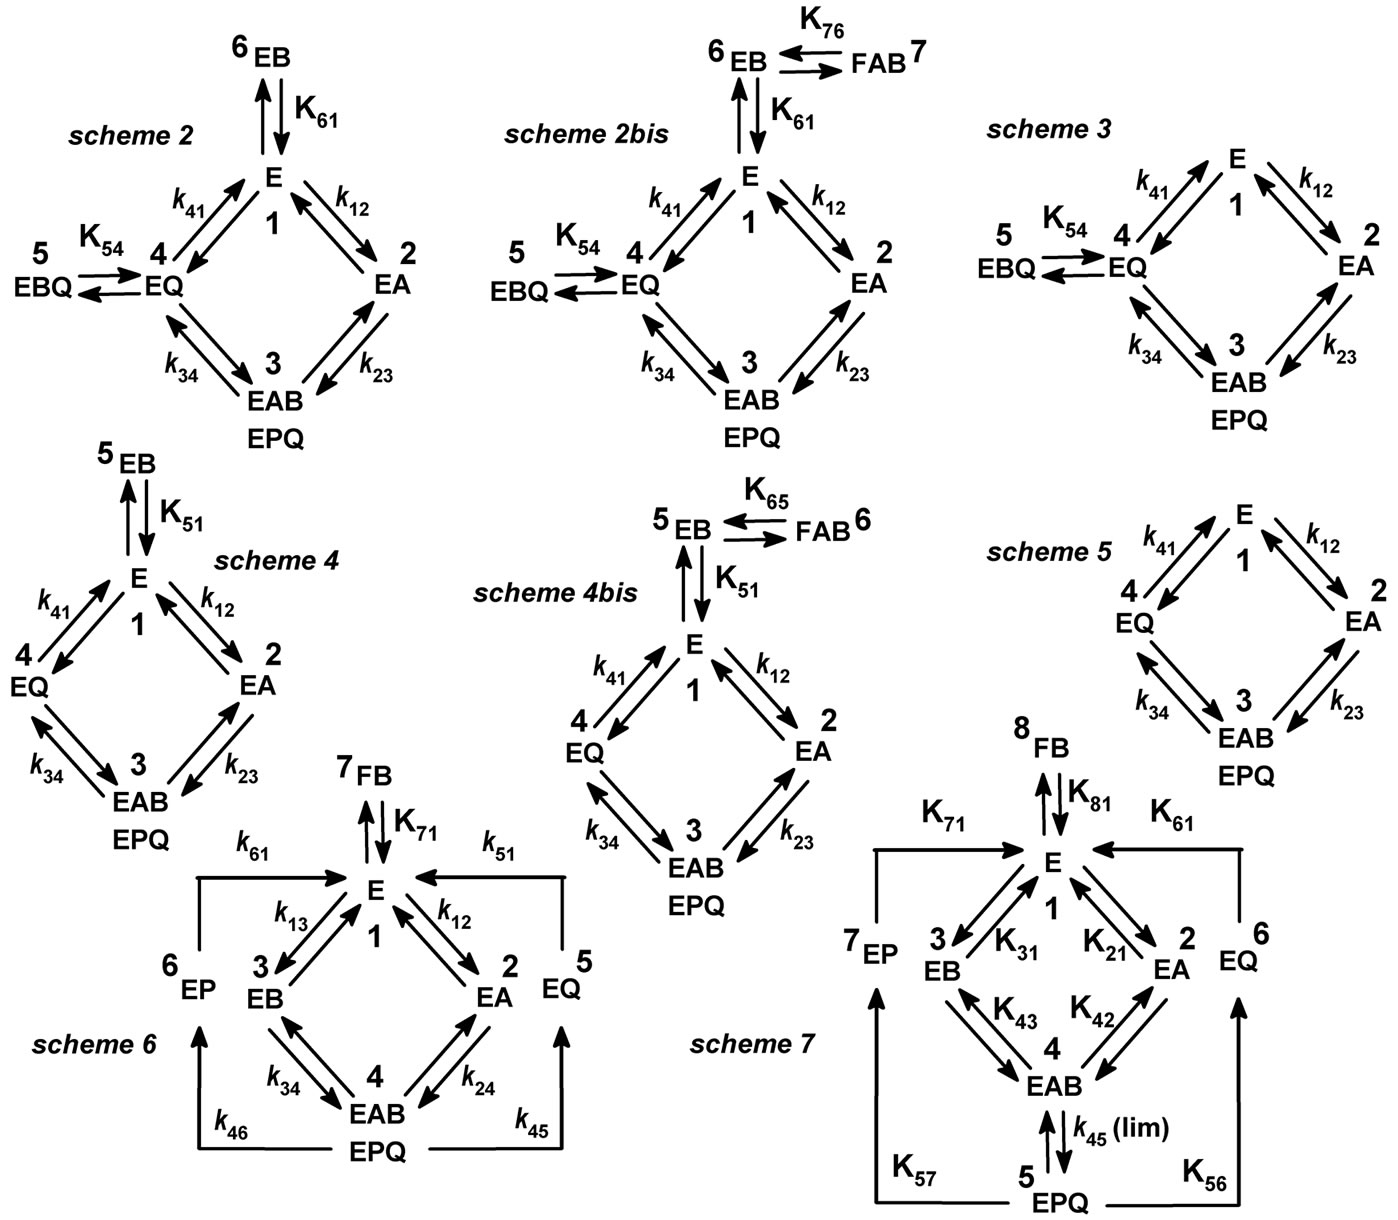
Figure 8. Potential kinetic mechanisms of Vv-DFR at pH 6.5. A = NADPH, B = DHQ, P = Leucocyanidin, Q = NADP+. Note that FAB is unproductive whereas EAB is a productive complex; Upper-case K are dissociation constants and lower-case k are rate constants. In Schemes 2-6, Briggs-Haldane kinetics are assumed, whereas in Scheme 7, a global rapid-equilibrium is assumed.
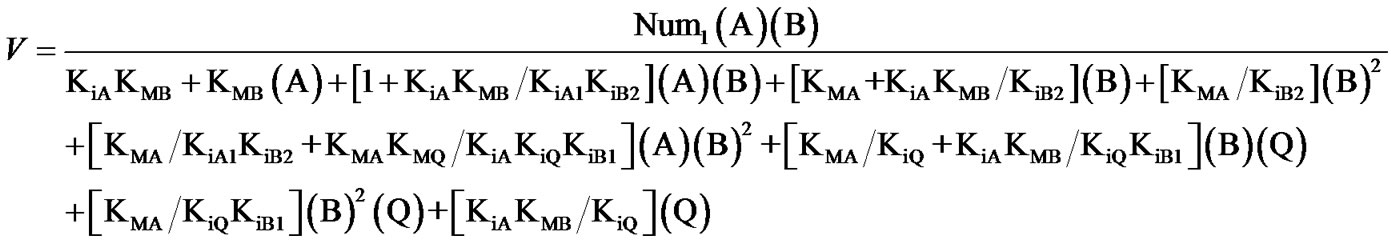
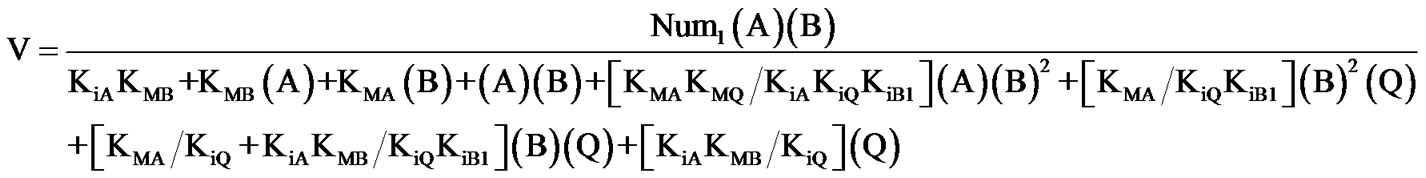
simplest version of a Bi Bi ordered mechanism, each of them should lead to substrate inhibition. Schemes 2-4 include simple dead-end complexes EB and/or EBQ, whereas in Schemes 2bis and 4bis, EB is not a dead-end complex by itself, but instead is connected to a dead-end ternary complex FAB (FAB is a convenient terminology to distinguish this dead-end complex in which B is presumably incorrectly positioned, from the productive complex EAB in which B is correctly positioned for hydride transfer). Rate equations derived from these mechanisms in the absence of product P, i.e. leucocyanidin, are developed in Appendix. As documented in Table 1, it turned out that only Schemes 2 and 2bis (Eqs. 2 and 2bis) gave a good fit to the whole set of kinetic data. This strongly suggests that the two dead-end complexes EBQ and EB are formed in our conditions and are both required to explain the observed substrate inhibition in the presence of NADP+. The addition of an unproduc

Table 1. Non-linear adjustment of parameters of Eqs.2-5 at pH 6.5.
tive ternary complex FAB markedly changes the estimations of several kinetic parameters, but only slightly alters the overall fit. More importantly however, the estimation of the new parameter (named KiA1 in Eq.4bis) is associated with a very high relative uncertainty, i.e. 75%, and we therefore think that Scheme 2 provides a safer mechanistic interpretation than the homologous Scheme 2bis. In Eq.2 as well as everywhere else in this paper, A = NADPH, B = DHQ and Q = NADP+. There are several possible definitions of Cleland's inhibition constants with an ordered Bi Bi mechanism. Here, KiA and KiQ were defined as true dissociation constants, i.e. KiA = k21/k12 and KiQ = k41/k14. Non-linear adjustment of parameters of Eq.2 to the whole set of kinetic data obtained at pH 6.5 gave the following estimations: Num1 = 359.7 ± 9.5 µM·min–1; KMA = 69.34 ± 3.62 µM; KMB = 252.6 ± 12.2 µM; KMQ = 1850 ± 109 µM; KiA = 14.62 ± 0.98 µM; KiQ = 7.51 ± 0.41 µM; KiB1 = 4507 ± 267 µM, and KiB2 = 42.1 ± 15.4 µM. Theoretical fits obtained from such estimations are shown in Figures 2, 3(a) and 4(a). As summarized in Table 1, Schemes 3, 4 and 4bis did not give a satisfactory fit, and deletion of terms containing either KiB1 or KiB2 in Eq.2 or 2bis markedly altered the fit. Thus, the two dead-end complexes EBQ and EB are required and we conclude that the kinetic mechanism which best accounts for substrate inhibition at pH 6.5 is that of Scheme 2. KiB2 is 2.3 times lower than the estimate of KDHQ which was obtained from isothermal titration calorimetry, but such a difference is not surprising since the titration had to be performed at higher ionic strength and in the presence of 2.5% glycerol, to avoid enzyme aggregation.
In Eq.2, Num1 is equal to the maximal velocity Vmax which would be expected if non-productive complexes did not form. Thus, the apparent maximal rate which may be reached at pH 6.5 is only about 6% of this theoretical Vmax. Finally, our best estimates of dissociation constants KiA and KiQ at pH 6.5 imply that the affinity of NADP+ for the apoenzyme is significantly higher than that of NADPH, which is not unusual with dehydrogenases. This inhibitory effect of NADP+ should not be of physiological significance, because the ratio (NADPH)/ (NADP+) is generally very high in the cytosol.
An interesting feature of our mechanism is the formation of a dead-end enzyme-substrate complex E.DHQ. In the absence of NADP+, the latter is the only cause of substrate inhibition because there cannot be any abortive ternary complex E.DHQ.NADP+. The formation of an unproductive enzyme-substrate binary complex is not a new concept, but it is uncommon in sequential mechanisms and there seems to be very few studies [36-37] in which it apparently occurs without the concomitant formation of the corresponding productive complex. With Vv-DFR, our binding and kinetic data altogether support the conclusion that a productive ternary complex cannot be obtained when DHQ binds first. This mechanism of substrate inhibition might be useful to prevent the production of large concentrations of unstable leucocyanidin in vivo when the flux of DHQ production exceeds that of leucoanthocyanidin reductase and anthocyanidin synthase downstream.
5. ACKNOWLEDGEMENTS
We thankfully acknowledge the financial support of CIVB (Centre Interprofessionnel du Vin de Bordeaux).
REFERENCES
- Winkel-Shirley, B. (2001) Flavonoid biosynthesis. A colorful model for genetics, cell biology and biotechnology. Plant Physiology, 126, 485-493. doi:10.1104/pp.126.2.485
- Stintzing, F.C., Stintzing, A.S., Carle, R., Frei, B. and Wrolstad, R.E. (2002) Color and antioxidant properties of cyanidin-based anthocyanin pigments. Journal of Agricultural and Food Chemistry, 50, 6172-6181. doi:10.1021/jf0204811
- Scalbert, A. (1991) Antimicrobial properties of tannins. Phytochemistry, 30, 3875-3883. doi:10.1016/0031-9422(91)83426-L
- Walling, L.L. (2000) The myriad plant responses to herbivores. Journal of Plant Growth Regulation, 19, 195-216.
- Beecher, G.R. (2004) Proanthocyanidins: Biological activities associated with human health. Pharmaceutical Biology, 42, 2-20. doi:10.3109/13880200490893474
- Beecher, G. (2003) Overview of dietary flavonoids: Nomenclature, occurrence and intake. Journal of Nutrition, 133, 3248S-3254S.
- Graf, B.A., Milbury, P.E. and Blumberg, J.B. (2005) Flavonols, flavones, flavanones, and human health: Epidemiological evidence. Journal of Medicinal Food, 8, 281-290. doi:10.1089/jmf.2005.8.281
- Espin, J.C., García-Conesa, M.T. and Tomás-Barberán, F.A. (2007) Nutraceuticals: Facts and fiction. Phytochemistry, 68, 2986-3008. doi:10.1016/j.phytochem.2007.09.014
- Stafford, H.A. and Lester, H.H. (1982) Enzymic and nonenzymic reduction of (+)-dihydroquercetin to its 3,4,- diol. Plant Physiology, 70, 695-698. doi:10.1104/pp.70.3.695
- Stafford, H.A. and Lester, H.H. (1984) Flavan-3-ol biosynthesis: The conversion of (+)-dihydroquercetin and flavan-3,4-cis-diol (leucocyanidin) to (+)-catechin by reductases extracted from cell suspension cultures of Douglas fir. Plant Physiology, 76, 184-186. doi:10.1104/pp.76.1.184
- Helariutta, Y., Elomaa, P., Kotilainen, M., Seppänen, P. and Teeri, T.H. (1993) Cloning of cDNA coding for dihydroflavonol-4-reductase (DFR) and characterization of dfr expression in the corollas of Gerbera hybrida var. Regina (Compositae). Plant Molecular Biology, 22, 183- 193. doi:10.1007/BF00014927
- Martens, S., Teeri, T. and Forkmann, G. (2002) Heterologous expression of dihydroflavonol 4-reductases from various plants. FEBS Letters, 531, 453-458. doi:10.1016/S0014-5793(02)03583-4
- Fischer, T.C., Halbwirth, H., Meisel, B., Stich, K. and Forkmann, G. (2003) Molecular cloning, substrate specificity of the functionally expressed dihydroflavonol 4-reductases from Malus domestica and Pyrus communis cultivars and the consequences for flavonoid metabolism. Archives of Biochemistry and Biophysics, 412, 223-230. doi:10.1016/S0003-9861(03)00013-4
- Xie, D.Y., Jackson, L.A., Cooper, J.D., Ferreira, D. and Paiva, N.L. (2004) Molecular and biochemical analysis of two cDNA clones encoding dihydroflavonol-4-reducetase from Medicago truncatula. Plant Physiology, 134, 979-994. doi:10.1104/pp.103.030221
- Petit, P., Granier, T., Langlois d’Estaintot, B., Manigand, C., Bathany, K., Schmitter, J.M., Lauvergeat, V., Hamdi, S. and Gallois, B. (2007) Crystal structure of grape dihydroflavonol 4-reductase, a key enzyme in flavonoid biosynthesis. Journal of Molecular Biology, 368, 1345-1357. doi:10.1016/j.jmb.2007.02.088
- Springob, K., Nakajima, J., Yamazaki, M. and Saito, K. (2003) Recent advances in the biosynthesis and accumulation of anthocyanins. Natural Product Reports, 20, 288-303. doi.org/10.1039/b109542k
- Veitch, N.C. and Grayer, R.J. (2008) Flavonoids and their glycosides, including anthocyanins. Natural Product Reports, 25, 555-611. doi.org/10.1039/b718040n
- Xie, D.Y. and Dixon, R.A. (2005) Proanthocyanidin biosynthesis—Still more questions than answers? Phytochemistry, 66, 2127-2144. doi:10.1016/j.phytochem.2005.01.008
- Beld, M., Martin, C., Huits, H., Stuitje, A.R. and Gerats, A.G. (1989) Flavonoid synthesis in Petunia hybrida: Partial characterization of dihydroflavonol-4-reductase genes. Plant Molecular Biology, 13, 491-502. doi:10.1007/BF00027309
- Johnson, E.T., Yi, H., Shin, B., Oh, B.J., Cheong, H. and Choi, G. (1999) Cymbidium hybrida dihydroflavonol 4- reductase does not efficiently reduce dihydrokaempferol to produce orange pelargonidin-type anthocyanins. The Plant Journal, 19, 81-85. doi.org/10.1046/j.1365-313X.1999.00502.x
- Johnson, E.T., Ryu, S., Yi, H., Shin, B., Cheong, H. and Choi, G. (2001) Alteration of a single amino acid changes the substrate specificity of dihydroflavonol 4-reductase. The Plant Journal, 25, 325-333. doi:10.1046/j.1365-313x.2001.00962.x
- Punyasiri, P.A.N., Abeysinghe, I.S.B., Kumar, V., Treutter, D., Duy, D., Gosch, C., Martens, S., Forkmann, G. and Fischer, T.C. (2004) Flavonoid biosynthesis in the tea plant Camellia sinensis: Properties of enzymes of the prominent epicatechin and catechin pathways. Archives of Biochemistry and Biophysics, 431, 22-30. doi:10.1016/j.abb.2004.08.003
- Lo Piero, A.R., Puglisi, I. and Petrone, G. (2006) Gene characterization, analysis of expression and in vitro synthesis of dihydroflavonol 4-reductase from [Citrus sinensis (L.) Osbeck]. Phytochemistry, 67, 684-695. doi:10.1016/j.phytochem.2006.01.025
- King, E.L. and Altman, C. (1956) A schematic method of deriving the rate laws for enzyme-catalysed reactions. The Journal of Physical Chemistry, 60, 1375-1378. doi:10.1021/j150544a010
- Cha, S. (1968) A simple method for derivation of rate equations for enzyme-catalyzed reactions under the rapid equilibrium assumption or combined assumptions of equilibrium and steady state. The Journal of Biological Chemistry, 243, 820-825.
- Cleland, W.W. (1963) The kinetics of enzyme-catalysed reactions with two or more substrates or products: I. Nomenclature and rate equations. Biochimica et Biophysica Acta, 67, 104-137. doi:10.1016/0926-6569(63)90211-6
- Marquardt, D.W. (1963) An Algorithm for least squares estimation of nonlinear parameters. Journal of the Society for Industrial and Applied Mathematics, 11, 431-441. doi:10.1137/0111030
- Hummel, J.P. and Dreyer, W.J. (1962) Measurement of protein-binding phenomena by gel filtration. Biochimica et Biophysica Acta, 63, 530-532. doi:10.1016/0006-3002(62)90124-5
- Sébille, B., Zini, R., Madjar, C.V., Thuaud, N. and Tillement, J.P. (1990) Separation procedures used to reveal and follow drug-protein binding. Journal of Chromatography B: Biomedical Sciences and Applications, 531, 51-77.
- Wiseman, T., Williston, S., Brandts, J.F. and Lin, L.N. (1989) Rapid measurement of binding constants and heats of binding using a new titration calorimeter. Analytical Biochemistry, 179, 131-137. doi:10.1016/0003-2697(89)90213-3
- Florini, J.R. and Vestling, C.S. (1957) Graphical determination of the dissociation constants for two-substrate enzyme systems. Biochimica et Biophysica Acta, 25, 575-578. doi:10.1016/0006-3002(57)90529-2
- Scatchard, G. (1949) The attractions of proteins for small molecules and ions. Annals of the New York Academy of Sciences, 51, 660-672. doi:10.1111/j.1749-6632.1949.tb27297.x
- Baxter, N.J., Lilley, T.H., Haslam, E. and Williamson, M.P. (1997) Multiple interactions between polyphenols and a salivary proline-rich protein repeat result in complexation and precipitation. Biochemistry, 36, 5566-5577. doi:10.1111/j.1749-6632.1949.tb27297.x
- Trabelsi, N., Petit, P., Manigand, C., Langlois d’Estaintot, B., Granier, T., Chaudière, J. and Gallois, B. (2008) Structural evidence for the inhibition of grape dihydroflavonol 4-reductase by flavonols. Acta Crystallographica Section D, 64, 883-891. doi:10.1107/S0907444908017769
- Maugé, C., Granier, T., Langlois d’Estaintot, B., Gargouri, M., Manigand, C., Schmitter, J.M., Chaudière, J. and Gallois, B. (2010) Crystal structure and catalytic mechanism of leucoanthocyanidin reductase from Vitis vinifera. Journal of Molecular Biology, 397, 1079-1091.
- Raval, D.N. and Wolfe, R.G. (1963) Malic dehydrogenase V. Kinetic studies of substrate inhibition by oxalacetate. Biochemistry, 2, 220-224. doi:10.1021/bi00902a003
- Strickler, M., Goldstein, B.M., Maxfield, K., Shireman, L., Kim, G., Matteson, D.S. and Jones, J.P. (2003) Crystallographic studies on the complex behavior of nicotine binding to P450cam (CYP101). Biochemistry, 42, 11943- 11950. doi:10.1021/bi034833o
APPENDIX: RATE EQUATIONS
They are numbered 2-7, in agreement with the corresponding mechanistic schemes of Figure 8. In the latter, A = NADPH, B = DHQ, and Q = NADP+. Terms containing (P) have been discarded since leucocyanidin was never present in the reactional medium. Terms containing Q were also discarded for the random mechanisms 6 and 7. KiA, KiB and KiQ are Cleland’s inhibition constants used to format Eq.5, and among them, only KiA and KiQ were defined as true dissociation constants. KiB1, KiB2 and KiA1 stand respectively for the dissociation constants of EBQ into EQ, EB into E and FAB into EB. The analytical expressions of constants which appear in Eq.5 remain unchanged in equations derived from variants of Scheme 5. In the latter, Num1 is analytically equivalent to Vmax in Eq.5, but it is not equal to the apparent maximal velocity.
 (2)
(2)
with KiB1 = K54, KiB2 = K61 and Num1 = Vmax of Eq.5.
(2bis)
with KiA1 = K76, KiB1 = K54, KiB2 = K61 and Num1 = Vmax of Eq.5.
 (3)
(3)
with KiB1 = K54.
 (4)
(4)
with KiB2 = K51 and Num1 = Vmax of Eq.5.

(4bis)
with KiA1 = K65, KiB2 = K51 and Num1 = Vmax of Eq.5.
 (5)
(5)
with: Vmax = [k34k41/(k34 + k41)](ET) KMA = k34k41/k12(k34 + k41)
KMB = k41(k32 + k34)/k23(k34 + k41) KMP = k21(k32 + k34)/k43(k21 + k32)
KMQ = k21k32/k14(k21 + k32) KiA = k21/k12
KiB = (k21 + k32)/k23 KiQ = k41/k14
 (6)
(6)
parameters Ni (i = 1 to 3) and Dj (j = 1 to 8) are not developed due to lack of space.
 (7)
(7)