Journal of Environmental Protection
Vol. 4 No. 9 (2013) , Article ID: 37335 , 16 pages DOI:10.4236/jep.2013.49118
A Life Cycle Assessment Based Evaluation of a Coupled Wastewater Treatment and Biofuel Production Paradigm*
![]()
1Department of Civil and Environmental Engineering, University of Pittsburgh, Pittsburgh, USA; 2School of Sustainable Engineering and the Built Environment, Global Institute of Sustainability, Arizona State University, Engineering G-Wing, Tempe, USA; 3Department of Systems Engineering and Management, Air Force Institute of Technology, WPAFB, USA.
Email: *harper@afit.edu
Copyright © 2013 Monica C. Rothermel et al. This is an open access article distributed under the Creative Commons Attribution License, which permits unrestricted use, distribution, and reproduction in any medium, provided the original work is properly cited.
Received May 3rd, 2013; revised June 11th, 2013; accepted July 2nd, 2013
Keywords: Wastewater; Biofuels; Life Cycle Assessment; Nitrogen; Carbohydrate
ABSTRACT
A laboratory experiment was performed to determine the feasibility of coupling a conventional wastewater treatment system with an algal photobioreactor (PBR) for the removal of nutrients from wastewater and production of renewable resources. An activated sludge batch reactor was set up in series with an algal PBR to feed synthetic wastewater to Chlorella vulgaris. The nutrient concentration in the water as well as lipid content, carbohydrate content, and growth rate of the algal biomass were tested over 10 cycles to determine the capabilities of the coupled system. The study revealed complete nutrient removal in some cycles, with the average final nutrient content of 2 mg-P/L and 3 mg-N/L in effluent of the PBR. The algae biomass contained 24% ± 3% lipids and 26% ± 7% carbohydrates by dry weight. A life cycle assessment revealed the highest energy demand occurred during harvesting of the algal mixture through centrifugation or filtration, but the highest global warming and eutrophication impacts were due to CO2 use and PBR construction material production. It is feasible for the system to treat wastewater while generating renewable resources, but the system must be optimized to reduce life cycle environmental impacts and result in a net energy gain before large-scale implementation is possible.
1. Introduction
To meet growing clean water and energy demands, the concept of industrial symbiosis may be applied to a water and energy paradigm in which a wastewater treatment system is coupled with an algal photobioreactor (PBR). The paradigm has potential to reduce the environmental impacts of water and energy production by recovering resources from system wastes and using them to fuel other processes, making both water and energy production more sustainable.
The removal of nutrients from wastewater improves local water quality by decreasing eutrophication in receiving waterways [1,2], and may allow water to meet criteria for reuse [3]. The current solution to improving water quality through nutrient removal is to invest more energy and resources into wastewater treatment plants
(WWTPs) [1,2]. The nutrient concentration of wastewater can be reduced to low levels, but the advantages of advanced treatment are often offset by the additional consumption of energy and resources [1,2]. The additional burden placed on WWTPs will continue to increase as discharge requirements become more stringent in the future [4]. It is estimated that the addition of nitrification to an activated sludge wastewater treatment plant results in an increase of 60% - 80% of the energy consumed at the plant [5], and evidence suggests that nitrous oxide emissions increase when biological nutrient removal is added to a WWTP [6].
Meanwhile, the growing demand of energy has prompted the search for a safe, sustainable, and renewable energy source. The environmental, geopolitical, and economic consequences of fossil fuel production and use are well established. First generation biofuels produced from corn, soybeans, and other food crops compete with food supplies and would require vast amounts of land to replace fossil fuels [7-11].
Interest has been growing in third generation microalgal biofuels as an alternative to fossil fuels or first generation biofuels [7,8,10-12]. The advantages of microalgal biofuel production are numerous: they are renewable with short harvesting periods, do not compete with food sources, do not require large amounts of land, and can be grown with wastewater sources [7,8,10,11,13]. Despite tangible benefits of algae based biofuels, high production costs have inhibited commercial viability [10,12,14]. Stephenson et al. report that the phase with the highest impact during the biofuel production process is algae cultivation [11], and is therefore an area for potential improvement. Nutrients such as nitrogen and phosphorus are necessary for algae growth [7,8,13], but industrial fertilizer production results in about 50% of the energy use and greenhouse gas emissions in algae cultivation [13].
Wastewater can be used to supply nutrients to microalgal photobioreactors (PBRs) [7,11], thus reducing the impacts of the algae cultivation stage [13]. As algae consume nutrients during growth, wastewater quality is improved [7,13,15-18] and the energy requirement at municipal WWTPs can be reduced [13]. As algae consume nutrients, microalgal biomass in the reactor grows and accumulates lipids [8,10-12] which can then be extracted and processed to produce biodiesel [7,8,11], while carbohydrates found in algal biomass can be used to produce bioethanol [7,10,11]. Other useful products including biopolymers, fertilizer, and feedstock can be produced from algal biomass [7,8,10,11], resulting in a robust system.
Coupling wastewater treatment and algal cultivation is not new. High rate algal ponds have been used to remove nutrients and produce lipids [12]. Johnson and Wen, (2010) cultivated Chlorella sp. on a polystyrene foam matrix using dairy manure as the feedstock, and they observed lipid production and nutrient removal over a range of growth conditions [19]. Kong et al. (2010) carried out a similar study using planktonic cultures of Chlamydomonas reinhardtii fed with artificial media and different real wastewaters [20]. Woertz et al. (2009) treated diary wastewater outdoors with microalgae supplemented with CO2 [21]. None of the previous studies have produced the guidance that is needed to successfully and sustainably implement this approach because their data was not used for life cycle assessment (LCA). LCA is a tool which can be used to assess environmental sustainability in terms of the cradle-to-grave environmental impacts of a process before it is fully implemented [22]. Previous life cycle studies of algae cultivation have relied upon theoretical yields of biomass cultivated in wastewater, and many do not consider the additional treatment of wastewater as an added benefit to biofuels production. Currently, there is a need to use LCA to evaluate the long term sustainability of using algae to remove nutrients and produce lipids [7,10,13]. The overall goal of this research is to carry out a LCA-based evaluation of a coupled wastewater treatment/biofuel production system. We determined the energy production and nutrient removal capabilities of an algal PBR being fed with wastewater, and the associated energy demands and environmental impacts of a coupled WWTP/PBR system.
2. Materials and Methods
2.1. Laboratory Setup
A conventional bioreactor (CBR) consisting of primary wastewater treatment with basic activated sludge seconddary treatment for the removal of organics was a 5 L liquid volume sequencing batch reactor operated with a 24 hour cycle (Figure 1). The biomass for the reactor came from the McKeesport, PA wastewater treatment plant. The sequencing batch system was automated as follows: 20 hour and 10 minute mixing period, 3 hour and 45 minute settling period, and 3 minute effluent discharge. The CBR was fed synthetic wastewater, and not real sewage, in order to maintain consistency in the influent wastewater. Acetate was the primary substrate because it is readily biodegradable and it is an important substrate in real wastewater because it is produced in sewers and/or in preliminary treatment steps [26]. The biological
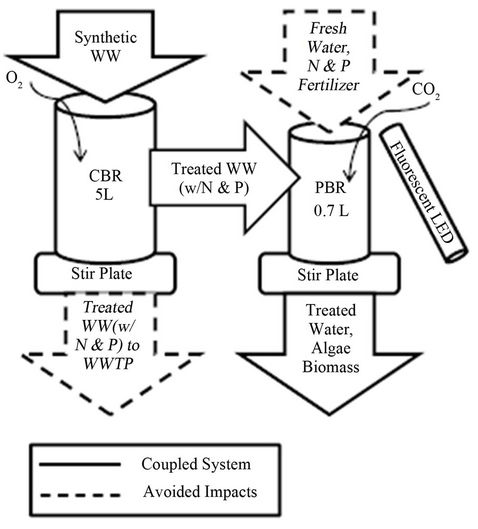
Figure 1. Laboratory setup of coupled system.
oxygen demand (BOD) of the synthetic wastewater was 300 mg/L and nutrients were fed in the form of ammonium chloride, potassium phosphate (monoand di-basic) in a BOD:N:P ratio of 30:3:1 [26] along with trace metals. The CBR feed solution can be found in Supporting Information (Table S1). The solid retention time (SRT) and hydraulic retention time (HRT) of the CBR were 20 and 10 days, respectively. The CBR pH control was automated to remain between 7 and 7.5 using sodium hydroxide and hydrochloric acid. Mixing and aeration were provided using a magnetic stir rod and air pump.
Effluent from the CBR was used to supply the PBR with water and nutrients. Algae were cultivated in the PBRs with a 7-day cycle time; this cycle time is different from that of the CBR because the PBR required one week for adequate growth of biomass. The PBR consisted of a glass cylinder, 15 cm tall and 7.5 cm in diameter with a working volume of 700 mL. The inoculum was Chlorella vulgaris algae strain, cultivated at the University of Texas at Austin (UTEX 1803). This strain was used because it is a well-characterized and our results can be readily compared to other studies. Continuous lighting was provided by two 8-Watt tube fluorescent LEDs located 7 cm from either side of the PBR. The LED light had a wavelength range of 390 - 780 nm. The PBR was mixed using a stir plate and magnetic stir rod. Mixing allowed nutrients to be dispersed throughout the reactor and provided algae with beneficial light and dark cycles conducive to growth in a concentrated system [23].
The coupled system consisted of a 5 L conventional bioreactor (CBR) and a 0.7 L photobioreactor (PBR). Both reactors were mixed using a stir rod and stir plate. Oxygen was added to the CBR for aeration, while carbon dioxide was added to the PBR to stimulate algae growth. Lighting for the PBR was provided continuously by a fluorescent LED tube light. The lightweight solid line represents the coupled system used in the experiment, while the dashed line indicates water and nutrient flows which can be avoided by coupling the system.
Carbon dioxide CO2 was supplied to the PBR from a k-size tank via stone aerators. Because of the great impact a continuous CO2 feed would have on the pH of the PBR, a discontinuous feed of CO2 was supplied at a rate of about 5 g CO2/day. The pH in the PBR was monitored by a pH probe. Because of the rapid decrease in the pH of the water when CO2 was added to the PBR, NaHCO3 was added as a buffer to stabilize the pH when needed. Temperature was kept constant at 20˚C in the CBR and PBR. Each week, 250 mL of the algae mixture was harvested from the PBR and replaced with 250 mL of nutrient-rich effluent wastewater from the CBR.
2.2. Analytical Methods
Water going into the CBR (influent) was a synthetic wastewater feed with controlled nutrient levels comparable to influent at a wastewater treatment plant. Water quality was tested on water coming out of the CBR (CBR effluent), and in the PBR at the beginning and end of each cycle for 10 consecutive cycles (Cycles 1 - 10). Cycles were defined as the 7-day growth period following the addition of CBR effluent to the PBR. Each cycle ended with the harvesting of 250 mL of algae mixture from the PBR, which was then replaced by 250 mL CBR effluent for the next cycle. Standard Methods [24] were used to measure ammonia-nitrogen (APHA 4500-NH3 C), nitrite-nitrogen (APHA  B), nitrate-nitrogen (APHA
  D), orthophosphate-phosphorus (APHA 4500-P C), and total suspended solids (APHA 2540 D). Ammonia-nitrogen, nitrite-nitrogen, and orthophosphate-phosphorus concentrations were measured using a Spectronic 20 spectrophotometer (Bausch and Lomb), while nitrate-nitrogen concentrations were measured using a nitrate electrode (Oakton Nitrate Double-junction Ion-Selective Electrode). The optical density of the samples was measured at 600 nm using a Spectronic 20 spectrophotometer (Bausch and Lomb) as a non-destructive estimate of total suspended solids (TSS) (see Supporting Information, Figure S1). This technique was selected in order to preserve sample volume. The algal pigments can introduce ~10% error into OD measurements [18], but this disadvantage is unlikely to obscure large differences in algal growth rates. The change in TSS was used as a measure of biomass growth in the PBR.
During Cycle 9, the water quality and optical density were measured daily to evaluate nutrient removal patterns in the reactor throughout the cycle. These measurements were compared to an additional low concentration PBR during Cycle 9 only; the low concentration PBR consisted of a C. vulgaris algae mixture diluted to 100 mg/L at the beginning of the cycle and was set up and run in the same manner as the original reactor. The purpose of the Cycle 9 measurements was to determine the impact of cell density on the growth and nutrient removal pattern.
Microscopic measurements were carried out to quailtatively confirm that lipids were generated by the PBR while also removing nutrients from wastewater. Carbohydrates were measured to determine the possible bioethanol production capabilities from the PBR. The algal biomass was analyzed using fluorescent microscopy to detect lipid droplets [25]. A sample containing algae cells was taken at the end of each cycle. The algal cells were plated on sterile glass coverslips, fixed with paraformaldehyde, and then incubated in Nile Red. The hydrophobicity of the Nile Red dye is responsible for the partitioning onto the lipid droplets. The visual analysis was carried out using a Nikon Eclipse E800 Biorad confocal fluorescent microscope (B&B Microscopes, Ltd.) at 60 times magnification to determine the approximate lipid content of the sample. A total of 140 cells were analyzed. Lipid extraction was also done on a limited number of algal samples in order to confirm the presence of polyhydroxyalkanoate (PHA)-based lipids by GC (see supplemental information, Figure S1). The carbohydrate content in the algae biomass at the end of each PBR cycle was measured by the anthrone method [26]. The absorbance of treated biomass samples was measured using a Spectronic 20 spectrophotometer (Bausch and Lomb), and these absorbance measurements were compared with those of treated glucose samples to determine the carbohydrate content of the algal biomass.
2.3. Life Cycle Assessment Methodology
The environmental impacts of the algae cultivation and harvesting phases in a coupled system were analyzed using a Life Cycle Assessment (LCA). The ISO 14040 method [27] was used to conduct the LCA; the four steps of an LCA, including 1) Goal and Scope Definition, 2) Life Cycle Inventory, 3) Life Cycle Impact Assessment, and 4) Interpretation and Improvement Analysis, were completed as a part of this study. Life cycle cost assessment was not in the scope of this study.
Goal and Scope Definition: The goal of this study was to determine the life cycle environmental impacts of algae cultivation and harvesting in a system coupled with wastewater treatment in terms of global warming potential (GWP) and eutrophication potential (EP), and also to determine the direct energy use during cultivation and harvesting of microalgae for biofuels and other renewable products. Although other environmental impacts could be assessed, the focus of the study is the reduction of GWP and EP through the use of the coupled system and therefore, these impact categories were chosen as the focus of the study.
The functional unit was defined in this study as 1000 MJ of microalgal diesel. The function of the algae cultivation system in this study was assumed to be to produce energy in the form of biodiesel from algae; therefore, the functional unit was based on a unit of energy which could be obtained from the algae. By normalizing impacts to a unit of energy, the life cycle impacts of algae cultivation and harvesting can easily be compared to sources of energy obtained through other algae cultivation and harvesting scenarios as well as to energy obtained from other sources such as fossil fuels or 1st generation biofuels.
The process LCA conducted is an improvement LCA; it is the aim of the study to show that the life cycle environmental impacts of algae cultivation for biofuels can be reduced through coupling the system, and to determine other areas or processes in the algae cultivation and harvesting process where impacts could be reduced.
System boundaries of the study are shown in Figure 2. The focus of this study was the cultivation stage, but, because algae cultivation increases TSS in the wastewater to unacceptable levels, an assumption was made that the algae mixture would have to go through the harvesting stage in order for water to be at an equivalent quality level to that being treated by nitrification/denitrification and chemical phosphorus removal. Therefore, both the cultivation and harvesting stages were considered in this assessment. It is assumed that, aside from PBR construction, existing infrastructure could be used for cultivation and harvesting, and transportation would be minimized by cultivating algae close to the wastewater treatment plant.
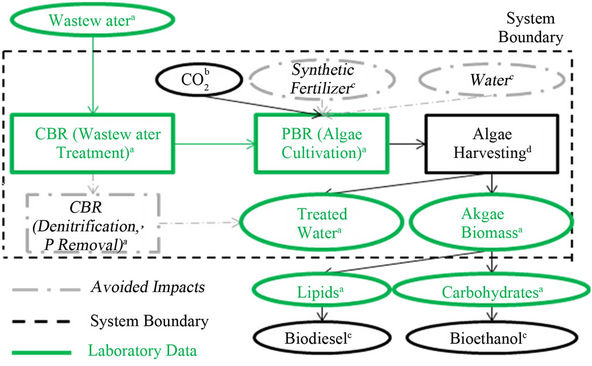
Figure 2. Life cycle assessment study boundaries.
When coupling the wastewater treatment system with an algal photobioreactor, the need for synthetic fertilizers for algae cultivation and the need for denitrification and phosphorus removal in the wastewater treatment plant is eliminated. When considering algae cultivation and harvesting for the production of biofuels only in the LCA, the ability of the algae to remove nutrients during cultivation is not directly accounted for. Therefore, the impacts of the energy and chemicals that would have been needed to produce final products equal in quality to those produced by the coupled system were considered to be avoided impacts in the system and were taken as negative values in the life cycle impact assessment.
The system boundaries include partial treatment in a conventional bioreactor (CBR) coupled with algae cultivation in an algal photobioreactor (PBR) and harvesting of the algae. Final products produced in the system are treated water and algae biomass. Equivalent products could be produced through the use of further treatment in the CBR consisting of denitrification and phosphorus removal, or through the use of synthetic fertilizers for algae cultivation. These products and processes are therefore considered to be avoided impacts. The life cycle inventory was calculated using data from a) laboratory results, b) laboratory results and [28], c) not directly considered in study, d) [29,30], e) [31,32].
The life cycle environmental impacts of algae cultivation and harvesting were calculated assuming a large scale process would be capable of biomass yields, lipid yields, and nutrient removal efficiency from the system in the study, but that production would take place in an industrial setting in the United States. Therefore, Industrial type PBR configurations, mixing, CO2 transfer, harvesting, and conventional wastewater treatment were considered in a scaled-up coupled system for the LCA. Because there are currently no full scale coupled systems in existence, the scale up of the laboratory system was completed based on the best available data and projecttions of how a full scale algae cultivation and harvesting system would likely operate based on existing industrial processes. Laboratory data as well as other published data was used in the study; the source of the data used for each process are shown in Supporting Information (Table S10).
Life Cycle Inventory: Life cycle inventory data was collected from various databases as well as lab data. The inventory and databases as well as calculated inputs to the system are shown in Supporting Information (Tables S9 and S10).
Life Cycle Impact Assessment: Inputs to the system were analyzed using the Tool for the Reduction and Assessment of Chemical and Other Environmental Impacts (TRACI) [33] to determine the life cycle environmental impacts of a hypothetical large-scale algae cultivation and harvesting system in the US. The GWP and EP of the system were looked at in detail as these are areas of concern specifically related to the study. Additionally, the direct energy use (DEU) associated with each portion of the cultivation and harvesting stages was reported. Direct energy use is defined as the energy used during the cultivation and harvesting stages and does not include upstream or downstream energy use associated with these stages. See Supporting Information (Table S11) for Impact Assessment Calculations.
3. Results and Discussion
Experimental testing of the coupled system indicates that wastewater treatment can be coupled with a microalgal PBR to remove nutrients in the wastewater while producing precursors to multiple useful, renewable products. The examination of water quality in the coupled system showed removal of soluble orthophosphate and total inorganic nitrogen as well as nitrogen species. The production of precursors to beneficial products was evaluated, and final beneficial product yields from the system were estimated based on product content and additional literature. Life cycle environmental impacts of the system were calculated to determine hot-spots in the system, and these impacts were compared to existing related studies.
3.1. Water Quality
The quality of the effluent wastewater varied each week, which was consistent with performance variations at a full-scale treatment plant. In this study water quality was measured by the concentration of phosphorus and nitrogen species. N and P transformations were observed through each cycle of water treatment in the CBR and algae cultivation in the PBR. CBR effluent wastewater quality measurements are reported in more detail in Supporting Information (Table S2).
The average nutrient concentrations at various points in the system are shown in Figure 3. The average reduction of soluble orthophosphate through the system was 8.2 mg-P/L (82% reduction), while the average reduction of total inorganic nitrogen was 27.3 mg-N/L (91% reduction). Over all 10 individual PBR cycles, complete phosphorus removal was observed and nitrogen was reduced to a minimum of 1.9 mg-N/L, 75% reduction in the PBR. The change in phosphorus, total inorganic nitrogen, and nitrate concentration going into and out of the PBR were statistically significant at a p-value of 0.05, while the change in ammonia and nitrite concentration in the PBR were not statistically significant (see Supporting Information, Table S4).
Phosphorus, total inorganic nitrogen, ammonia-nitro-

Figure 3. Nutrient concentration at various points in the system.
gen, nitrite-nitrogen, and nitrate-nitrogen levels going into the conventional bioreactor (CBR), coming out of the CBR and going into the photobioreactor (PBR), and coming out of the PBR. Total inorganic nitrogen is the sum of ammonia-nitrogen, nitrite-nitrogen, and nitratenitrogen. 95% confidence intervals are shown for nutriaent concentration levels.
Nitrification in the CBR accounts for the discharge of nitrate into the PBR, but the data show that nitrate is removed in this microalgal system. This finding is important because activated sludge denitrification typically requires chemical (e.g. methanol) addition. The absence of nitrite in the system shows proper nitrification is occurring in the system. The reduction of nitrogen and phosphorus in the coupled system indicates the feasibility of removing nutrients in the system without the addition of chemicals for denitrification or chemical phosphorus removal.
In addition to testing water quality at the beginning and end of each cycle, the nutrient content of the water and optical density of the samples were taken each day for one complete cycle, cycle 9, in order to observe daily nutrient removal and growth. During cycle 9 only, a second low concentration PBR was built in the lab. The low concentration PBR was built and operated identically to the original PBR; the initial concentration of the PBR was the only difference between the two PBRs. Previous observations had shown cell death and poor nutrient removal in the original reactor when the concentration became too high in the reactor; therefore, the second PBR was created to compare nutrient removal and algae growth in a PBR with a high concentration of algal biomass at the beginning of the cycle to one with a lower concentration of algal biomass. It was hypothesized that faster nutrient removal and growth kinetics would be seen in the low concentration PBR than in the original PBR. The low biomass PBR was inoculated using 250 mL of algae from the original C. vulgaris reactor and was diluted with 500 mL of wastewater effluent from the CBR. Daily nutrient content and TSS in the PBRs are shown in Figure 4.
In both PBRs, soluble orthophosphate was removed within two days of the start of the cycle, while the concentration of nitrogen species continued to change over the entire cycle. Nutrient removal and solids growth in the high concentration PBR varied over the cycle with periods of increase in nutrient concentration and loss of TSS, while the low concentration PBR showed a gradual removal of nutrients with an associated increase in TSS over the cycle. Both reactors showed instances where phosphorus or ammonia content increased during the cycle. While the cause is unknown, the increases may be associated with cell death and subsequent release of stored nutrients back into the water [34].
Both PBRs showed an overall reduction in nutrient content and increase in TSS and associated biomass. The high concentration PBR removed 2.2 mg-N/L, a 56% reduction, and produced 470 mg/L of additional algae, while the low concentration PBR removed 8.3 mg-N/L, a 90% reduction, and produced 170 mg/L of additional algae. The difference in the influent nitrogen concentration may partially explain the relative performance of these PBRs. It is also possible that there were significant differences in the cellular physiology of these systems. The high concentration PBR may have a broader range of slower growing cells, resulting in profiles observed in this study. Future research can address this issue with quantitative PCR or other DNA-based measurements of gene expression and cellular activity. Since the low concentration PBR had better nutrient removal kinetics, it is probably possible to optimize the PBR so that the operating cycle time is closer to that of the CBR without being too short to support significant lipid yield (i.e. it may be possible to use a cycle time of 4 or 5 days instead of 7 days). Overall, these results show that there is likely a trade-off between nutrient removal and biomass production in a high concentration vs. low concentration reactor.
3.2. Value Added Products
Algal biomass is made up of lipids and carbohydrates, which are intermediate products capable of forming microalgal biodiesel and bioethanol, respectively. The composition and growth rate of the algae biomass coming from the PBR were analyzed to determine the coupled system’s capability of producing intermediate products which had the potential to become value-added products. The growth rate of the algae was determined by testing the TSS in the PBR at the beginning and end of each cycle.
The lipid content is based on the percentage of lipids per TSS (%Lipid/TSS). The final lipid content for each cycle ranged from 14% to 38% Lipid/TSS, while the
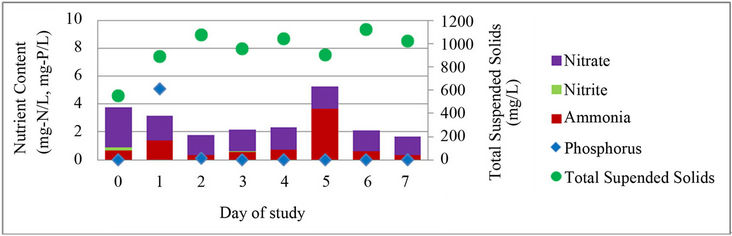 (a)
(a)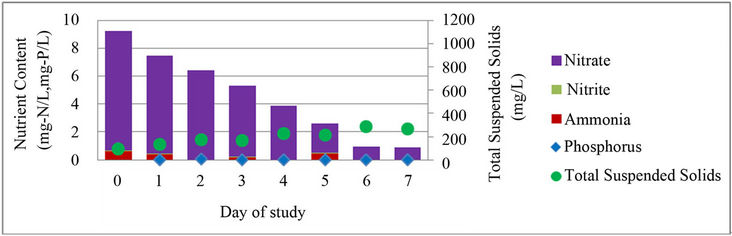 (b)
(b)
Figure 4. Daily nutrient content and TSS in algae cultivation cycle. (a) Original, high concentration PBR; (b) New, low concentration PBR; TSS and nutrient content in (a) concentrated PBR and (b) low concentration PBR.
average over all cycles was 24% ± 3% Lipid/TSS. These values are greater than values reported by Woertz et al. (4.9% - 11.3% by weight) for algae grown on municipal wastewater in an outdoor growth tank [21], but are below the average of 28% - 32% lipids by weight for Chlorella species [8]. The carbohydrate content is based on the percentage of carbohydrates per TSS (%CH/TSS). The final carbohydrate content for each cycle ranged from 16% to 38% CH/TSS, while the average over all cycles was 26% ± 7%CH/TSS. The average carbohydrate content was higher in this study than the average of 12% - 17% for chlorella species reported by Becker [35].
The growth rate of algae in the PBR ranged from −47 mg/day to 138 mg/day, with an average growth rate of 33 mg/day in the PBR (0.05 kg/m3/day average, 0.2 kg/m3 /day maximum). Negative growth rates occurred during cycles in which the TSS concentration was higher at the beginning of the cycle than at the end of the cycle. The cause of this reduction in concentration is unknown, but we hypothesize that it is a result of cell decay.
3.3. Life Cycle Assessment of Algae Cultivation and Harvesting in a Coupled System
Interpretation and Improvement Analysis: The life cycle impact assessment revealed that the energy use, global warming potential (GWP), and eutrophication potential (EP) of algae cultivation could be reduced by coupling a microalgal PBR with a conventional WWTP. These reductions are a result of avoiding further nutrient removal in a conventional wastewater treatment plant and avoiding fertilizer production for nutrient feed in the PBR. Although environmental impact reductions were seen, these reductions were minimal when compared to the entire cultivation and harvesting stages (Figure 5). The avoidance of further wastewater treatment accounted for less than 0.2% in all impact categories, and the avoidance of fertilizer production accounted for less than 2% in all impact categories.
Percentage of cultivation and harvesting phases contributing to Global Warming Potential (GWP), Eutrophication Potential (EP), and Direct Energy Use (DEU) in a scaled-up coupled system; Impacts from industrial CO2 (I-CO2), waste CO2 (W-CO2), Centrifugation (Cent.), and Filtration (Filt.).
The use of waste CO2 from other industrial processes would be more effective for reducing global warming and eutrophication impacts of algae cultivation and harvesting. However, the direct energy use (DEU), energy being consumed during the cultivation and harvesting phases of the life cycle, was higher when waste CO2 was used due to the additional energy used for collection and injection of the waste CO2 into the PBR. GWP, EP, and DEU could all be reduced by using a less intensive harvesting method such as filtration instead of centrifugation. The low-density polyethylene (LDPE) used to construct the PBR contributed a great amount to EP. Although LDPE has a lower EP than other materials including
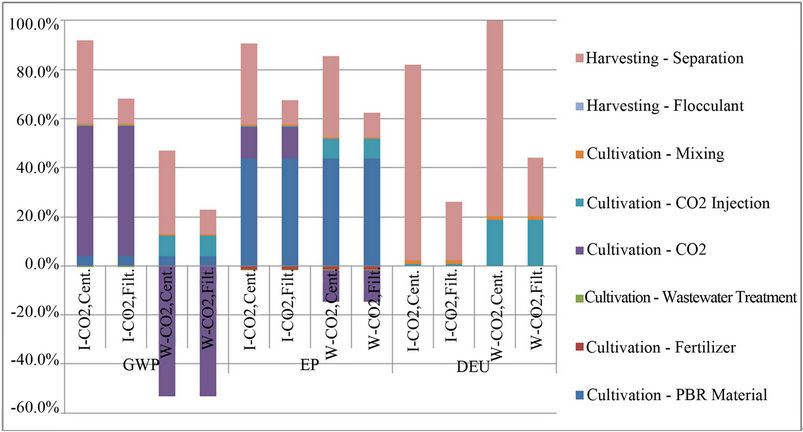
Figure 5. Environmental Impacts from the coupled wastewater-algae production system.
glass and high-density polyethylene, the vast amount of material needed for PBR construction increases the EP. PBRs must be engineered to have a higher productivity per amount of material in order to reduce EP. Separation of the algae from the wastewater results in the highest DEU in the system. The DEU can be reduced by other methods of separation, such as filtering by 26% as shown in Figure 5, however harvesting the algae still accounts for 54% to 97% of the energy use in the systems (W-CO2, Filt.; I-CO2, Cent., respectively), regardless of separation method. Other separation techniques, such as settling, auto-flocculation, and micro-screening [36] might provide additional DEU savings. Although solids in the water would have to be effectively reduced in order for the water to be reused after cultivation and harvesting, the energy requirements of harvesting algae are not specific to algae cultivated with wastewater.
The report demonstrates the benefit of using life cycle assessment in combination with laboratory-scale experimentation. It is important to note that LCA is not limited to the study of technologies that are operating at full scale or that have already been optimized. On the contrary, LCA can be used to holistically identify environmental impacts for systems that are not yet operating at full scale. This report is a good example, because the findings here show that the highest energy demands (harvesting of the algal mixture) and the highest environmental impacts (CO2 use and PBR construction) can be elucidated with LCA that is informed with experimental data. This principle can be extended more generally for future research. LCA should be employed while investigating technologies that are currently in the early stages of development and LCA should continue as new developments generate novel findings.
Advancing the full scale application of PBR/CBR combinations will depend on resolving key technical issues. A good example is related to the differences in the growth rates of aerobic heterotrophs (in the CBRs) and anaerobic algae (in the PBRs); these growth rates explain why the PBR discharged weekly, while the CBR operated on a one-day cycle. At full scale this issue can be handled by using PBRs to treat smaller, more concentrated wastewater streams (like digester supernatent) that are rich in nitrogen and phosphorus. It is also possible to use attached growth systems to uncouple the algal growth rate and the hydraulic retention time [e.g. 19]. Material selection is another key challenge. PBR/CBR combinations may take many different forms, each dependant on several design factors, including local conditions, site topography, geotechnical characteristics, and provisions for future modification. Open pond systems may make sense in some applications and engineered package systems are also possible. PBR systems can be customized with durable materials common to WWTP design. This may include a covered tank made of lowdensity polyethylene (as discussed above) or fiber-reinforced plastic (FRP). The equipment may include low speed mechanical mixers, submersible wastewater pumps with piping, valves, instrument air piping (for the compressed air used to open and close valves), and other appurtenances. Equipment and materials selections will impact the life cycle impacts of the coupled system and these choices must be made holistically. Currently, there are no full-scale coupled systems, but as this changes, it will be possible in the future to carry out life cycle assessments that are informed by practical experiences and real costs.
4. Acknowledgements
The authors thank Jason Monnell, Tom Harper, Reña Robinson, and Melissa Bilec for their guidance and use of their facilities. The authors also thank the staff at the McKeesport Water Authority for providing activated sludge. This work was funded by the Mascaro Center for Sustainable Innovation Seed Grant Program and by the National Science Foundation (NSF CBET Award No. 0932606/1241697). Any options, findings and conclusions or recommendations expressed in this material are those of the authors and do not necessarily reflect the views of NSF, the Air Force Institute of Technology, United States Air Force, Department of Defense, or United States government. The authors also thank the anonymous reviewers for their suggestions.
REFERENCES
- J. Foley, D. de Haas, K. Hartley and P. Lant, “Comprehensive Life Cycle Inventories of Alternative Wastewater Treatment Systems,” Water Research, Vol. 44, No. 5, 2010, pp. 1654-1666. doi:10.1016/j.watres.2009.11.031
- C. R. Burdick, D. R. Refling and H. D. Stensel, “Advanced Biological Treatment to Achieve Nutrient Removal,” Journal of Water Pollution Control Federation, Vol. 54, 1982, p. 1078.
- M. G. McGarry and C. Tongkasame, “Water Reclamation and Algae Harvesting,” Journal of Water Pollution Control Federation, Vol. 43, 1971, p. 824.
- J. Landers, Water Environment and Technology, Vol. 23, 2011, pp. 20-24.
- M. Maurer and T. A. L.,Schwegler, “Nutrients in Urine: Energetic Aspects of Removal and Recovery,” Water Science and Technology, Vol. 48, 2003, p. 37.
- M. J. Kampschreur, et al., “Dynamics of Nitric Oxide and Nitrous Oxide Emission during Full-Scale Reject Water Treatment,” Water Research, Vol. 42, No. 3, 2008, pp. 812-826. doi:10.1016/j.watres.2007.08.022
- L. Brennan and P. Owende, “Biofuels from Microalgae: A Review of Technologies for Production, Processing, and Extractions of Biofuels and Co-Products,” Renewable and Sustainable Energy Reviews, Vol. 14, No. 2, 2010, pp. 557-577. doi:10.1016/j.rser.2009.10.009
- Y. Chisti, “Biodiesel from Microalgae,” Biotechnology Advances, Vol. 25, No. 3, 2007, pp. 294-306. doi:10.1016/j.biotechadv.2007.02.001
- J. Hill, E. Nelson, D. Tilman, S. Polasky and D. Tiffany, “Environmental, Economic, and Energetic Costs and Benefits of Biodiesel and Ethanol Biofuels,” Proceedings of the National Academy of Sciences, Vol. 103, 2006, p. 11206.
- K. Sander and G. Murthy, “Life Cycle Analysis of Algae Biodiesel,” The International Journal of Life Cycle Assessment, Vol. 15, 2010, p. 704. doi:10.1007/s11367-010-0194-1
- A. L. Stephenson, et al., “Life-Cycle Assessment of Potential Algal Biodiesel Production in the United Kingdom: A Comparison of Raceways and Air-Lift Tubular Bioreactors,” Energy & Fuels, Vol. 24, No. 7, 2010, pp. 4062- 4077. doi:10.1021/ef1003123
- I. Rawat, R. R. Kumar, T. Mutanda and F. Bux, “Dual Role of Microalgae: Phycoremediation of Domestic Wastewater and Biomass Production for Sustainable Biofuels Production,” Applied Energy, Vol. 88, No. 10, 2011, pp. 3411-3424. doi:10.1016/j.apenergy.2010.11.025
- A. F. Clarens, E. P. Resurreccion, M. A. White and L. M. Colosi, “Environmental Life Cycle Comparison of Algae to Other Bioenergy Feedstocks,” Environmental Science & Technology, Vol. 44, No. 5, 2010, pp. 1813-1819. doi:10.1021/es902838n
- J. Sheehan, “A Look Back at the US Department of Energy’s Aquatic Species Program: Biodiesel from Algae,” National Renewable Energy Laboratory, Golden, 1998. doi:10.2172/15003040
- N. N. Bich, M. I. Yaziz and N. A. K. Bakti, “Combination of Chlorella vulgaris and Eichhornia crassipes for Wastewater Nitrogen Removal,” Water Research, Vol. 33, No. 10, 1999, pp. 2357-2362. doi:10.1016/S0043-1354(98)00439-4
- R. J. Craggs, P. J. McAuley and V. J. Smith, “Wastewater Nutrient Removal by Marine Microalgae Grown on a Corrugated Raceway,” Water Research, Vol. 31, No. 7, 1997, pp. 1701-1707. doi:10.1016/S0043-1354(96)00093-0
- W. J. Oswald, et al., “Algae in Waste Treatment [with Discussion],” Sewage and Industrial Wastes, Vol. 29, 1957, p. 437.
- M. Griffiths, C. Garcin and R. P. van Hille, “Interference by Pigment in the Estimation of Microalgal Biomass Concentration by Optical Density,” Journal of Microbiological Methods, Vol. 85, No. 2, 2011, pp. 119-123. doi:10.1016/j.mimet.2011.02.005
- M. Johnson and Z. Wen, “Development of an Attached Microalgal Growth System for Biofuel Production,” Applied Microbiology and Biotechnology, Vol. 85, No. 3, 2010, pp. 525-534. doi:10.1007/s00253-009-2133-2
- Q.-X. Kong, et al., “Culture of Microalgae Chlamydomonas reinhardtii in Wastewater for Biomass Feedstock Production,” Applied Biochemistry and Biotechnology, Vol. 160, 2010, p. 9. doi:10.1007/s12010-009-8670-4
- I. Woertz, et al., “Algae Grown on Dairy and Municipal Wastewater for Simultaneous Nutrient Removal and Lipid Production for Biofuel Feedstock,” Journal of Environmental Engineering, Vol. 135, No. 11, 2009, pp. 1115-1122. doi:10.1061/(ASCE)EE.1943-7870.0000129
- H. Baumann and A.-M. Tillman, “The Hitch Hiker’s Guide to LCA,” Studentlitteratur, 2004.
- H. Qiang and A. Richmond, “Productivity and Photosynthetic Efficiency of Spirulina platensis as Affected by Light Intensity, Algal Density and Rate of Mixing in a Flat Plate Photobioreactor,” Journal of Applied Phycology, Vol. 8, 1996, p.139. doi:10.1007/BF02186317
- APHA, “Standard Methods for the Examination of Water and Wastewater,” American Public Health Association, American Water Works Association, Water Pollution Control Federation, Washington DC, 1992.
- L. Listenberger and D. Brown, “Current Protocols in Cell Biology,” John Wiley & Sons, Inc., New York, 2001.
- D. Jenkins, M. Richard and G. Daigger, “Manual on the Causes and Control of Activated Sludge Bulking and Foaming,” Lewis Publishers, Boca Raton, 1993.
- ISO, Switzerland, Vol. 14040, 2006.
- K. L. Kadam, “Environmental Implications of Power Generation via Coal-Microalgae Cofiring,” Energy, Vol. 27, No. 10, 2002, pp. 905-922. doi:10.1016/S0360-5442(02)00025-7
- G. Shelef, A. Sukenik and M. Green, “Microalgae Harvesting and Processing: A Literature Review,” Solar Energy Research Institute, Golden, 1984. doi:10.2172/6204677
- L. Batan, et al., “Net Energy and Greenhouse Gas Emissions Evaluation of Biodiesel Derived from Microalgae,” Environmental Science & Technology, Vol. 45, No. 3, 2010, p. 1160. doi:10.1021/es1038479
- M. Maurer, P. Schwegler and T. A. Larsen, “Nutrients in Urine: Energetic Aspects of Removal and Recovery,” Water Science and Technology, Vol. 48, 2003, p. 37.
- M. Eddy and H. D. Stensel, “Wastewater Engineering: Treatment and Reuse,” McGraw Hill, 2004.
- J. C. Bare, “Traci,” Journal of Industrial Ecology, Vol. 6, No. 3-4, 2002, pp. 49-78. doi:10.1162/108819802766269539
- P. Fong, T. C. Foin and J. B. Zedler, “A Simulation Model of Lagoon Algae Based on Nitrogen Competition and Internal Storage,” Ecological Monographs, Vol. 64, No. 2, 1994, pp. 225-247. doi:10.2307/2937042
- E. W. Becker, “Microalgae: Biotechnology and Microbiology,” Cambridge University Press, Cambridge, 1994.
- S. Amin, “Review on Biofuel Oil and Gas Production Processes from Microalgae,” Energy Conversion and Management, Vol. 50, No. 7, 2009, pp. 1834-1840. doi:10.1016/j.enconman.2009.03.001
Supplement
1. Laboratory Data
Laboratory data was collected at the University of Pittsburgh’s Swanson School of Engineering in Pittsburgh, Pennsylvania.
1.1. CBR Feed Solution
The feed solution going into the CBR is shown in Table S1. 500 mL main feed influent and 0.5 mL trace feed were fed to the reactor daily.
1.2. CBR Effluent Quality
Water quality was measured on samples of CBR effluent going into the PBR for each cycle. Water quality in the CBR was monitored throughout the week for its daily cycles. The total suspended solids (TSS) concentration in water coming directly from the CBR was 11.3 mg/L, on average, while the pH was maintained at 7.2 on average with the addition of NaOH or HCl as needed. The nutriaent content of the CBR effluent for each cycle is shown in Table S2.
1.3. PBR Effluent Water Quality
The nutrient concentration of water in the PBR was measured at the beginning (Initial) and end (Final) of each cycle in water coming from the PBR. Initial measurements were made after wastewater was added to the PBR and mixed for an hour to ensure dispersion of the

Table S1. CBR Feed Solution.
wastewater throughout the PBR. Total inorganic nitrogen content was determined by adding the ammonia-nitrogen, nitrite-nitrogen, and nitrate-nitrogen concentrations. Nutrient concentration for Cycles 1 - 10 as well as the average and standard deviation for Initial and Final readings are shown in Table S3.
1.4. Change in Nutrient Concentration
The change in nutrient concentration in the wastewater between wastewater effluent going into the PBR and effluent coming from the PBR is shown in Table S4.
1.5. Algal Biomass Quality
1) Lipid Content The minimum, maximum, average, and median lipid content of the algae cells were recorded at the end of each cycle (Table S5). There was no statistical significance that the lipid content for any cycle was different than the average; therefore, the average lipid content was assumed to be consistent throughout all PBR cycles.
Algal samples were also tested for polyhydroxyalkanoates (PHAs) content using a modified GC method (15) as follows: 15 mL samples were collected on 25 mm Whatman filters and immediately dried at 103˚C for 1 h then stored in a desiccator at 4˚C prior to analysis. The samples were prepared for digestion by adding the following reaction components: 1 mL trichoroethylene, 1 mL of 4:1 n-propanol: HCl solution, and 50 uL of benzoic acid. The samples were sealed, and digested at 100˚C for 6 h. Samples were cooled and then extracted with 2 mL deionized water. A 2 uL sample was taken from the heavy organic phase at the bottom of the vial, and filtered (Aerodisc LC 13 mm syringe filters, PVDF membrane, Gelman No. 4455T, Gelman Laboratory, Ann Arbor, MI). The filtered samples were then diluted 1:10 in TCE, and 1 uL was injected into the FID GC (glass packed column, Chromosorb W-AW 80 - 100 mesh, Varian 3800). The GC temperature program was as follows: hold at 100˚C for 1 min, ramp to 160˚C at 10˚C/min, and ramp to 280˚C at the maximum rate and hold for 15 min. The injector and detector temperatures were 300˚C. Benzoic acid was used an as internal standard. Standards were prepared by the same method with a PHB/PHV co-polymer of natural origin (No. 40311-3, Sigma Aldrich Corporation, Milwaukee, WI). The results (Figure S1) produced several peaks that are associated with the various forms of PHA present (e.g. PHB, PHV, PHMB, etc…). These peaks show that PHAs were present. PHA quantification was not in the scope of this study.
2) Carbohydrate Content Carbohydrate content in the algal biomass was tested in triplicate at the end of each cycle. The average carbohydrate content for each cycle is shown in Table S6. It
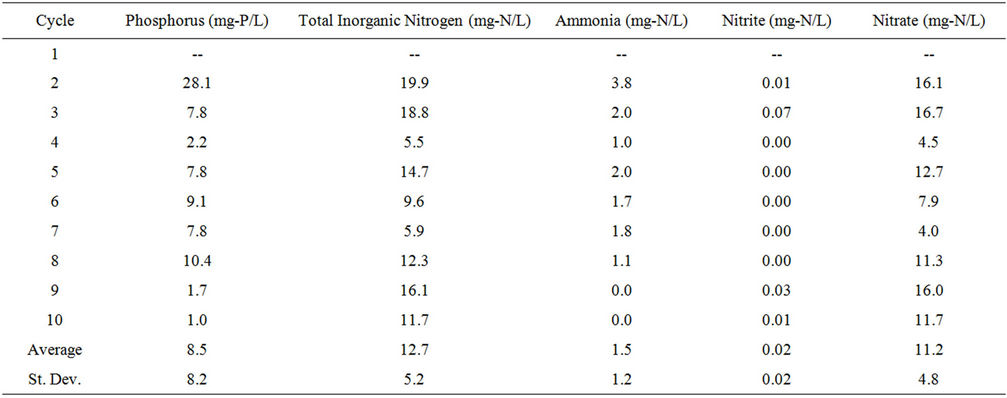
Table S2. Effluent wastewater nutrient content.
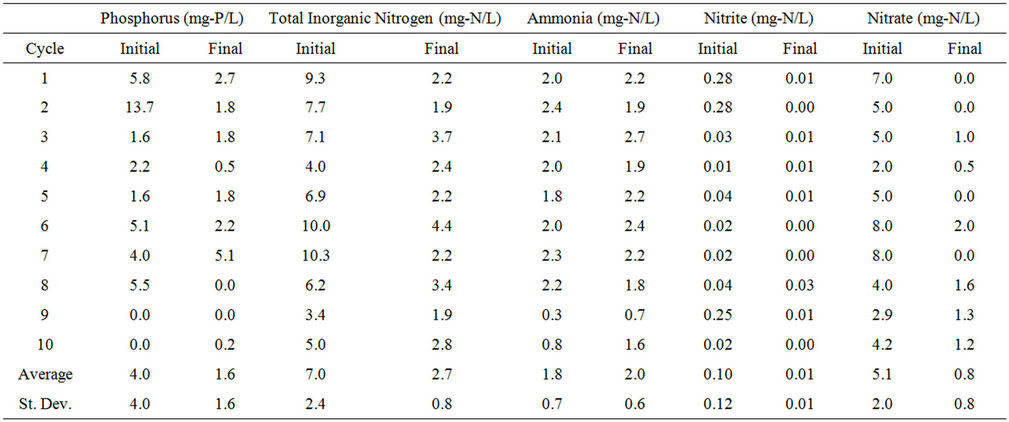
Table S3. Nutrient concentration in water in the PBR.
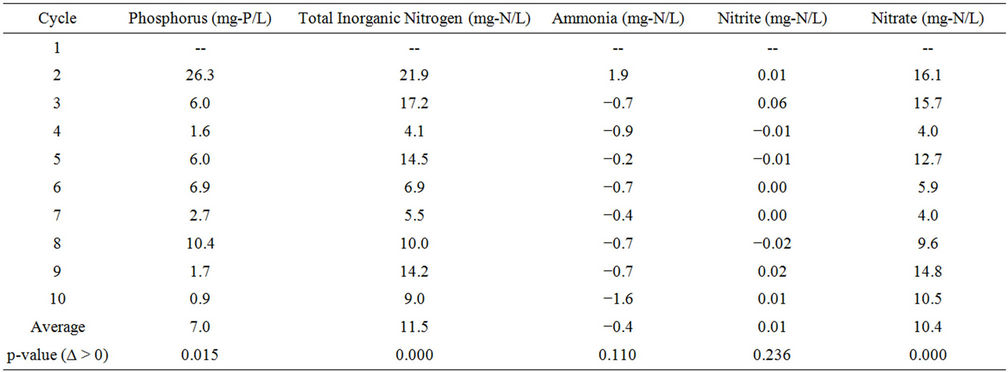
Table S4. Reduction in nutrient content between the CBR effluent going into the PBR and effluent coming from the PBR.
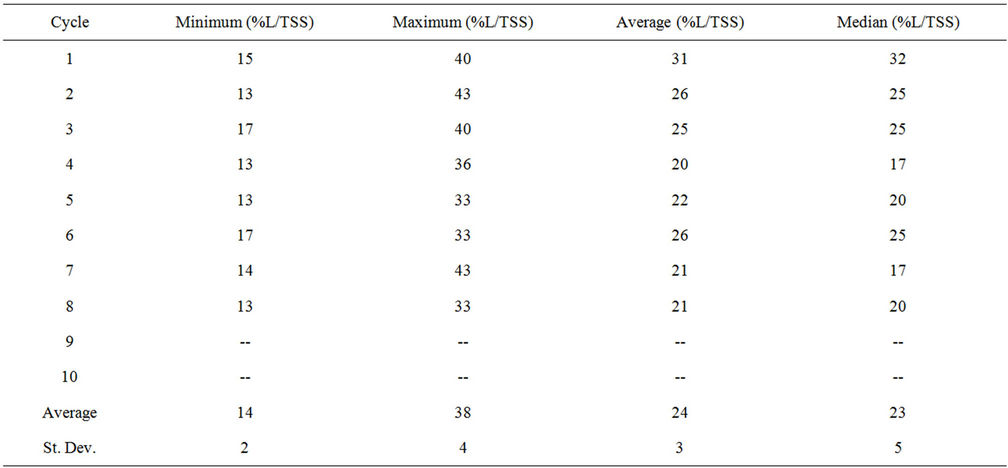
Table S5. Lipid content in algae cells.
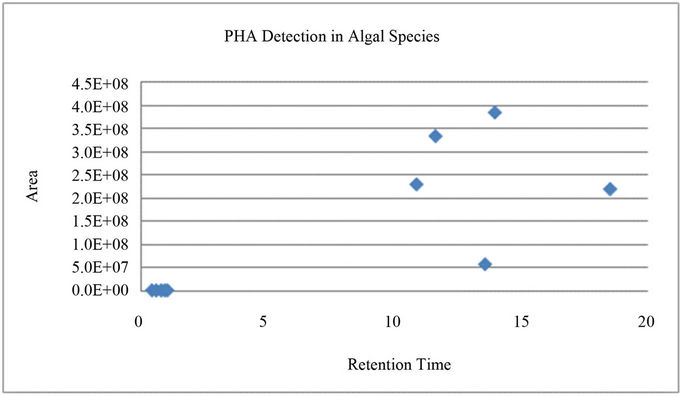
Figure S1. PHA Detection in Algal Species. The peaks with retention times between 10 and 15 minutes are associated with PHAs.
was assumed that the average carbohydrate content was the same over all 10 cycles and was equal to the overall average carbohydrate content.
3) Biomass Growth Biomass growth was measured using the total suspended solids (TSS) of the samples to represent the algal biomass in the reactors. TSS was measured in duplicate at the beginning and end of each cycle. The optical density (OD) of the samples was measured at the beginning and end of each cycle in duplicate. Initial and Final TSS and Initial and Final OD are shown in Table S7.
A correlation between TSS and OD in the system was found from measurements taken during the study period and also for other measurements taken from the PBR before the study period began (Figure S2).
This relationship was calculated so that OD could be used as a non-destructive test to estimate the TSS in the reactor.
1.6. Growth Rate Calculations
The growth rate of the algae in this system was calculated based on the volume of the PBR. The growth rate can be used to determine the potential productivity in the system.
For the reactor with a diameter of 0.075 m and height of 0.15 m:
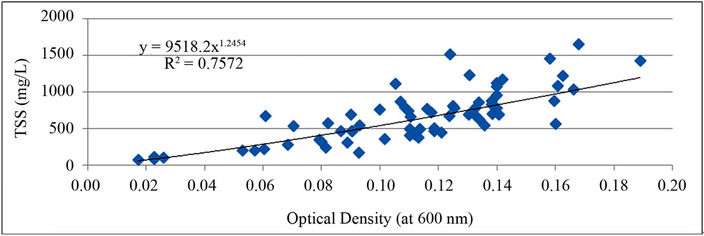
Figure S2. Relationship between optical density and total suspended solids (TSS) in the PBR.
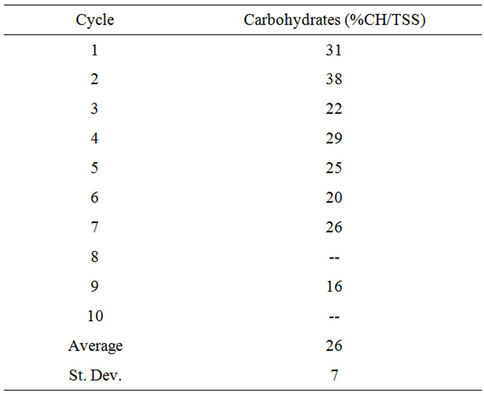
Table S6. Carbohydrate content of algal biomass in the PBR.
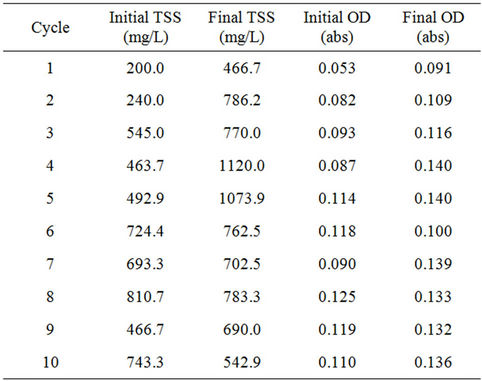
Table S7. Initial and Final total suspended solids (TSS) and optical density (OD) measurements of algal biomass in the PBR.
The reactor volume was calculated as: V = 6.63 × 10⁻⁴ m3.
The potential productivity of the reactor is shown in Table S8.
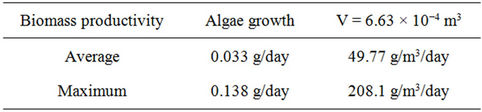
Table S8. Algae productivity based on volume of the PBR.
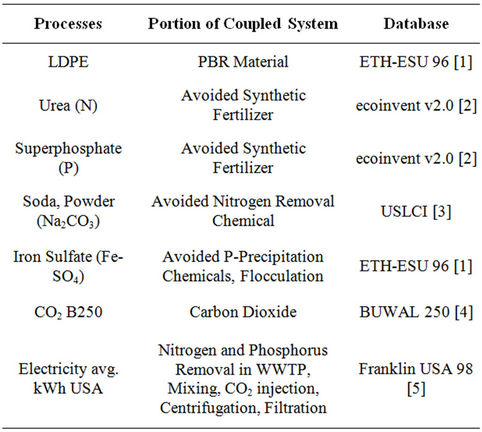
Table S9. Life cycle inventory databases.
2. Life Cycle Assessment Data
2.1. Life Cycle Inventory
The databases used to calculate life cycle impacts of the system are shown in Table S9.
Data inputs to the life cycle inventory, along with the reference for these inputs are found in Table S10.
2.2. Life Cycle Impact Assessment
Inputs to the system were analyzed using the Tool for the Reduction and Assessment of Chemical and Other Environmental Impacts (TRACI) to determine the life cycle environmental impacts of the system [14]. The global warming potential (GWP) and eutrophication potential (EP) of the system were looked at in detail as these are areas of concern specifically related to the study. Addi

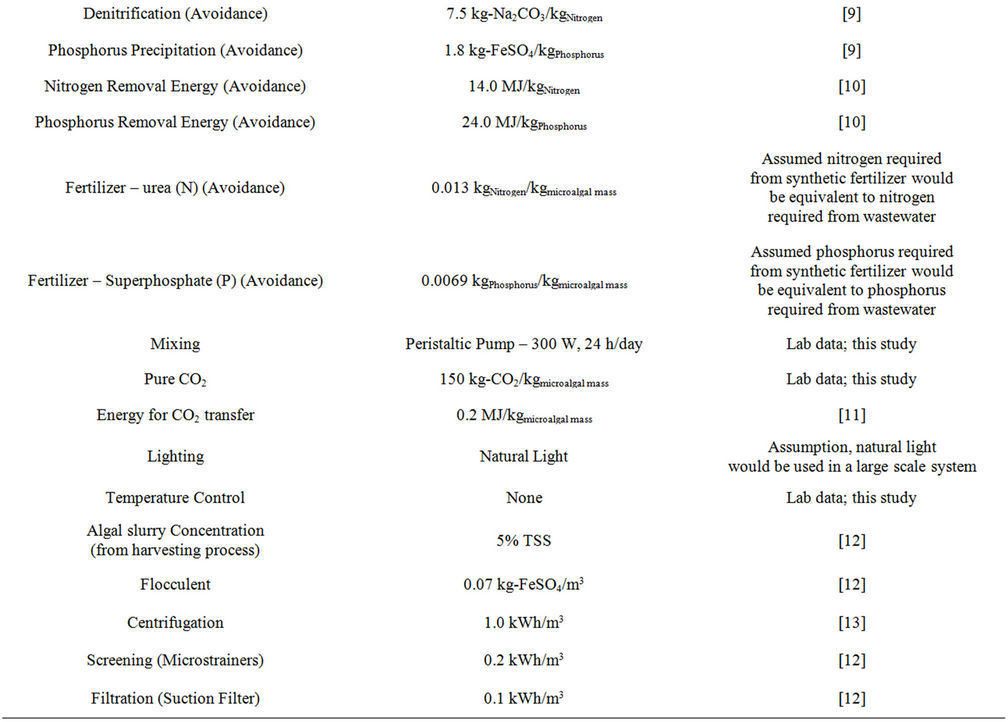
Table S10. Life cycle inventory inputs to the Excel model.
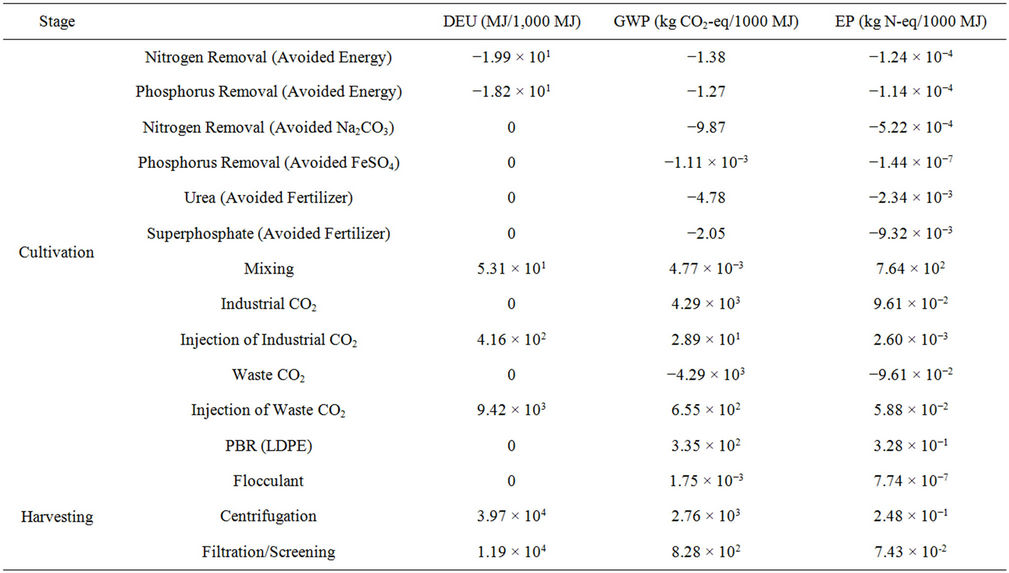
Table S11. Direct Energy Use (DEU), Global Warming Potential (GWP), and Eutrophication Potential (EP) of system during cultivation and harvesting stages.
tionally, the direct energy use (DEU) associated with each portion of the cultivation and harvesting stages was reported (Table S11).
REFERENCES
- R. Frischknecht, PRé Consultants, 2004.
- R. Frischknecht, et al., “The Ecoinvent Database: Overview and Methodological Framework (7 pp),” The International Journal of Life Cycle Assessment, Vol. 10, No. 1 2005, pp. 3-9. doi:10.1065/lca2004.10.181.1
- USLCI, National Renewable Energy Laboratory, 2008.
- R. Spriensma, PRe Consultants, 2004.
- G. A. Norris, PRé Consultants and Sylvatica, 2003.
- L. Lardon, A. Hélias, B. Sialve, J.-P. Steyer and O. Bernard, “Life-Cycle Assessment of Biodiesel Production from Microalgae,” Environmental Science & Technology Vol. 43, No. 17, 2009, pp. 6475-6481. doi:10.1021/es900705j
- P. M. Schenk, et al., “Second Generation Biofuels: HighEfficiency Microalgae for Biodiesel Production,” Bioenergy Research, Vol. 1, No. 1, 2008, pp. 20-43.
- A. P. Carvalho, L. A. Meireles and F. X. Malcata, “Microalgal Reactors: A Review of Enclosed System Designs and Performances,” Biotechnology Progress, Vol. 22, No. 6, 2006, pp. 1490-1506.
- M. Eddy and H. D. Stensel, “Wastewater Engineering: Treatment and Reuse,” McGraw Hill, New York, 2004.
- M. Maurer and T. A. L. Schwegler, “Nutrients in Urine: Energetic Aspects of Removal and Recovery,” Water Science and technology, Vol. 48, No. 1, 2003, pp. 37-46.
- K. L. Kadam, “Environmental Implications of Power Generation via Coal-Microalgae Cofiring,” Energy, Vol. 27, No. 10, 2002, pp. 905-922. doi:10.1016/S0360-5442(02)00025-7
- G. Shelef, A. Sukenik and M. Green, “Microalgae Harvesting and Processing: A Literature Review,” Solar Energy Research Institute, Golden, 1984. doi:10.2172/6204677
- L. Batan, J. Quinn, T. Bradley and B. Willson, “Net Energy and Greenhouse Gas Emissions Evaluation of Biodiesel Derived from Microalgae,” Environmental Science & Technology, Vol. 45, No. 3, 2010, p. 1160. doi:10.1021/es1038479
- J. C. Bare, “Traci,” Journal of Industrial Ecology, Vol. 6, No. 3-4, 2002, pp. 49-78. doi:10.1162/108819802766269539
- V. Riis and W. Mai, “Gas Chromatographic Determination of Polyhydroxybutyric Acid in Microbial Biomass after Hydrochloric Acid Propanolysis,” Journal of Chromatography, Vol. 44, 1988, pp. 285-289.
NOTES
*Supporting Information Available: Supporting information includes nutrient removal, biodiesel production, and the LCA.