Journal of Environmental Protection
Vol. 4 No. 1 (2013) , Article ID: 27341 , 8 pages DOI:10.4236/jep.2013.41017
Decrease of TSP, PM10, and Lead Concentration in a Lead Company in Alexandria City, Egypt
![]()
Department of Evaluation of Natural Sources, Institute of Environmental Studies and Research, Menoufiya University, Menoufiya, Egypt.
Email: *Ashraf_zahran@amatec-az.com
Received October 9th, 2012; revised November 8th, 2012; accepted December 7th, 2012
Keywords: Air Pollution; TSP-PM10-Lead-Dry; Wet Filters
ABSTRACT
The study was carried out in a lead company inside Alexandria which exists in a residential area. Different sites have been selected inside the Department of Lead Improvement to measure TSP, PM10, and heavy lead during the melting process which takes place inside big alloying kettles and from the stack emissions. After that, the company made evaluation of the old factory and decision makers decided to make development for this factory through buying a complete unit for treatment with a special filter to make abatement for the level of emission especially for lead. The aim of this work is: 1) Put a plan for monitoring the level of different pollution after modification and to calculate the percentage of decrease (efficiency) of the new control unit through concentration of TSP, PM10, and lead through different processes; 2) Install a new filter to abate the different air pollutants such as TSP, PM10, and lead. Total Suspended Particulate (TSP) and Respiratory dust (PM10) measured by using Volume sampler and Air mitrix. Lead was measured by the digestion of the samples with a mixture of hydrochloric and nitric acids and using Atomic Absorption Spectrophotometer. Results of measuring TSP, PM10, Lead in working environment, and lead inside stack before and after installation of the new filter showed percentage of decrease from 22% to 120%, 33% to 160%, 26% to 102%, and 51% to 56.5% respectively.
1. Introduction
Various types of diseases, mainly respiratory ones, are common in industrial towns due to air pollution (Sengupta and Venkatachalam 1994 [1]).
The recognition of air pollution as a problem in Egypt dates back only to the early fifties. The problem came into existence because of the rapid growth of industrialization and urbanization [1]. Shalaby (1997) [2], measured lead, cadmium, and zinc in air samples in two urban and rural areas. Gattass, (1996) [3] measured TSP, Pb, Cd, and Zn in one site over Alexandria city.
The size classifies atmospheric aerosols into two types: fine and coarse. Particles less than 2.5 µm in diameter are generally referred to as “fine” and those greater than 2.5 µm diameter as “coarse”. Atmospheric aerosols consist of particles ranging in size from a few tens of Angstroms to several hundred micrometers (Seinfeld, 1986 [4]; and Oblad and Selin, 1986 [5]).
Lead is widely distributed naturally but the greatest risks normally arise from emissions to the environment associated with human use of the metal and its derivatives. Fumes and dust come from smelting of lead, manufacture of insecticides, paint, powder glazes and storage batteries, and from gasoline containing lead additives. Sewage sludge may contain very high levels of lead and its use as a fertilizer may contaminate soils. High levels may occur in urban air as a result of the high traffic density and associated emission of lead from gasoline additives (Harrison and Laxen, 1981 [6]). The US Environmental Protection Agency (EPA) estimated emissions of lead into the atmosphere for the year 1975. Akhter; and Madany (1992) [7] found that the concentrations of lead in street and house dust were 697.2 and 360 µg/g, respectively. These values suggest that the motor vehicles are the major source of these metals in dust samples. Jaffe et al. (1992) [8] measured the lead concentration in urban and rural areas. Urban concentrations were higher than rural concentrations. Sauer and Tyler (1996) [9] found that solvents, greases, and rinse waters from routine vehicle maintenance contain heavy metals. Lead represents the highest concentration among metals in these residues.
Lead Company lies in a residential area inside Alexandria city. This company has a complete unit for melting lead. After that the company made an evaluation of the old factory and decision makers decided to make development for this factory through buying a complete unit for treatment with a special filter (dry and wet) to make abatement for the level of different emissions such as TSP, PM10, and specially for lead. Through the visit some problem has been found in this system such as the position of the two filters (dry and wet). The concentrations of TSP, PM10, and lead were higher than Air Quality Limits (AQL) stipulated by Law 4 for 1994 (Egyptian Environment Law) during melting process which takes place inside a big alloying Kettlees. The idea was that a new filter which is added to this system must be installed. The new filter which was added to the system consists of different steps. First of this step is how to decrease the amount of TSP, PM10 and lead before the old filter and stack. The second step was to manage the amount of additives during the melting process.
2. Material and Methods
This section consists of two sections:
2.1. Sampling
2.1.1. Sampling of TSP, PM10, and Lead
Samples were collected inside the working environment during the melting process and carried out using portable dust sampler type L-2SF.MK3 from Rotheroe and Michell. The sampler has a regulated air flow rate of 50 - 110 liter per minute. The inlet manifold of volume sampler was two meters height from the ground surface. Samples were collected on Whatman GF/A fiberglass filter of 7 cm diameter with a 99% - >99.99% collection efficiency for 0.035 - 1 µm particles (Kathren, 1984 [10]).
2.1.2. Digestion Method
For measuring lead concentrations, the filter paper was placed in desiccators for 48 hrs prior and after the sampling. The analytical balance (Meter) of 0.1 mg sensitivity was used. Digestion method was carried out following the method of Thompson and Walsh (1984) [11] and WMO (1993) [12], for airborne samples.
2.2. New Filter
2.2.1. Metal Filter
This type of filters consists of plates to repel dust, thread metal and dust collection through the cone-shaped bottom hole assembly as in Figures 1 and 2.
2.2.2. Charcool Filter
This filter consists of three parts, two for wool glass and the thirds one is charcoal as in Figure 3.
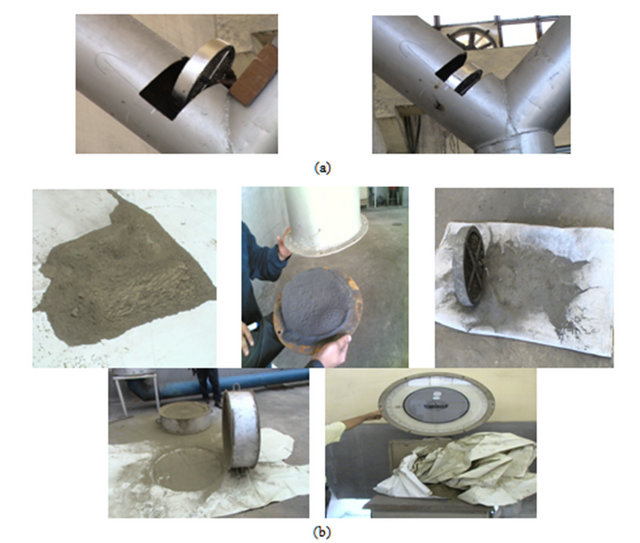
Figure 1. (a) Thread metal; (b) Amount of dust collected by metal filter.
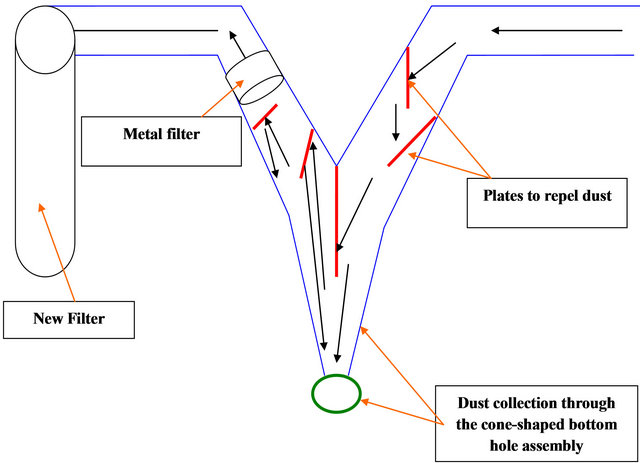
Figure 2. Trapping of dust in the way before filter system.
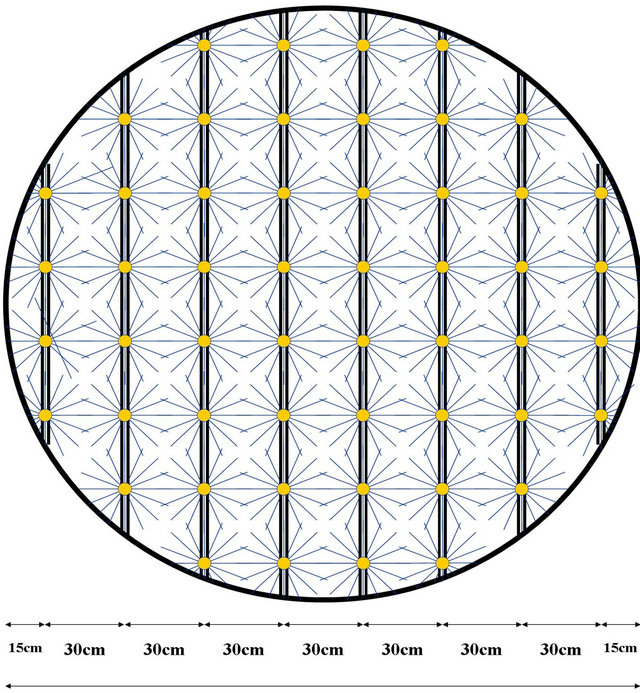
2.2.3. Change of the Design of Wet Scrubber System
The work of a network of pipes with a diameter of 1.5 inches (from the iron and address or of stainless steel or plastic Stoic of chemicals) in the form of boxes along the side of the box 30 cm and shall be installed sprinklers on these pipes from the point of the bottom at the confluence of the ribs as in Figure 4.
3. Results and Discussion
Some stages that were encountered by the experiment through trial and error1) The massive amounts of dust and total suspended particles during the stages of manufacturing and overcoming the filters of different material (coal, felt and metal), where I arrived after a number of days from 3 - 7 to boil about 25 kg of soil;
2) Making pants through the lines to overcome the dust;
3) Changing the felt with an alternative metallic layer;
4) Overcome the sprinkler system with a new system;
5) Installing filters with meadia to get rid of lead;
6) Add the stage and ignition of nitrates, which filters the new units have been several times and the reasons for the passage of molecules cause a burning flame;
7) Noticing that the external environment (sun) has a large effect in the high temperature of the external filter;
8) Changing the additions of sulfur addition to additions in small bags;
9) Raising the environmental awareness of the unit workers so that they can adapt to the new system of rest periods and shifts and the necessary maintenance work based on tables established by the Advisory;
10) Designing the appropriate signs.
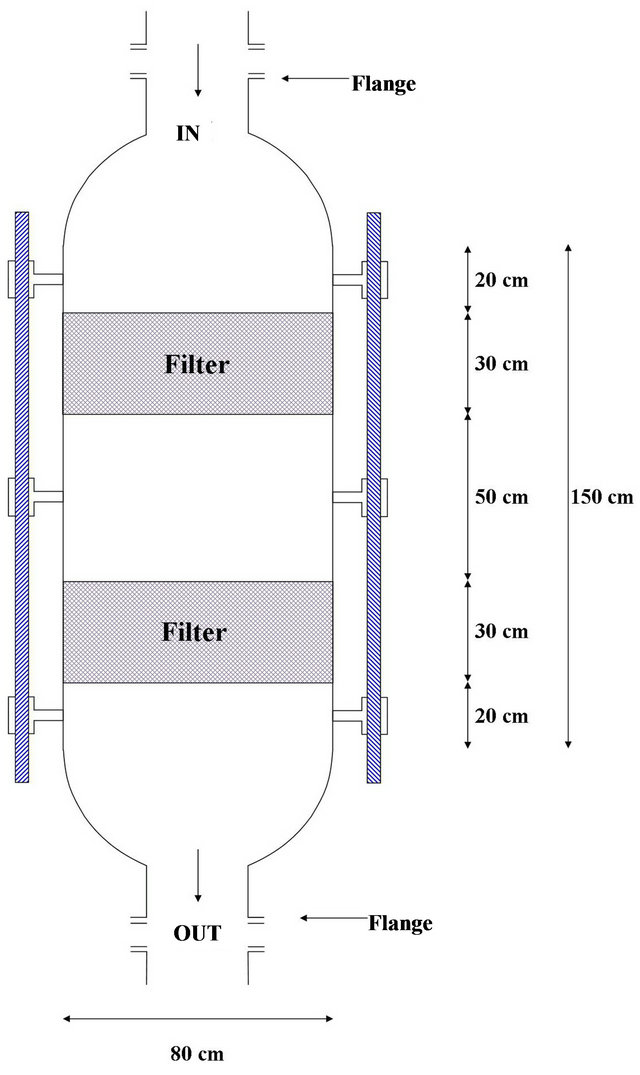
Figure 3. New filter.
240m
Figure 4. Wet scrubber system after modefication.
3.1. Results Show That
3.1.1. TSP
The levels of total suspended particulate (TSP) at selected locations inside the work environment of the company are shown in Table 1 and Figure 5. The concentration of TSP before installed a new filter ranged between 4.5 - 13.4 mg/m3 and ranged between 0.3 - 3.5 mg/m3 after installed the new filter. The Air Quality Limit for air pollutants by Law 4/94 which modified to law 9 for 2009 (Egyptian Environmental Law) [13]. It is important TSP during all processes were lower than AQL except some process recorded levels higher than AQL (10 mg/m3) as shown in Table 2 and Figure 1. The efficiency of decrease for TSP ranged from 22% to 120%. The calculation of the decrease percentage = {(Average of TSP before – Average of TSP after new filter)/AQL} × 100.
The measurements of the new system showed after a new system of control and taking into account the working conditions by workers and follow the instructions developed by the supervisor with the team and the company management and those involved in the management of the unit (factory) that the concentrations of total suspended dust in the work environment was decreased to the extent permitted by law 4 for the year 1994, where were dispensed once and for all Alskm the old way was to follow the right steps in the process of Alskm after raising environmental awareness of the worker and the wearing of protective masks for any emergency conditions and the tightening of sanctions in case of using this method, where up sanctions repeat disconnect the Group and in order to maintain a working environment cleaner. The supervisor recommends periodic follow-up measurements every six months to see how efficient is the new system to avoid any future problems. A good ventilation system must be maintained and regularly maintained.
3.1.2. Particulate Matter Less Than 10 Micrometer (PM10)
The levels of respiratory particles (PM10) at selected locations inside the work environment of the company are shown in Table 2 and Figure 6. The concentration of PM10 before installed a new filter ranged between 1.8 - 5.4 mg/m3 and ranged between 0.3 - 1.2 mg/m3 after installed the new filter. The Air Quality Limit for air pollutants by Law 4/94 which modified to law 9 for 2009
Table 2. Concentration of PM10 (mg/m3) before and after installation of new filter inside the lead company Alexandria City.
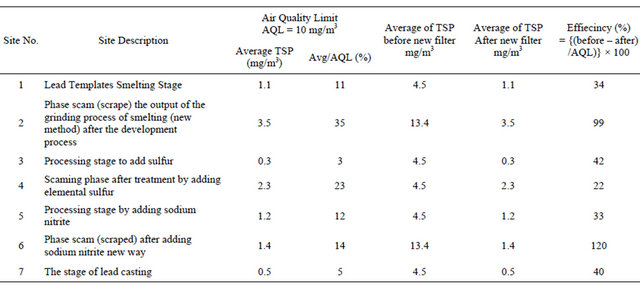
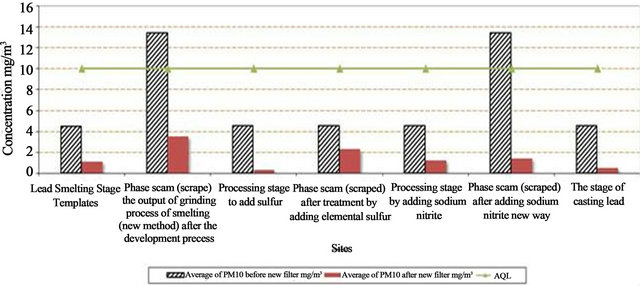
Figure 5. Concentration of TSP (mg/m3) before and after instyallation of new filter inside the lead company Alexandria City.
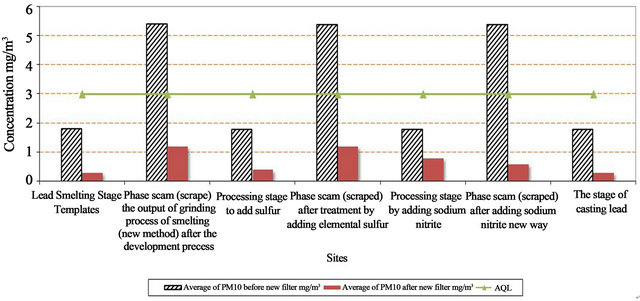
Figure 6. Concentration of PM10 (mg/m3) before and after instyallation of new filter inside the lead company Alexandria City.
(Egyptian Environmental Law) [13]. It is important PM10 during all processes were lower than AQL except some process recorded levels higher than AQL (3 mg/m3) as shown in Table 4 and Figure 6. The efficiency of decrease for PM10 ranged from 33% to 160%. The calcula tion of the decrease percentage = {(Average of PM10 before – Average of PM10 after new filter)/AQL} × 100.
Measurements of the new system showed that the concentrations of the particles less than 10 microns in the work environment were within the limits permitted by the Act 4 of 1994 and the factory management took the decision not to use this old system of scam according to the recommendations of the advisor. A good ventilation system must be regularly maintained. The supervisor recommends periodic follow-up measurements every six months to see how efficient the new system is to avoid any future problems.
3.1.3. Heavy Metals
The levels of lead as heavy metal is shown in Table 3 and Figure 7 and the air quality limits for these metals are shown in Table 4.
The concentration of Pb before installed a new filter ranged between 0.054 - 0.090 mg/m3 and ranged between 0.021 - 0.041 mg/m3 after installed the new filter. The Air Quality Limit for air pollutants by Law 4/94 which modified to law 9 for 2009 (Egyptian Environmental Law) [13]. It is important that Pb during all processes were higher than AQL except one process recorded levels lower than AQL (0.05 mg/m3) as shown in Table 3 and Figure 7. The efficiency of decrease for Pb ranged from 26% to 102%. The calculation of the decrease percentage = {(Average of Pb before – Average of Pb after new filter)/AQL} × 100.
The concentration of Pb inside the stack decrease by 51.0% to 56.5% after installed the new filter as in Table 3 and Figure 8.
4. Conclusions
Lead levels were measured as shown in Table 4. The measurements during the melting and the addition of nitrates exceeded the limits because the oven door was opened for a long period of times. The concentrations in other stages were below the allowable limits.
Table 3. Concentration of lead (Pb) (mg/m3) before and after installation of new filter inside the lead company Alexandria City.
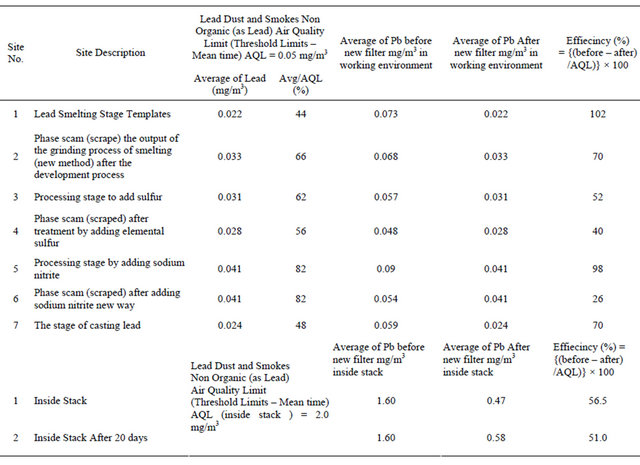
Table 4. Air Quality inside the working environment and water quality for heavy metals according to the Egyptian Law.
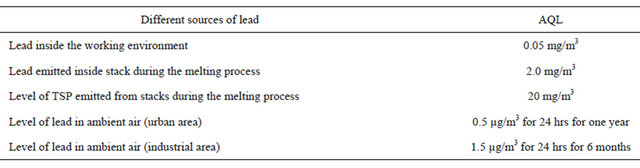
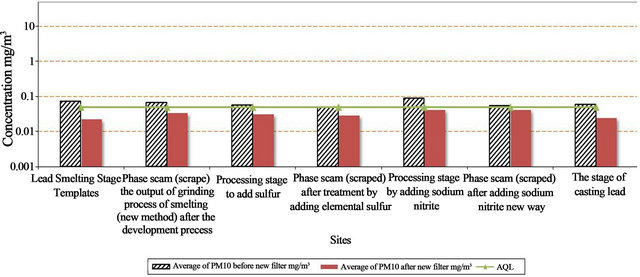
Figure 7. Concentration of Pb (mg/m3) in the workingenvironment before and instyallation of new filter inside the lead company Alexandria City.
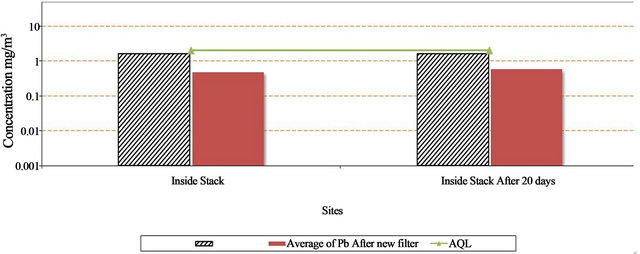
Figure 8. Concentration of Pb (mg/m3) inside stack before and after instyallation of new filter and after 20 days inside the lead company Alexandria City.
Lead inside the stacks was below the allowable limits. This is due to the presence of special filters for reducing lead emissions such as coal filters, metal filters, pants, sprayers.
REFERENCES
- S. Sengupta and P. Venkatachalam, “Health Hazard Assessment in an Industrial Town with the Help of GramGIS,” Environmental Monitoring and Assessment, Vol. 32, No. 2, 1994, pp. 155-160. doi:10.1007/BF00547133
- E. A. Shalaby, “Assessment of Cadmium, Lead, and Zinc in Aerosol, Soil and Leaves of Ficus spp. and Eucaluptus spp. Trees in Some Region of Western Area of Nile Delta,” Mansoura University Journal of Agricultural Sciences, Vol. 22, No. 12, 1997, pp. 4771-4782.
- Z. Ghattas, “Identification and Assessment of Sources of Atmospheric Pollution Based on Receptor Models in Alexandria Egypt,” Ph.D. Thesis, Department of Environmental Studies, Institute of Graduate Studies and Researche, Alex. University, 1992.
- E. A. Shalaby, “Assessment of Cadmium, Lead, and Zinc in Aerosol, Soil and Leaves of Ficus Spp. and Eucaluptus Spp. Trees in Some Region of Western Area of Nile Delta,” Mansoura University Journal of Agricultural Sciences, Vol. 22, No. 12, 1997, pp. 771-782.
- M. Oblad and E. Selin, “Measurements of Elemental Composition in Background Aerosol on the West Coast of Sweden,” Atmospheric Environment, Vol. 20, No. 7, 1986, pp. 1419-1432. doi:10.1016/0004-6981(86)90013-2
- R. M. Harrison and D. P. H Laxen, “Lead Pollution Couses and Control,” Chapman and Holl Ltd., London, 1981. doi:10.1007/978-94-009-5830-2
- M. A. Salim and M. Ismail Madany, “Heavy Metals in Street and House Dust in Bahrain,” Water, Air, and Soil Pollution, Vol. 66, No. 1-2, 1993, pp. 111-119. doi:10.1007/BF00477063
- R. Jaffe, A. Carbrera, H. Carrero and J. Alvardo, “Organic Compounds and Heavy Metals in the Atmosphere of the City of Caracas, Venezueala-II: Atmospheric Deposition,” Water, Air, and Soil Pollution, Vol. 71, No. 3-4, 1992, pp. 315-329. doi:10.1007/BF00480552
- P. A. Saver and E. J. Tyler, “Heavy Metal and Volatile Organic Volatile Organic Chemical Removal and Treatment in On-Site Wastewater Infiltration Systems,” Water, Air, and Soil Pollution, Vol. 89, No. 3-4, 1996, 221-232. doi:10.1007/BF00171633
- R. L. Kathren, Radioactivity in the Environment: Sources, Distribution, and Surveillance,” Harwood Academic Publishers, London, 1984.
- M. Thompson and J. N. Walsh, “A Handbook of Inductively Coupled Plasma Spectrometry,” Chapman and Hall, New York, 1984.
- World Meteorological Organization, “Sample preparation and digestion method for measurement by atomic absorption,” 1993.
- Egyptian Environmental Affairs Agency, “Law 4 for 1994.”
NOTES
*Corresponding author.