Atmospheric and Climate Sciences
Vol.04 No.04(2014), Article ID:50587,5 pages
10.4236/acs.2014.44061
Thermal Flows in the Surface Atmosphere of the Riobamba City
Arquímides Haro1, Cecilia Limaico1, Yolanda Llosas2
1Physics and Mathematical School, Polytechnic School of Chimborazo, Riobamba, Ecuador
2Department of Automatic Control, East University, Santiago, Cuba
Email: arquimidesharo@yahoo.es, cecitere_ln@hotmail.com, yolanda@fie.uo.edu.cu
Copyright © 2014 by authors and Scientific Research Publishing Inc.
This work is licensed under the Creative Commons Attribution International License (CC BY).
http://creativecommons.org/licenses/by/4.0/


Received 23 August 2014; revised 10 September 2014; accepted 6 October 2014
ABSTRACT
This study evaluated the behavior of surface heat fluxes, in the meteorological and physical conditions of the Riobamba city (height of 2754 m regarding the sea level, geographical position 1˚58'58'' Sour of latitude and 78˚39'33'' West of longitude, and it is located in the Ecuadorian inter-Andean alley), these meteorological data were monitored at the ESPOCH stations of the alternative energy group during 2010-2012, and applied information processing dynamic model formulated by Van Ulden and Hostlag, which allows the determination of heat flow of sensible heat, latent heat and surface heat generated in the interaction soil-air. The measures allow us to know the average behavior of the heat flow data with variation between, 38.22, 22.15 and 155.20 W/m2 for the latent, sensible and surface heat respectively, while during the day hours significant variations in these flows that reach maximum values during the day with 139, 127 and 763 W/m2 and minimum at the night −3.9, −27.5 and −263.3 W/m2; results differ from those obtained under normal conditions at sea level.
Keywords:
Thermal flows, radiation, latent heat, surface heat, sensible heat

1. Introduction
The region of the atmosphere, where you find that a direct effect of the earth’s surface (solid or liquid) is the known atmospheric boundary layer, is the region that has an exchange of amount of movement, heat and mass between said surface and the fluid. The most important processes occur in the atmosphere due to air-soil interaction and air-sea. Because of the interactions between the atmosphere and soil, the energy flows occur in different forms and are essential in the dynamic processes, and affect all activities that occur in this place [1] -[6] .
In general, it is considered that at this level the flow is completely turbulent, so that at any point, it typically observed abrupt changes in the value of the velocity, pressure, temperature or humidity. The effect of surface friction of soil warming and evaporation is transmitted by the entire boundary layer quickly and efficiently as a result of turbulent mixing mechanism [7] [8] .
Without turbulence these exchanges would produce a consequence of molecular processes in lowercase magnitudes (from 3.10 to l0−6 times lower than current). The atmospheric boundary layer covers only a small fraction of the atmosphere, and its thickness typically ranges from about 30 to 3000 m, depending on a number of factors (soil warming, wind strength, terrain roughness, etc.). However, small-scale processes that take place in this layer are very important. So for example it should be noted that the energy that involved to large scale meteorological and the circulation of the atmosphere is transmitted through the Boundary Layer to microscale. The atmosphere receives heat from the soil.
2. Material and methods
Using methods proposed by Van Ulden and Hostlag has developed a study of surface fluxes in the atmospheric boundary layer of the Riobamba city. For which is considered when a mass of air flowing over a surface and move to another with different characteristics, its physical properties change. The basic parameters describing air conditions, such as temperature and humidity, begin their transformation into the contact surface, through a series of processes spread layers of greater height, then that portion of the atmosphere where observed the direct effect of the earth’s surface is defined as boundary layer. In it transfers energy from the surface to the atmosphere and vice versa, by turbulent fluxes sensible heat (QH), latent (QE) and momentum. To understand these processes is described in more detail some of the aspects that influence this process [Van Ulden, Hostlag, 1985].
This method is considered, the total energy balance, corresponding to the volume element based on the surface, it contains vegetation and the surrounding atmosphere [9] . A part of the energy it receives, will be used to produce evapotranspiration, and is the most important part in assessing, transforming the result, evaporated water units.
Energy balance equation, in simplified form is:
 (1)
(1)
· RN Net radiation flux
· QG Stored heat flux in the soil
· QH sensible heat flux. The sensible heater presents: the heat that is emitted from the surfaces to the air by conduction or convection (H), as the heat flows by conduction to the ground (G).
· QE Latent heat flux
Starting from

Means a = 0.1 for rural areas and a = 0.3 for urban areas (Doll, D., Ching, J.K.S. y Kaneshire, J.).
 (2)
(2)
where is a constant, which we assume equal to 20 W/m2. Parameter “S” is defined by:
 (3)
(3)
Net radiation is observed, and can also be parameterized. Based on the albedo “A” (found in tables), solar elevation angle θ. Cloudiness fraction N, flow shortwave radiation “ ” and the temperature at the surface of the earth T:
 (4)
(4)
Means:
s = 5.67 × 10 − 8 W/m2 K4 is the Stefan-Boltzmann constant
c1 = 5.31 × 10 − 13 W/m2 K6 and 
The parameter “c3” is given by the formula:
 (5)
(5)
When QS not observed, it can be parameterized as a function of f and N (Holtslag and Van Ulden).


[Van Ulden, Hostlag, 1985]
3. Results and Discussion
First, we present a table 1 which shows: the average values of meteorological data as a tool to develop the work [7] .
With the data collected, for each hour. During two years of analysis, were processed by Van Ulden Hostlang model. Developed in Fortran-coded software, in the study of diffusion of air pollutants in the Industrial Park of Riobamba [10] , which allows calculations to be later processed and analyzed for each day, hours and months, which are presented below.
The variation of the flow of heat and radiation, quite regular observed on different days (Figure 1), particularly this is greater in the latent heat and surface [11] .
In medium there is a difference between the sensible heat and latent heat surface heat, the first higher value, as indicated in Table 2. Similarly, between maximum and minimum, however, one can see that there are no significant fluctuations.
The variation of heat fluxes by hours, is more significant during different times of the day; 10:00 am and 15:00 pm the most intense, in the case of sensible heat and net radiation, while the latent heat flux and surface increase in the night (Figure 2).
Average parameters of the flow, and radiation unlike what happens between day variation for times between maximum and minimum is significant and is indicated in Table 3, particularly for the sensible heat.
The heat and radiation fluctuations during the months of July and August have some increase in the sensible heat flux and net radiation (Figure 2), but this is not very significant compared to what happens between hours (Figure 3).
The monthly variation between maximum and minimum heat fluxes and radiation does not exhibit variations. In this way it has been determined: regular months and in days, which did not happen with the hours for the area of the city of Riobamba (Table 4).
Finally we present some results of the calculation of sensible and latent heat model made for Van Ulden and Hostlag in the city of Cabauw in the Netherlands in which presents results of such flows for hours during these days [10] , Figure 4.

Table 1. Meteorological parameters measured the main meteorological variables in Riobamba city during the two years of analysis.
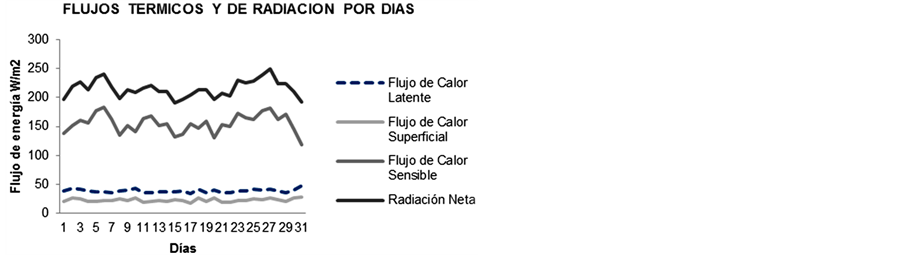
Figure 1. Surface energy fluxes calculated for days—Riobamba city.
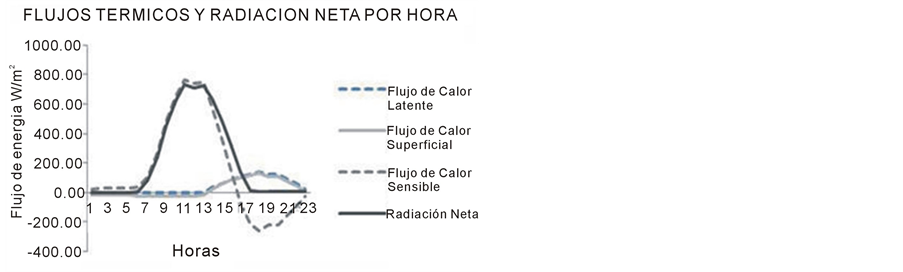
Figure 2. Surfaces energy fluxes, calculated by hours—Rio- bamba city.

Figure 3. Surface energy flows by month—Riobamba City.
Table 2. Surface heat fluxes and net radiation: medium, maximum and minimum. By days—Riobamba city.
Table 3. Surface heat fluxes and net radiation: medium, maximum and minimum by hours—Riobamba City.
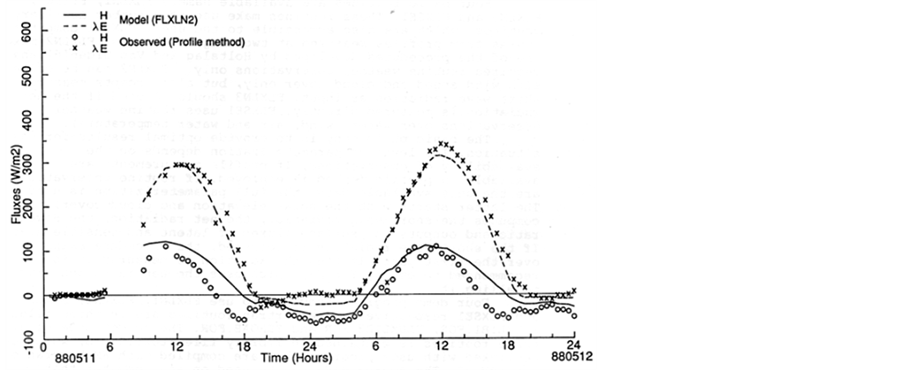
Figure 4. Results of the model run in Cabauw in the Netherlands on 11 and 12 May 1988, with meteorological data of the area, with H sensible heat and latent heat λE using the model FLXLN2.
Table 4. Surface heat fluxes and net radiation medium, maximum and minimum, bymonths Riobamba City.
4. Conclusions
· The sensible heat flux increases rapidly under the physical and meteorological conditions of the Ecuadorian highlands (Riobamba), increasing rapidly during daylight hours (exceeding 734 W/m2 between the hours of noon), it is different to the Cabuw results, which present a very modest growth.
· The flow of latent heat is smaller than that of sensible heat in Riobamba city, in contrast with Cabauw, where it exceeds the latent heat; this is due to the effect of energy flows for the particular conditions of the Ecuadorian highlands and its geographical position or height above the sea level.
· The behavior of heat fluxes and net radiation is different between hours and months, and it is more variant in the first case than that in the second case.
· The present study indicates that there exist different behaviors between sea level and highland, and effects that should catch in counting for applications that depend on these factors.
Acknowledgements
Thanks to the alternative energy group of the ESPOCH for help our whit meteorological data and the project “Diffusion study of atmospheric pollutants in the Industrial Park of Riobamba” for to facilitate us the software.
References
- Pareja, M.A. (2010) Radiación solar y su aprovechamiento energético. Marcombo S.A., Barcelona España.
- Creus, A. (2010) Energía termosolar. Cano pina S. L., Cataluña España.
- Fernandez, J. (2010) Compendio de energía solar. ed. Mundi-prensa, Madrid-España.
- Cañada, J. and Salvador, D. (1997) Radiación solar. ed. Servicio de publicaciones de la Universidad Politécnica de Valencia, Valencia España, 29-39, 47-63.
- Dal Pai, A.., Escobedo, J., Gomes, E. and Souza, A. (2011) Estimativas das componentes da radiacao solar incidente em superficies inclinadas baseadas na radiacao global horizontal. Mar., Revista Brasileira de Engenharia Agricola e Ambiental.
- Kiely, G. (1999) Ingeniería Ambiental. Tomo II y III, McGRAW-HILL, España.
- Reyes, S. (2001) Introducción a la meteorología. Universidad de Baja California, 30-50.
- Finzi, B. (1991) La qualitá dell'aria; Modelli previsionali e gestionali. Masson, Milano.
- Van Ulden, H. (1985) Estimation of Atmospheric Boundary Layer Parameters for Diffusion Applications. Journal of climate and Applied Metereology, 24, 1196-1207.
- Haro, A. (2003) Estudio de difusión de contaminantes en el Parque Industrial Riobamba. Informe Proyecto, Riobamba- Ecuador.
- Businger, W. and Izumi, B. (1971) Flux-Profile Relationships in the Atmospheric Surface Layer. Journal of the Atmospheric Sciences, 28, 181-189. http://dx.doi.org/10.1175/1520-0469(1971)028<0181:FPRITA>2.0.CO;2